

Key Insights
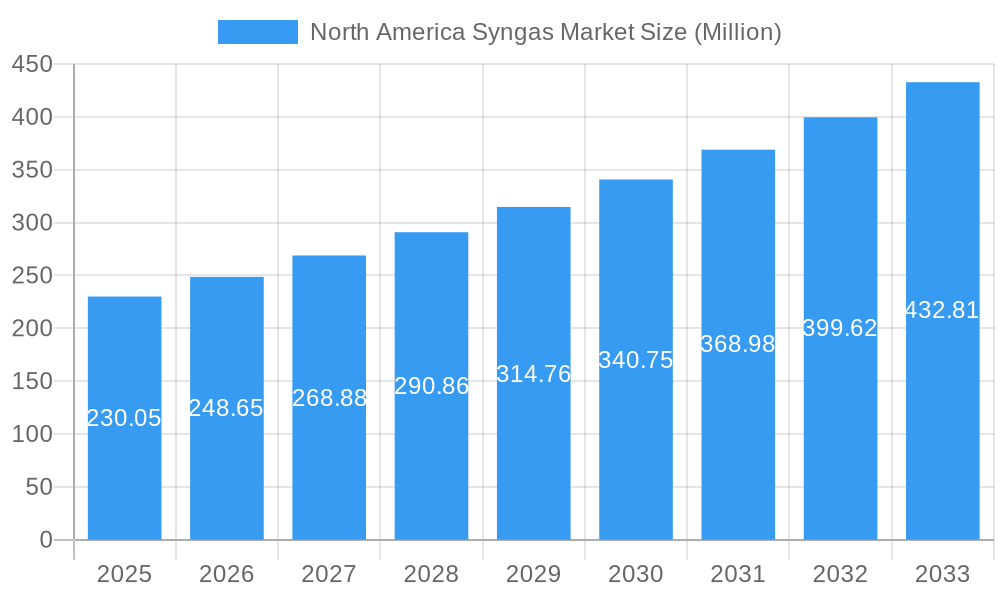
The North American syngas market, valued at $230.05 million in 2025, is projected to experience robust growth, driven by increasing demand for cleaner energy sources and the expanding chemical industry. A compound annual growth rate (CAGR) exceeding 8% from 2025 to 2033 indicates a significant market expansion. Key drivers include the growing adoption of syngas in power generation, fueled by government initiatives promoting renewable energy and a shift away from fossil fuels. The chemical sector's reliance on syngas as a crucial feedstock for producing various chemicals, including dimethyl ether (DME), further bolsters market growth. Furthermore, the increasing utilization of diverse feedstocks like coal, natural gas, biomass, and petroleum coke contributes to market dynamism. Technological advancements in gasification methods, such as steam reforming, partial oxidation, and auto-thermal reforming, are also enhancing efficiency and cost-effectiveness, driving market expansion. The market segmentation reveals a strong presence across various gasifier types (fixed bed, entrained flow, fluidized bed) and applications.
North America Syngas Market Market Size (In Million)
However, market restraints include the high capital expenditure associated with syngas production facilities and the fluctuating prices of feedstocks. Environmental concerns related to greenhouse gas emissions and the stringent regulatory landscape surrounding emissions also pose challenges. Despite these constraints, the overall market outlook remains positive, with significant opportunities arising from advancements in carbon capture and storage technologies and increasing government support for sustainable energy solutions. Major players like Haldor Topsoe, TechnipFMC, General Electric, and others are actively involved in driving innovation and expanding their market presence through strategic partnerships and technological improvements. The North American market, encompassing the United States, Canada, and Mexico, is expected to lead regional growth due to its robust industrial infrastructure and government policies supporting clean energy transitions. Future growth is highly correlated with the development and adoption of sustainable syngas production methods to address environmental concerns and enhance economic viability.
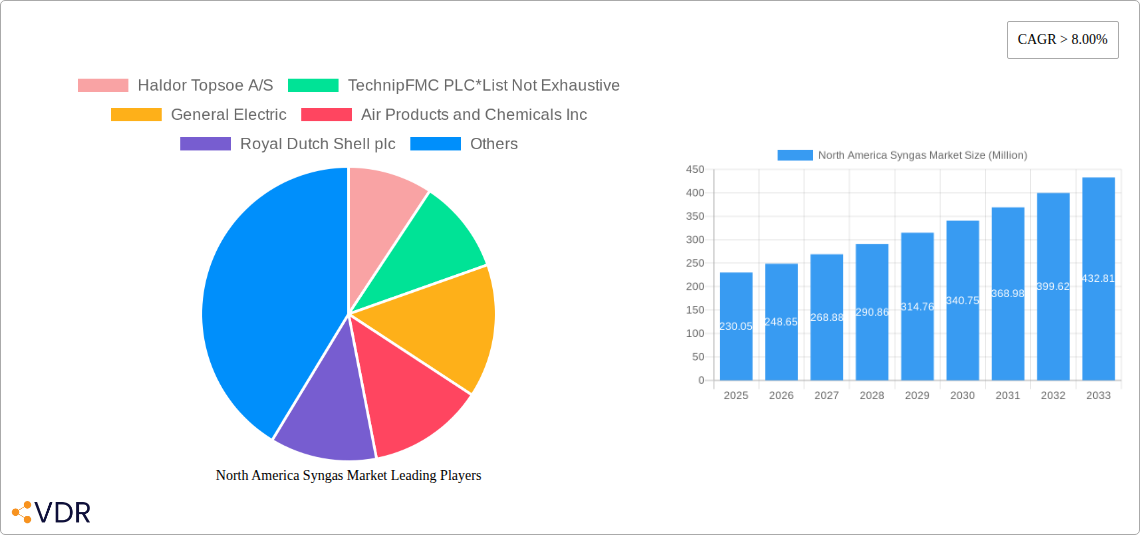
North America Syngas Market Company Market Share
North America Syngas Market: A Comprehensive Report (2019-2033)
This comprehensive report offers an in-depth analysis of the North America syngas market, encompassing its dynamics, growth trends, dominant segments, and future outlook. With a study period spanning 2019-2033, a base year of 2025, and a forecast period of 2025-2033, this report provides crucial insights for industry professionals, investors, and stakeholders seeking to understand and capitalize on this evolving market. The report is valued at xx Million units.
North America Syngas Market Market Dynamics & Structure
The North American syngas market is characterized by moderate concentration, with key players like Haldor Topsoe A/S, TechnipFMC PLC, General Electric, Air Products and Chemicals Inc, Royal Dutch Shell plc, and Siemens holding significant market share. The market's dynamics are shaped by technological advancements, stringent environmental regulations, and the increasing demand for cleaner energy sources. Competition from alternative fuels and fluctuating feedstock prices present ongoing challenges. The historical period (2019-2024) witnessed a xx% market share for the top five players, while the estimated year (2025) projects this to reach xx%. M&A activity has been moderate, with approximately xx deals recorded during the historical period.
- Market Concentration: Moderately concentrated, with a few dominant players.
- Technological Innovation: Driven by advancements in gasification technologies and carbon capture.
- Regulatory Framework: Stringent emission standards influencing technology adoption.
- Competitive Substitutes: Natural gas, renewable energy sources.
- End-User Demographics: Primarily power generation, chemical industries, and liquid fuel production.
- M&A Trends: Moderate activity, focused on strengthening market position and technological capabilities. Innovation barriers include high capital investment requirements and complex regulatory approvals.
North America Syngas Market Growth Trends & Insights
The North American syngas market is poised for robust expansion, demonstrating a dynamic Compound Annual Growth Rate (CAGR) of approximately [Insert CAGR % Here] during the historical period of 2019-2024. This growth is significantly fueled by the escalating demand for efficient power generation and critical chemical feedstock applications. Within the power generation sector, syngas utilization currently stands at around [Insert Current Market Penetration % Here] and is projected to ascend to an impressive [Insert Projected Market Penetration % Here] by 2033. The market landscape is being profoundly reshaped by technological advancements, including breakthroughs in biomass gasification processes and the development of sophisticated carbon capture technologies. Concurrently, a discernible shift in consumer behavior towards sustainability is actively bolstering the demand for syngas derived from renewable feedstocks. The overall market size is anticipated to reach a substantial [Insert Projected Market Size Million Units Here] Million units by 2033.
Dominant Regions, Countries, or Segments in North America Syngas Market
The [mention specific region, e.g., the Gulf Coast region] in the United States currently dominates the North American syngas market due to its established infrastructure, abundant natural gas resources, and concentration of power generation and chemical facilities. The Entrained Flow gasifier type holds the largest market share (xx%) due to its high efficiency and suitability for various feedstocks. Power generation remains the largest application segment (xx%), followed by the chemical industry. Natural gas is the primary feedstock (xx%), with growing interest in biomass gasification.
- Key Drivers: Abundant natural gas resources, established infrastructure, government support for clean energy initiatives.
- Dominance Factors: Cost-effectiveness, efficient gasification technologies, and strong industry presence.
- Growth Potential: Expansion into biomass-based syngas and carbon capture utilization and storage (CCUS) projects.
North America Syngas Market Product Landscape
The syngas market features a range of gasifier types (fixed bed, entrained flow, fluidized bed), each tailored to specific feedstocks and applications. Recent innovations focus on improving efficiency, reducing emissions, and expanding the range of usable feedstocks. Technological advancements include the integration of carbon capture and utilization technologies, enhancing the environmental sustainability of syngas production. Key selling propositions include high energy content, flexibility in feedstock use, and suitability for diverse applications.
Key Drivers, Barriers & Challenges in North America Syngas Market
Key Drivers:
- Increasing demand for electricity and chemicals
- Growing focus on renewable energy sources
- Government incentives for clean energy technologies
Challenges and Restraints:
- High capital expenditure and operational costs
- Environmental regulations and emission standards
- Fluctuations in feedstock prices and availability
- Competition from alternative fuels, e.g., xx% market share loss projected by 2033 due to renewable energy competition.
Emerging Opportunities in North America Syngas Market
- Expansion of biomass gasification to leverage renewable feedstocks and reduce carbon footprint.
- Integration of carbon capture and utilization (CCUS) technologies to create a more sustainable syngas production process.
- Development of advanced gasification technologies to improve efficiency and reduce costs.
- Growth in the production of value-added chemicals from syngas.
Growth Accelerators in the North America Syngas Market Industry
The long-term trajectory of the North American syngas market will be propelled by continuous technological innovation, with a particular emphasis on advancements in carbon capture and utilization (CCU) technologies, alongside the scaled-up production of syngas from an expanding range of renewable feedstocks. The formation of strategic alliances and collaborative partnerships between leading technology providers, major energy corporations, and prominent chemical manufacturers will be indispensable for accelerating market penetration and driving overall growth. Furthermore, sustained and amplified government support for clean energy initiatives and sustainable industrial practices will serve as a significant catalyst for market expansion.
Key Players Shaping the North America Syngas Market Market
- Haldor Topsoe A/S
- TechnipFMC PLC
- General Electric
- Air Products and Chemicals Inc
- Royal Dutch Shell plc
- Siemens
- KBR Inc
- BASF SE
- Sasol
- Linde plc
- SynGas Technology LLC
- Air Liquide
- BP plc
- Dakota Gasification Company Inc
Notable Milestones in North America Syngas Market Sector
- 2021: Air Products made a significant announcement regarding a major investment in cutting-edge carbon capture technology aimed at enhancing its syngas production facilities.
- 2022: A strategic partnership was established between TechnipFMC and a forward-thinking renewable energy company to spearhead the development of innovative biomass-based syngas production methods.
- 2023: A notable expansion of a biomass gasification facility located in [Insert State/Region Here] successfully increased its syngas production capacity by an impressive [Insert Capacity Increase % Here]%.
In-Depth North America Syngas Market Market Outlook
The North American syngas market presents a compelling outlook characterized by substantial growth potential, primarily driven by the intensifying global demand for clean energy solutions and the increasing imperative for sustainable chemical production. The market's future trajectory will be significantly shaped by the strategic focus on advancing carbon capture and utilization technologies, coupled with the widespread adoption and expansion of biomass gasification processes. Moreover, the cultivation of strategic partnerships and the channeling of investments into cutting-edge technological solutions will be paramount in unlocking the market's complete potential, thereby creating a wealth of promising opportunities for all industry stakeholders.
North America Syngas Market Segmentation
-
1. Feedstock
- 1.1. Coal
- 1.2. Natural Gas
- 1.3. Petroleum
- 1.4. Pet-coke
- 1.5. Biomass
-
2. Technology
- 2.1. Steam Reforming
- 2.2. Partial Oxidation
- 2.3. Auto-thermal Reforming
- 2.4. Combined or Two-step Reforming
- 2.5. Biomass Gasification
-
3. Gasifier Type
- 3.1. Fixed Bed
- 3.2. Entrained Flow
- 3.3. Fluidized Bed
-
4. Application
- 4.1. Power Generation
-
4.2. Chemicals
- 4.2.1. Methanol
- 4.2.2. Ammonia
- 4.2.3. Oxo Chemicals
- 4.2.4. n-Butanol
- 4.2.5. Hydrogen
- 4.2.6. Dimethyl Ether
- 4.3. Liquid Fuels
- 4.4. Gaseous Fuels
-
5. Geography
- 5.1. United States
- 5.2. Canada
- 5.3. Mexico
- 5.4. Rest of North America
North America Syngas Market Segmentation By Geography
- 1. United States
- 2. Canada
- 3. Mexico
- 4. Rest of North America
North America Syngas Market Regional Market Share
Geographic Coverage of North America Syngas Market
North America Syngas Market REPORT HIGHLIGHTS
| Aspects | Details |
|---|---|
| Study Period | 2020-2034 |
| Base Year | 2025 |
| Estimated Year | 2026 |
| Forecast Period | 2026-2034 |
| Historical Period | 2020-2025 |
| Growth Rate | CAGR of > 8.00% from 2020-2034 |
| Segmentation |
|
Table of Contents
- 1. Introduction
- 1.1. Research Scope
- 1.2. Market Segmentation
- 1.3. Research Objective
- 1.4. Definitions and Assumptions
- 2. Executive Summary
- 2.1. Market Snapshot
- 3. Market Dynamics
- 3.1. Market Drivers
- 3.2. Market Restrains
- 3.3. Market Trends
- 3.4. Market Opportunities
- 4. Market Factor Analysis
- 4.1. Porters Five Forces
- 4.1.1. Bargaining Power of Suppliers
- 4.1.2. Bargaining Power of Buyers
- 4.1.3. Threat of New Entrants
- 4.1.4. Threat of Substitutes
- 4.1.5. Competitive Rivalry
- 4.2. PESTEL analysis
- 4.3. BCG Analysis
- 4.3.1. Stars (High Growth, High Market Share)
- 4.3.2. Cash Cows (Low Growth, High Market Share)
- 4.3.3. Question Mark (High Growth, Low Market Share)
- 4.3.4. Dogs (Low Growth, Low Market Share)
- 4.4. Ansoff Matrix Analysis
- 4.5. Supply Chain Analysis
- 4.6. Regulatory Landscape
- 4.7. Current Market Potential and Opportunity Assessment (TAM–SAM–SOM Framework)
- 4.8. VDR Analyst Note
- 4.1. Porters Five Forces
- 5. Market Analysis, Insights and Forecast 2021-2033
- 5.1. Market Analysis, Insights and Forecast - by Feedstock
- 5.1.1. Coal
- 5.1.2. Natural Gas
- 5.1.3. Petroleum
- 5.1.4. Pet-coke
- 5.1.5. Biomass
- 5.2. Market Analysis, Insights and Forecast - by Technology
- 5.2.1. Steam Reforming
- 5.2.2. Partial Oxidation
- 5.2.3. Auto-thermal Reforming
- 5.2.4. Combined or Two-step Reforming
- 5.2.5. Biomass Gasification
- 5.3. Market Analysis, Insights and Forecast - by Gasifier Type
- 5.3.1. Fixed Bed
- 5.3.2. Entrained Flow
- 5.3.3. Fluidized Bed
- 5.4. Market Analysis, Insights and Forecast - by Application
- 5.4.1. Power Generation
- 5.4.2. Chemicals
- 5.4.2.1. Methanol
- 5.4.2.2. Ammonia
- 5.4.2.3. Oxo Chemicals
- 5.4.2.4. n-Butanol
- 5.4.2.5. Hydrogen
- 5.4.2.6. Dimethyl Ether
- 5.4.3. Liquid Fuels
- 5.4.4. Gaseous Fuels
- 5.5. Market Analysis, Insights and Forecast - by Geography
- 5.5.1. United States
- 5.5.2. Canada
- 5.5.3. Mexico
- 5.5.4. Rest of North America
- 5.6. Market Analysis, Insights and Forecast - by Region
- 5.6.1. United States
- 5.6.2. Canada
- 5.6.3. Mexico
- 5.6.4. Rest of North America
- 5.1. Market Analysis, Insights and Forecast - by Feedstock
- 6. North America Syngas Market Analysis, Insights and Forecast, 2021-2033
- 6.1. Market Analysis, Insights and Forecast - by Feedstock
- 6.1.1. Coal
- 6.1.2. Natural Gas
- 6.1.3. Petroleum
- 6.1.4. Pet-coke
- 6.1.5. Biomass
- 6.2. Market Analysis, Insights and Forecast - by Technology
- 6.2.1. Steam Reforming
- 6.2.2. Partial Oxidation
- 6.2.3. Auto-thermal Reforming
- 6.2.4. Combined or Two-step Reforming
- 6.2.5. Biomass Gasification
- 6.3. Market Analysis, Insights and Forecast - by Gasifier Type
- 6.3.1. Fixed Bed
- 6.3.2. Entrained Flow
- 6.3.3. Fluidized Bed
- 6.4. Market Analysis, Insights and Forecast - by Application
- 6.4.1. Power Generation
- 6.4.2. Chemicals
- 6.4.2.1. Methanol
- 6.4.2.2. Ammonia
- 6.4.2.3. Oxo Chemicals
- 6.4.2.4. n-Butanol
- 6.4.2.5. Hydrogen
- 6.4.2.6. Dimethyl Ether
- 6.4.3. Liquid Fuels
- 6.4.4. Gaseous Fuels
- 6.5. Market Analysis, Insights and Forecast - by Geography
- 6.5.1. United States
- 6.5.2. Canada
- 6.5.3. Mexico
- 6.5.4. Rest of North America
- 6.1. Market Analysis, Insights and Forecast - by Feedstock
- 7. United States North America Syngas Market Analysis, Insights and Forecast, 2021-2033
- 7.1. Market Analysis, Insights and Forecast - by Feedstock
- 7.1.1. Coal
- 7.1.2. Natural Gas
- 7.1.3. Petroleum
- 7.1.4. Pet-coke
- 7.1.5. Biomass
- 7.2. Market Analysis, Insights and Forecast - by Technology
- 7.2.1. Steam Reforming
- 7.2.2. Partial Oxidation
- 7.2.3. Auto-thermal Reforming
- 7.2.4. Combined or Two-step Reforming
- 7.2.5. Biomass Gasification
- 7.3. Market Analysis, Insights and Forecast - by Gasifier Type
- 7.3.1. Fixed Bed
- 7.3.2. Entrained Flow
- 7.3.3. Fluidized Bed
- 7.4. Market Analysis, Insights and Forecast - by Application
- 7.4.1. Power Generation
- 7.4.2. Chemicals
- 7.4.2.1. Methanol
- 7.4.2.2. Ammonia
- 7.4.2.3. Oxo Chemicals
- 7.4.2.4. n-Butanol
- 7.4.2.5. Hydrogen
- 7.4.2.6. Dimethyl Ether
- 7.4.3. Liquid Fuels
- 7.4.4. Gaseous Fuels
- 7.5. Market Analysis, Insights and Forecast - by Geography
- 7.5.1. United States
- 7.5.2. Canada
- 7.5.3. Mexico
- 7.5.4. Rest of North America
- 7.1. Market Analysis, Insights and Forecast - by Feedstock
- 8. Canada North America Syngas Market Analysis, Insights and Forecast, 2021-2033
- 8.1. Market Analysis, Insights and Forecast - by Feedstock
- 8.1.1. Coal
- 8.1.2. Natural Gas
- 8.1.3. Petroleum
- 8.1.4. Pet-coke
- 8.1.5. Biomass
- 8.2. Market Analysis, Insights and Forecast - by Technology
- 8.2.1. Steam Reforming
- 8.2.2. Partial Oxidation
- 8.2.3. Auto-thermal Reforming
- 8.2.4. Combined or Two-step Reforming
- 8.2.5. Biomass Gasification
- 8.3. Market Analysis, Insights and Forecast - by Gasifier Type
- 8.3.1. Fixed Bed
- 8.3.2. Entrained Flow
- 8.3.3. Fluidized Bed
- 8.4. Market Analysis, Insights and Forecast - by Application
- 8.4.1. Power Generation
- 8.4.2. Chemicals
- 8.4.2.1. Methanol
- 8.4.2.2. Ammonia
- 8.4.2.3. Oxo Chemicals
- 8.4.2.4. n-Butanol
- 8.4.2.5. Hydrogen
- 8.4.2.6. Dimethyl Ether
- 8.4.3. Liquid Fuels
- 8.4.4. Gaseous Fuels
- 8.5. Market Analysis, Insights and Forecast - by Geography
- 8.5.1. United States
- 8.5.2. Canada
- 8.5.3. Mexico
- 8.5.4. Rest of North America
- 8.1. Market Analysis, Insights and Forecast - by Feedstock
- 9. Mexico North America Syngas Market Analysis, Insights and Forecast, 2021-2033
- 9.1. Market Analysis, Insights and Forecast - by Feedstock
- 9.1.1. Coal
- 9.1.2. Natural Gas
- 9.1.3. Petroleum
- 9.1.4. Pet-coke
- 9.1.5. Biomass
- 9.2. Market Analysis, Insights and Forecast - by Technology
- 9.2.1. Steam Reforming
- 9.2.2. Partial Oxidation
- 9.2.3. Auto-thermal Reforming
- 9.2.4. Combined or Two-step Reforming
- 9.2.5. Biomass Gasification
- 9.3. Market Analysis, Insights and Forecast - by Gasifier Type
- 9.3.1. Fixed Bed
- 9.3.2. Entrained Flow
- 9.3.3. Fluidized Bed
- 9.4. Market Analysis, Insights and Forecast - by Application
- 9.4.1. Power Generation
- 9.4.2. Chemicals
- 9.4.2.1. Methanol
- 9.4.2.2. Ammonia
- 9.4.2.3. Oxo Chemicals
- 9.4.2.4. n-Butanol
- 9.4.2.5. Hydrogen
- 9.4.2.6. Dimethyl Ether
- 9.4.3. Liquid Fuels
- 9.4.4. Gaseous Fuels
- 9.5. Market Analysis, Insights and Forecast - by Geography
- 9.5.1. United States
- 9.5.2. Canada
- 9.5.3. Mexico
- 9.5.4. Rest of North America
- 9.1. Market Analysis, Insights and Forecast - by Feedstock
- 10. Rest of North America North America Syngas Market Analysis, Insights and Forecast, 2021-2033
- 10.1. Market Analysis, Insights and Forecast - by Feedstock
- 10.1.1. Coal
- 10.1.2. Natural Gas
- 10.1.3. Petroleum
- 10.1.4. Pet-coke
- 10.1.5. Biomass
- 10.2. Market Analysis, Insights and Forecast - by Technology
- 10.2.1. Steam Reforming
- 10.2.2. Partial Oxidation
- 10.2.3. Auto-thermal Reforming
- 10.2.4. Combined or Two-step Reforming
- 10.2.5. Biomass Gasification
- 10.3. Market Analysis, Insights and Forecast - by Gasifier Type
- 10.3.1. Fixed Bed
- 10.3.2. Entrained Flow
- 10.3.3. Fluidized Bed
- 10.4. Market Analysis, Insights and Forecast - by Application
- 10.4.1. Power Generation
- 10.4.2. Chemicals
- 10.4.2.1. Methanol
- 10.4.2.2. Ammonia
- 10.4.2.3. Oxo Chemicals
- 10.4.2.4. n-Butanol
- 10.4.2.5. Hydrogen
- 10.4.2.6. Dimethyl Ether
- 10.4.3. Liquid Fuels
- 10.4.4. Gaseous Fuels
- 10.5. Market Analysis, Insights and Forecast - by Geography
- 10.5.1. United States
- 10.5.2. Canada
- 10.5.3. Mexico
- 10.5.4. Rest of North America
- 10.1. Market Analysis, Insights and Forecast - by Feedstock
- 11. Competitive Analysis
- 11.1. Company Profiles
- 11.1.1 Haldor Topsoe A/S
- 11.1.1.1. Company Overview
- 11.1.1.2. Products
- 11.1.1.3. Company Financials
- 11.1.1.4. SWOT Analysis
- 11.1.2 TechnipFMC PLC*List Not Exhaustive
- 11.1.2.1. Company Overview
- 11.1.2.2. Products
- 11.1.2.3. Company Financials
- 11.1.2.4. SWOT Analysis
- 11.1.3 General Electric
- 11.1.3.1. Company Overview
- 11.1.3.2. Products
- 11.1.3.3. Company Financials
- 11.1.3.4. SWOT Analysis
- 11.1.4 Air Products and Chemicals Inc
- 11.1.4.1. Company Overview
- 11.1.4.2. Products
- 11.1.4.3. Company Financials
- 11.1.4.4. SWOT Analysis
- 11.1.5 Royal Dutch Shell plc
- 11.1.5.1. Company Overview
- 11.1.5.2. Products
- 11.1.5.3. Company Financials
- 11.1.5.4. SWOT Analysis
- 11.1.6 Siemens
- 11.1.6.1. Company Overview
- 11.1.6.2. Products
- 11.1.6.3. Company Financials
- 11.1.6.4. SWOT Analysis
- 11.1.7 KBR Inc
- 11.1.7.1. Company Overview
- 11.1.7.2. Products
- 11.1.7.3. Company Financials
- 11.1.7.4. SWOT Analysis
- 11.1.8 BASF SE
- 11.1.8.1. Company Overview
- 11.1.8.2. Products
- 11.1.8.3. Company Financials
- 11.1.8.4. SWOT Analysis
- 11.1.9 Sasol
- 11.1.9.1. Company Overview
- 11.1.9.2. Products
- 11.1.9.3. Company Financials
- 11.1.9.4. SWOT Analysis
- 11.1.10 Linde plc
- 11.1.10.1. Company Overview
- 11.1.10.2. Products
- 11.1.10.3. Company Financials
- 11.1.10.4. SWOT Analysis
- 11.1.11 SynGas Technology LLC
- 11.1.11.1. Company Overview
- 11.1.11.2. Products
- 11.1.11.3. Company Financials
- 11.1.11.4. SWOT Analysis
- 11.1.12 Air Liquide
- 11.1.12.1. Company Overview
- 11.1.12.2. Products
- 11.1.12.3. Company Financials
- 11.1.12.4. SWOT Analysis
- 11.1.13 BP p l c
- 11.1.13.1. Company Overview
- 11.1.13.2. Products
- 11.1.13.3. Company Financials
- 11.1.13.4. SWOT Analysis
- 11.1.14 Dakota Gasification Company Inc
- 11.1.14.1. Company Overview
- 11.1.14.2. Products
- 11.1.14.3. Company Financials
- 11.1.14.4. SWOT Analysis
- 11.1.1 Haldor Topsoe A/S
- 11.2. Market Entropy
- 11.2.1 Company's Key Areas Served
- 11.2.2 Recent Developments
- 11.3. Company Market Share Analysis 2025
- 11.3.1 Top 5 Companies Market Share Analysis
- 11.3.2 Top 3 Companies Market Share Analysis
- 11.4. List of Potential Customers
- 12. Research Methodology
List of Figures
- Figure 1: North America Syngas Market Revenue Breakdown (Million, %) by Product 2025 & 2033
- Figure 2: North America Syngas Market Share (%) by Company 2025
List of Tables
- Table 1: North America Syngas Market Revenue Million Forecast, by Feedstock 2020 & 2033
- Table 2: North America Syngas Market Volume K Tons Forecast, by Feedstock 2020 & 2033
- Table 3: North America Syngas Market Revenue Million Forecast, by Technology 2020 & 2033
- Table 4: North America Syngas Market Volume K Tons Forecast, by Technology 2020 & 2033
- Table 5: North America Syngas Market Revenue Million Forecast, by Gasifier Type 2020 & 2033
- Table 6: North America Syngas Market Volume K Tons Forecast, by Gasifier Type 2020 & 2033
- Table 7: North America Syngas Market Revenue Million Forecast, by Application 2020 & 2033
- Table 8: North America Syngas Market Volume K Tons Forecast, by Application 2020 & 2033
- Table 9: North America Syngas Market Revenue Million Forecast, by Geography 2020 & 2033
- Table 10: North America Syngas Market Volume K Tons Forecast, by Geography 2020 & 2033
- Table 11: North America Syngas Market Revenue Million Forecast, by Region 2020 & 2033
- Table 12: North America Syngas Market Volume K Tons Forecast, by Region 2020 & 2033
- Table 13: North America Syngas Market Revenue Million Forecast, by Feedstock 2020 & 2033
- Table 14: North America Syngas Market Volume K Tons Forecast, by Feedstock 2020 & 2033
- Table 15: North America Syngas Market Revenue Million Forecast, by Technology 2020 & 2033
- Table 16: North America Syngas Market Volume K Tons Forecast, by Technology 2020 & 2033
- Table 17: North America Syngas Market Revenue Million Forecast, by Gasifier Type 2020 & 2033
- Table 18: North America Syngas Market Volume K Tons Forecast, by Gasifier Type 2020 & 2033
- Table 19: North America Syngas Market Revenue Million Forecast, by Application 2020 & 2033
- Table 20: North America Syngas Market Volume K Tons Forecast, by Application 2020 & 2033
- Table 21: North America Syngas Market Revenue Million Forecast, by Geography 2020 & 2033
- Table 22: North America Syngas Market Volume K Tons Forecast, by Geography 2020 & 2033
- Table 23: North America Syngas Market Revenue Million Forecast, by Country 2020 & 2033
- Table 24: North America Syngas Market Volume K Tons Forecast, by Country 2020 & 2033
- Table 25: North America Syngas Market Revenue Million Forecast, by Feedstock 2020 & 2033
- Table 26: North America Syngas Market Volume K Tons Forecast, by Feedstock 2020 & 2033
- Table 27: North America Syngas Market Revenue Million Forecast, by Technology 2020 & 2033
- Table 28: North America Syngas Market Volume K Tons Forecast, by Technology 2020 & 2033
- Table 29: North America Syngas Market Revenue Million Forecast, by Gasifier Type 2020 & 2033
- Table 30: North America Syngas Market Volume K Tons Forecast, by Gasifier Type 2020 & 2033
- Table 31: North America Syngas Market Revenue Million Forecast, by Application 2020 & 2033
- Table 32: North America Syngas Market Volume K Tons Forecast, by Application 2020 & 2033
- Table 33: North America Syngas Market Revenue Million Forecast, by Geography 2020 & 2033
- Table 34: North America Syngas Market Volume K Tons Forecast, by Geography 2020 & 2033
- Table 35: North America Syngas Market Revenue Million Forecast, by Country 2020 & 2033
- Table 36: North America Syngas Market Volume K Tons Forecast, by Country 2020 & 2033
- Table 37: North America Syngas Market Revenue Million Forecast, by Feedstock 2020 & 2033
- Table 38: North America Syngas Market Volume K Tons Forecast, by Feedstock 2020 & 2033
- Table 39: North America Syngas Market Revenue Million Forecast, by Technology 2020 & 2033
- Table 40: North America Syngas Market Volume K Tons Forecast, by Technology 2020 & 2033
- Table 41: North America Syngas Market Revenue Million Forecast, by Gasifier Type 2020 & 2033
- Table 42: North America Syngas Market Volume K Tons Forecast, by Gasifier Type 2020 & 2033
- Table 43: North America Syngas Market Revenue Million Forecast, by Application 2020 & 2033
- Table 44: North America Syngas Market Volume K Tons Forecast, by Application 2020 & 2033
- Table 45: North America Syngas Market Revenue Million Forecast, by Geography 2020 & 2033
- Table 46: North America Syngas Market Volume K Tons Forecast, by Geography 2020 & 2033
- Table 47: North America Syngas Market Revenue Million Forecast, by Country 2020 & 2033
- Table 48: North America Syngas Market Volume K Tons Forecast, by Country 2020 & 2033
- Table 49: North America Syngas Market Revenue Million Forecast, by Feedstock 2020 & 2033
- Table 50: North America Syngas Market Volume K Tons Forecast, by Feedstock 2020 & 2033
- Table 51: North America Syngas Market Revenue Million Forecast, by Technology 2020 & 2033
- Table 52: North America Syngas Market Volume K Tons Forecast, by Technology 2020 & 2033
- Table 53: North America Syngas Market Revenue Million Forecast, by Gasifier Type 2020 & 2033
- Table 54: North America Syngas Market Volume K Tons Forecast, by Gasifier Type 2020 & 2033
- Table 55: North America Syngas Market Revenue Million Forecast, by Application 2020 & 2033
- Table 56: North America Syngas Market Volume K Tons Forecast, by Application 2020 & 2033
- Table 57: North America Syngas Market Revenue Million Forecast, by Geography 2020 & 2033
- Table 58: North America Syngas Market Volume K Tons Forecast, by Geography 2020 & 2033
- Table 59: North America Syngas Market Revenue Million Forecast, by Country 2020 & 2033
- Table 60: North America Syngas Market Volume K Tons Forecast, by Country 2020 & 2033
Frequently Asked Questions
1. What is the projected Compound Annual Growth Rate (CAGR) of the North America Syngas Market?
The projected CAGR is approximately > 8.00%.
2. Which companies are prominent players in the North America Syngas Market?
Key companies in the market include Haldor Topsoe A/S, TechnipFMC PLC*List Not Exhaustive, General Electric, Air Products and Chemicals Inc, Royal Dutch Shell plc, Siemens, KBR Inc, BASF SE, Sasol, Linde plc, SynGas Technology LLC, Air Liquide, BP p l c, Dakota Gasification Company Inc.
3. What are the main segments of the North America Syngas Market?
The market segments include Feedstock, Technology, Gasifier Type, Application, Geography.
4. Can you provide details about the market size?
The market size is estimated to be USD 230.05 Million as of 2022.
5. What are some drivers contributing to market growth?
; Feedstock Flexibility for Syngas Production; Growing Demand for Electricity; Growing Chemical Industry.
6. What are the notable trends driving market growth?
Increasing Usage in Power Generation Industry.
7. Are there any restraints impacting market growth?
; High Capital Investment and Funding.
8. Can you provide examples of recent developments in the market?
Investments in carbon capture and storage technologies
9. What pricing options are available for accessing the report?
Pricing options include single-user, multi-user, and enterprise licenses priced at USD 4750, USD 5250, and USD 8750 respectively.
10. Is the market size provided in terms of value or volume?
The market size is provided in terms of value, measured in Million and volume, measured in K Tons.
11. Are there any specific market keywords associated with the report?
Yes, the market keyword associated with the report is "North America Syngas Market," which aids in identifying and referencing the specific market segment covered.
12. How do I determine which pricing option suits my needs best?
The pricing options vary based on user requirements and access needs. Individual users may opt for single-user licenses, while businesses requiring broader access may choose multi-user or enterprise licenses for cost-effective access to the report.
13. Are there any additional resources or data provided in the North America Syngas Market report?
While the report offers comprehensive insights, it's advisable to review the specific contents or supplementary materials provided to ascertain if additional resources or data are available.
14. How can I stay updated on further developments or reports in the North America Syngas Market?
To stay informed about further developments, trends, and reports in the North America Syngas Market, consider subscribing to industry newsletters, following relevant companies and organizations, or regularly checking reputable industry news sources and publications.
Methodology
Step 1 - Identification of Relevant Samples Size from Population Database


Step 2 - Approaches for Defining Global Market Size (Value, Volume* & Price*)

Note*: In applicable scenarios
Step 3 - Data Sources
Primary Research
- Web Analytics
- Survey Reports
- Research Institute
- Latest Research Reports
- Opinion Leaders
Secondary Research
- Annual Reports
- White Paper
- Latest Press Release
- Industry Association
- Paid Database
- Investor Presentations

Step 4 - Data Triangulation
Involves using different sources of information in order to increase the validity of a study
These sources are likely to be stakeholders in a program - participants, other researchers, program staff, other community members, and so on.
Then we put all data in single framework & apply various statistical tools to find out the dynamic on the market.
During the analysis stage, feedback from the stakeholder groups would be compared to determine areas of agreement as well as areas of divergence