

Key Insights
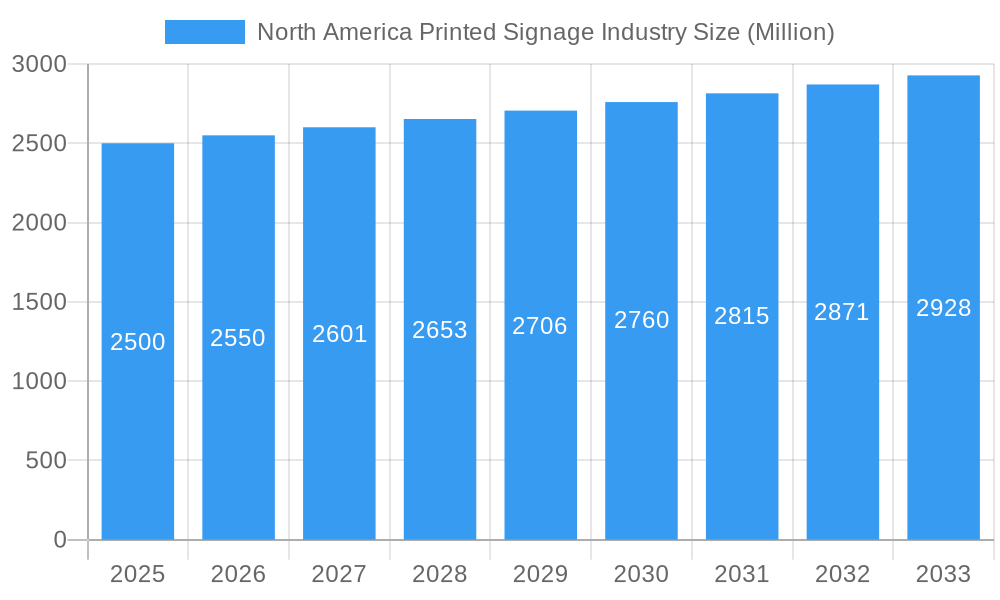
The North American printed signage industry, including billboards, backlit displays, and banners, is a mature market projected for steady expansion. The Compound Annual Growth Rate (CAGR) is estimated at approximately 2.01%. The market size in 2025 is valued at 41.86 billion. Key growth drivers include the persistent demand for impactful brand visibility in retail and hospitality, especially in high-traffic areas. Advancements in printing technology, enabling high-resolution, durable, and eco-friendly signage, also contribute to market growth. However, the market faces challenges from the increasing adoption of digital advertising and the volatility of raw material costs. Major end-user segments include retail, BFSI, and transportation & logistics, with the US and Canada representing the primary geographic markets due to higher advertising expenditure.
North America Printed Signage Industry Market Size (In Billion)
The future of the North American printed signage market will depend on industry innovation and adaptation, with a focus on sustainable materials and eco-friendly processes. Opportunities for further growth lie in niche applications like experiential and interactive signage, integrating print with digital elements. Companies excelling in specialized printing techniques, premium materials, and personalized services will be best positioned for success. Industry consolidation is anticipated as smaller entities adapt to the competitive landscape dominated by larger, diversified organizations offering integrated signage solutions.
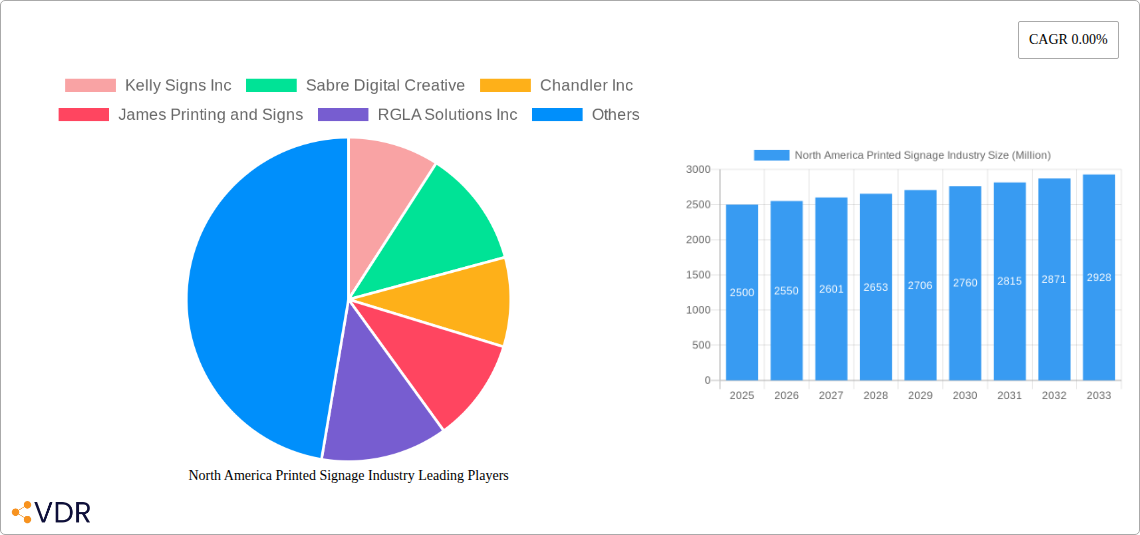
North America Printed Signage Industry Company Market Share
North America Printed Signage Industry: A Comprehensive Market Report (2019-2033)
This comprehensive report provides an in-depth analysis of the North America printed signage industry, encompassing market size, growth trends, competitive landscape, and future outlook. The report covers the period from 2019 to 2033, with 2025 serving as the base year. It segments the market by product (Billboard, Backlit Display, Pop Display, Banner, Flag, Backdrop, Corporate Graphics, Exhibition & Trade Show Material, Other Products), type (Indoor, Outdoor), end-user vertical (BFSI, Retail, Sports & Leisure, Entertainment, Transportation & Logistics, Healthcare, Others), and country (United States, Canada). The analysis incorporates data from key players including Kelly Signs Inc, Sabre Digital Creative, Chandler Inc, James Printing and Signs, RGLA Solutions Inc, Accel Group Inc, Vistaprint, AJ Printing & Graphics Inc, Avery Dennison Corporation, and Southwest Printing Co. This report is an essential resource for industry professionals, investors, and anyone seeking to understand this dynamic market.
North America Printed Signage Industry Market Dynamics & Structure
The North American printed signage market is characterized by a moderately fragmented landscape with several large players and numerous smaller regional businesses. Technological innovation, particularly in digital printing and material science, is a significant driver of growth. Regulatory frameworks concerning outdoor advertising and environmental impact play a crucial role, influencing material choices and placement regulations. The market faces competition from digital alternatives like electronic billboards and projection mapping, but printed signage retains advantages in certain applications. End-user demographics heavily influence demand, with retail and entertainment sectors driving significant volumes. M&A activity has been moderate in recent years, with xx deals recorded between 2019-2024, indicating a potential for consolidation.
- Market Concentration: Moderately fragmented, with a Herfindahl-Hirschman Index (HHI) of xx.
- Technological Innovation: Rapid advancements in digital printing, sustainable materials, and installation techniques.
- Regulatory Framework: Varied regulations across states/provinces regarding billboard placement and signage size.
- Competitive Substitutes: Growing competition from digital signage and other forms of advertising.
- M&A Trends: xx deals recorded between 2019-2024, suggesting potential for future consolidation.
- Innovation Barriers: High initial investment for advanced printing technology and skilled labor shortages.
North America Printed Signage Industry Growth Trends & Insights
The North American printed signage market experienced a Compound Annual Growth Rate (CAGR) of xx% during the historical period (2019-2024), reaching a market size of xx million units in 2024. Growth is driven by the increasing demand for brand building, promotional activities, and wayfinding solutions across various sectors. The adoption of eco-friendly materials and sustainable printing practices is gaining traction. Technological disruptions, such as the rise of large-format digital printing, have improved efficiency and expanded creative possibilities. Consumer behavior shifts towards personalized and experiential marketing are also influencing demand for innovative signage solutions. The market is projected to maintain a CAGR of xx% during the forecast period (2025-2033), reaching xx million units by 2033. Market penetration in underserved sectors remains a significant growth opportunity.
Dominant Regions, Countries, or Segments in North America Printed Signage Industry
The United States accounts for the largest share of the North American printed signage market, driven by a robust retail sector, extensive infrastructure, and a large population base. Within the United States, major metropolitan areas experience higher demand due to high foot traffic and advertising opportunities. The retail segment is the leading end-user vertical, followed by the entertainment and BFSI sectors. Within product segments, billboards, banners, and pop displays dominate market share. Indoor signage holds a larger market share compared to outdoor signage due to the prevalence of retail stores and corporate offices.
- Key Drivers (US): Robust retail sector, extensive infrastructure, large population.
- Key Drivers (Canada): Growing tourism sector, increasing investment in urban infrastructure, and government initiatives to promote economic growth.
- Dominant Segment: Retail end-user vertical, with a market share of xx% in 2024.
- Dominant Product: Billboards, capturing xx% of the market share in 2024.
- Growth Potential: Expansion in the healthcare and transportation sectors presents significant opportunities.
North America Printed Signage Industry Product Landscape
The North American printed signage market offers a wide array of products, featuring innovative materials like eco-friendly PVC, recyclable substrates, and durable inks. Advancements in digital printing technologies enable high-quality, customized solutions. Unique selling propositions include vibrant color reproduction, weather resistance, and ease of installation. Technological advancements focus on improving durability, sustainability, and ease of customization.
Key Drivers, Barriers & Challenges in North America Printed Signage Industry
Key Drivers: Growing demand for effective advertising and branding, advancements in printing technology, increasing adoption of eco-friendly materials, and government initiatives to support infrastructure development.
Key Challenges: Fluctuations in raw material costs, intense competition from substitute products, and environmental regulations impacting material choices. Supply chain disruptions caused a xx% reduction in production during 2022, highlighting the vulnerability of the industry.
Emerging Opportunities in North America Printed Signage Industry
Emerging opportunities include the adoption of interactive signage, growth in the use of AR/VR technology in signage, and expanding into niche markets like personalized signage and experiential marketing. Untapped markets include smart city initiatives and the expansion into smaller towns and cities. Evolving consumer preferences for sustainable products are driving demand for eco-friendly signage options.
Growth Accelerators in the North America Printed Signage Industry Industry
Long-term growth will be driven by technological advancements in printing and materials science, strategic partnerships between signage companies and technology providers, and expansion into new markets through innovative applications. The adoption of data analytics to optimize signage campaigns will also play a significant role in growth acceleration.
Key Players Shaping the North America Printed Signage Industry Market
- Kelly Signs Inc
- Sabre Digital Creative
- Chandler Inc
- James Printing and Signs
- RGLA Solutions Inc
- Accel Group Inc
- Vistaprint
- AJ Printing & Graphics Inc
- Avery Dennison Corporation
- Southwest Printing Co
Notable Milestones in North America Printed Signage Industry Sector
- 2020: Increased adoption of digital printing technologies due to the pandemic.
- 2021: Introduction of several eco-friendly signage materials by major manufacturers.
- 2022: Supply chain disruptions impacting production and pricing.
- 2023: Several mergers and acquisitions reshaping the competitive landscape.
In-Depth North America Printed Signage Industry Market Outlook
The future of the North American printed signage market is bright, with continued growth fueled by technological advancements, the increasing adoption of sustainable practices, and the expansion into new markets. Strategic partnerships and innovative applications will be key to success. The market is expected to witness strong growth, driven by ongoing demand for effective marketing and brand building in a world increasingly focused on experiential marketing.
North America Printed Signage Industry Segmentation
-
1. Product
- 1.1. Billboard
- 1.2. Backlit Display
- 1.3. Pop Display
- 1.4. Banner, Flag, and Backdrop
- 1.5. Corporat
- 1.6. Other Products
-
2. Type
- 2.1. Indoor Printed Signage
- 2.2. Outdoor Printed Signage
-
3. End-user Vertical
- 3.1. BFSI
- 3.2. Retail
- 3.3. Sports and Leisure
- 3.4. Entertainment
- 3.5. Transportation and Logistics
- 3.6. Healthcare
- 3.7. Other End-user Verticals
North America Printed Signage Industry Segmentation By Geography
-
1. North America
- 1.1. United States
- 1.2. Canada
- 1.3. Mexico
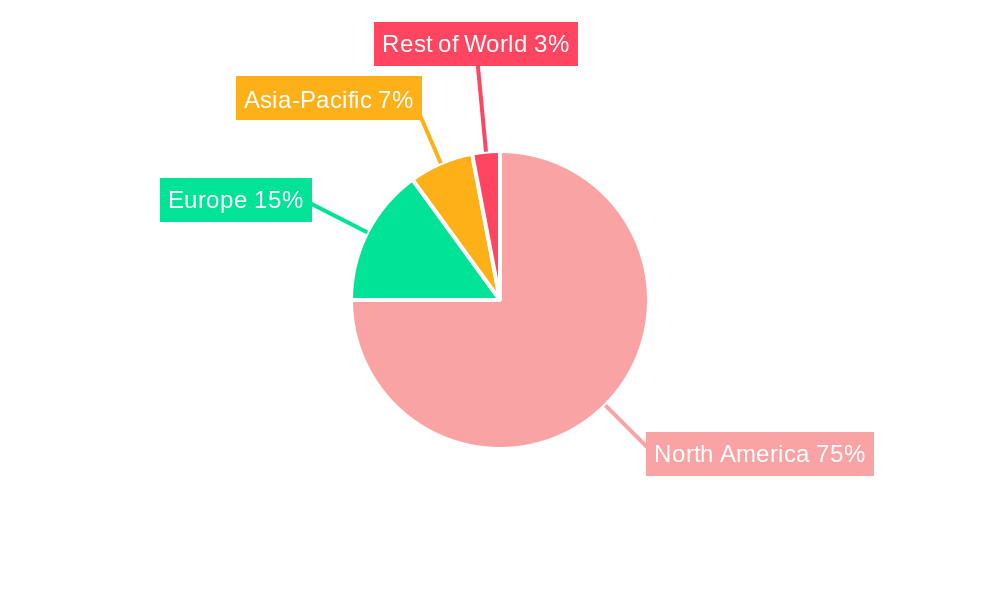
North America Printed Signage Industry Regional Market Share
Geographic Coverage of North America Printed Signage Industry
North America Printed Signage Industry REPORT HIGHLIGHTS
| Aspects | Details |
|---|---|
| Study Period | 2020-2034 |
| Base Year | 2025 |
| Estimated Year | 2026 |
| Forecast Period | 2026-2034 |
| Historical Period | 2020-2025 |
| Growth Rate | CAGR of 2.01% from 2020-2034 |
| Segmentation |
|
Table of Contents
- 1. Introduction
- 1.1. Research Scope
- 1.2. Market Segmentation
- 1.3. Research Objective
- 1.4. Definitions and Assumptions
- 2. Executive Summary
- 2.1. Market Snapshot
- 3. Market Dynamics
- 3.1. Market Drivers
- 3.2. Market Restrains
- 3.3. Market Trends
- 3.4. Market Opportunities
- 4. Market Factor Analysis
- 4.1. Porters Five Forces
- 4.1.1. Bargaining Power of Suppliers
- 4.1.2. Bargaining Power of Buyers
- 4.1.3. Threat of New Entrants
- 4.1.4. Threat of Substitutes
- 4.1.5. Competitive Rivalry
- 4.2. PESTEL analysis
- 4.3. BCG Analysis
- 4.3.1. Stars (High Growth, High Market Share)
- 4.3.2. Cash Cows (Low Growth, High Market Share)
- 4.3.3. Question Mark (High Growth, Low Market Share)
- 4.3.4. Dogs (Low Growth, Low Market Share)
- 4.4. Ansoff Matrix Analysis
- 4.5. Supply Chain Analysis
- 4.6. Regulatory Landscape
- 4.7. Current Market Potential and Opportunity Assessment (TAM–SAM–SOM Framework)
- 4.8. VDR Analyst Note
- 4.1. Porters Five Forces
- 5. Market Analysis, Insights and Forecast 2021-2033
- 5.1. Market Analysis, Insights and Forecast - by Product
- 5.1.1. Billboard
- 5.1.2. Backlit Display
- 5.1.3. Pop Display
- 5.1.4. Banner, Flag, and Backdrop
- 5.1.5. Corporat
- 5.1.6. Other Products
- 5.2. Market Analysis, Insights and Forecast - by Type
- 5.2.1. Indoor Printed Signage
- 5.2.2. Outdoor Printed Signage
- 5.3. Market Analysis, Insights and Forecast - by End-user Vertical
- 5.3.1. BFSI
- 5.3.2. Retail
- 5.3.3. Sports and Leisure
- 5.3.4. Entertainment
- 5.3.5. Transportation and Logistics
- 5.3.6. Healthcare
- 5.3.7. Other End-user Verticals
- 5.4. Market Analysis, Insights and Forecast - by Region
- 5.4.1. North America
- 5.1. Market Analysis, Insights and Forecast - by Product
- 6. North America Printed Signage Industry Analysis, Insights and Forecast, 2021-2033
- 6.1. Market Analysis, Insights and Forecast - by Product
- 6.1.1. Billboard
- 6.1.2. Backlit Display
- 6.1.3. Pop Display
- 6.1.4. Banner, Flag, and Backdrop
- 6.1.5. Corporat
- 6.1.6. Other Products
- 6.2. Market Analysis, Insights and Forecast - by Type
- 6.2.1. Indoor Printed Signage
- 6.2.2. Outdoor Printed Signage
- 6.3. Market Analysis, Insights and Forecast - by End-user Vertical
- 6.3.1. BFSI
- 6.3.2. Retail
- 6.3.3. Sports and Leisure
- 6.3.4. Entertainment
- 6.3.5. Transportation and Logistics
- 6.3.6. Healthcare
- 6.3.7. Other End-user Verticals
- 6.1. Market Analysis, Insights and Forecast - by Product
- 7. Competitive Analysis
- 7.1. Company Profiles
- 7.1.1 Kelly Signs Inc
- 7.1.1.1. Company Overview
- 7.1.1.2. Products
- 7.1.1.3. Company Financials
- 7.1.1.4. SWOT Analysis
- 7.1.2 Sabre Digital Creative
- 7.1.2.1. Company Overview
- 7.1.2.2. Products
- 7.1.2.3. Company Financials
- 7.1.2.4. SWOT Analysis
- 7.1.3 Chandler Inc
- 7.1.3.1. Company Overview
- 7.1.3.2. Products
- 7.1.3.3. Company Financials
- 7.1.3.4. SWOT Analysis
- 7.1.4 James Printing and Signs
- 7.1.4.1. Company Overview
- 7.1.4.2. Products
- 7.1.4.3. Company Financials
- 7.1.4.4. SWOT Analysis
- 7.1.5 RGLA Solutions Inc
- 7.1.5.1. Company Overview
- 7.1.5.2. Products
- 7.1.5.3. Company Financials
- 7.1.5.4. SWOT Analysis
- 7.1.6 Accel Group Inc
- 7.1.6.1. Company Overview
- 7.1.6.2. Products
- 7.1.6.3. Company Financials
- 7.1.6.4. SWOT Analysis
- 7.1.7 Vistaprint*List Not Exhaustive
- 7.1.7.1. Company Overview
- 7.1.7.2. Products
- 7.1.7.3. Company Financials
- 7.1.7.4. SWOT Analysis
- 7.1.8 AJ Printing & Graphics Inc
- 7.1.8.1. Company Overview
- 7.1.8.2. Products
- 7.1.8.3. Company Financials
- 7.1.8.4. SWOT Analysis
- 7.1.9 Avery Dennison Corporation
- 7.1.9.1. Company Overview
- 7.1.9.2. Products
- 7.1.9.3. Company Financials
- 7.1.9.4. SWOT Analysis
- 7.1.10 Southwest Printing Co
- 7.1.10.1. Company Overview
- 7.1.10.2. Products
- 7.1.10.3. Company Financials
- 7.1.10.4. SWOT Analysis
- 7.1.1 Kelly Signs Inc
- 7.2. Market Entropy
- 7.2.1 Company's Key Areas Served
- 7.2.2 Recent Developments
- 7.3. Company Market Share Analysis 2025
- 7.3.1 Top 5 Companies Market Share Analysis
- 7.3.2 Top 3 Companies Market Share Analysis
- 7.4. List of Potential Customers
- 8. Research Methodology
List of Figures
- Figure 1: North America Printed Signage Industry Revenue Breakdown (billion, %) by Product 2025 & 2033
- Figure 2: North America Printed Signage Industry Share (%) by Company 2025
List of Tables
- Table 1: North America Printed Signage Industry Revenue billion Forecast, by Product 2020 & 2033
- Table 2: North America Printed Signage Industry Revenue billion Forecast, by Type 2020 & 2033
- Table 3: North America Printed Signage Industry Revenue billion Forecast, by End-user Vertical 2020 & 2033
- Table 4: North America Printed Signage Industry Revenue billion Forecast, by Region 2020 & 2033
- Table 5: North America Printed Signage Industry Revenue billion Forecast, by Product 2020 & 2033
- Table 6: North America Printed Signage Industry Revenue billion Forecast, by Type 2020 & 2033
- Table 7: North America Printed Signage Industry Revenue billion Forecast, by End-user Vertical 2020 & 2033
- Table 8: North America Printed Signage Industry Revenue billion Forecast, by Country 2020 & 2033
- Table 9: United States North America Printed Signage Industry Revenue (billion) Forecast, by Application 2020 & 2033
- Table 10: Canada North America Printed Signage Industry Revenue (billion) Forecast, by Application 2020 & 2033
- Table 11: Mexico North America Printed Signage Industry Revenue (billion) Forecast, by Application 2020 & 2033
Frequently Asked Questions
1. What is the projected Compound Annual Growth Rate (CAGR) of the North America Printed Signage Industry?
The projected CAGR is approximately 2.01%.
2. Which companies are prominent players in the North America Printed Signage Industry?
Key companies in the market include Kelly Signs Inc, Sabre Digital Creative, Chandler Inc, James Printing and Signs, RGLA Solutions Inc, Accel Group Inc, Vistaprint*List Not Exhaustive, AJ Printing & Graphics Inc, Avery Dennison Corporation, Southwest Printing Co.
3. What are the main segments of the North America Printed Signage Industry?
The market segments include Product, Type, End-user Vertical.
4. Can you provide details about the market size?
The market size is estimated to be USD 41.86 billion as of 2022.
5. What are some drivers contributing to market growth?
; Cost Effectiveness of Printed Signage.
6. What are the notable trends driving market growth?
Corporate Graphics. Exhibition. and Trade Show Material to Witness Downfall.
7. Are there any restraints impacting market growth?
; Advent of Digital Signage; Drawbacks of Screen Printing.
8. Can you provide examples of recent developments in the market?
N/A
9. What pricing options are available for accessing the report?
Pricing options include single-user, multi-user, and enterprise licenses priced at USD 4750, USD 4950, and USD 6800 respectively.
10. Is the market size provided in terms of value or volume?
The market size is provided in terms of value, measured in billion.
11. Are there any specific market keywords associated with the report?
Yes, the market keyword associated with the report is "North America Printed Signage Industry," which aids in identifying and referencing the specific market segment covered.
12. How do I determine which pricing option suits my needs best?
The pricing options vary based on user requirements and access needs. Individual users may opt for single-user licenses, while businesses requiring broader access may choose multi-user or enterprise licenses for cost-effective access to the report.
13. Are there any additional resources or data provided in the North America Printed Signage Industry report?
While the report offers comprehensive insights, it's advisable to review the specific contents or supplementary materials provided to ascertain if additional resources or data are available.
14. How can I stay updated on further developments or reports in the North America Printed Signage Industry?
To stay informed about further developments, trends, and reports in the North America Printed Signage Industry, consider subscribing to industry newsletters, following relevant companies and organizations, or regularly checking reputable industry news sources and publications.
Methodology
Step 1 - Identification of Relevant Samples Size from Population Database


Step 2 - Approaches for Defining Global Market Size (Value, Volume* & Price*)

Note*: In applicable scenarios
Step 3 - Data Sources
Primary Research
- Web Analytics
- Survey Reports
- Research Institute
- Latest Research Reports
- Opinion Leaders
Secondary Research
- Annual Reports
- White Paper
- Latest Press Release
- Industry Association
- Paid Database
- Investor Presentations

Step 4 - Data Triangulation
Involves using different sources of information in order to increase the validity of a study
These sources are likely to be stakeholders in a program - participants, other researchers, program staff, other community members, and so on.
Then we put all data in single framework & apply various statistical tools to find out the dynamic on the market.
During the analysis stage, feedback from the stakeholder groups would be compared to determine areas of agreement as well as areas of divergence