

Key Insights
The North American omega-3 products market, spanning functional foods, dietary supplements, infant nutrition, pet food, and pharmaceuticals, is poised for significant expansion. Driven by heightened consumer awareness of omega-3 fatty acids' health advantages for cardiovascular, cognitive, and anti-inflammatory health, the market is projected to reach $2.5 billion by 2024, with a Compound Annual Growth Rate (CAGR) of 5.9%. Factors contributing to this growth include the rising incidence of chronic diseases, increasing disposable incomes, and the pervasive health and wellness trend. Key distribution channels encompass grocery retailers, pharmacies, health stores, and a growing e-commerce presence. Major industry players are strategically focusing on product innovation, brand development, and targeted marketing to capitalize on this dynamic market. Dietary supplements and functional foods represent substantial market segments due to their convenience and accessibility.
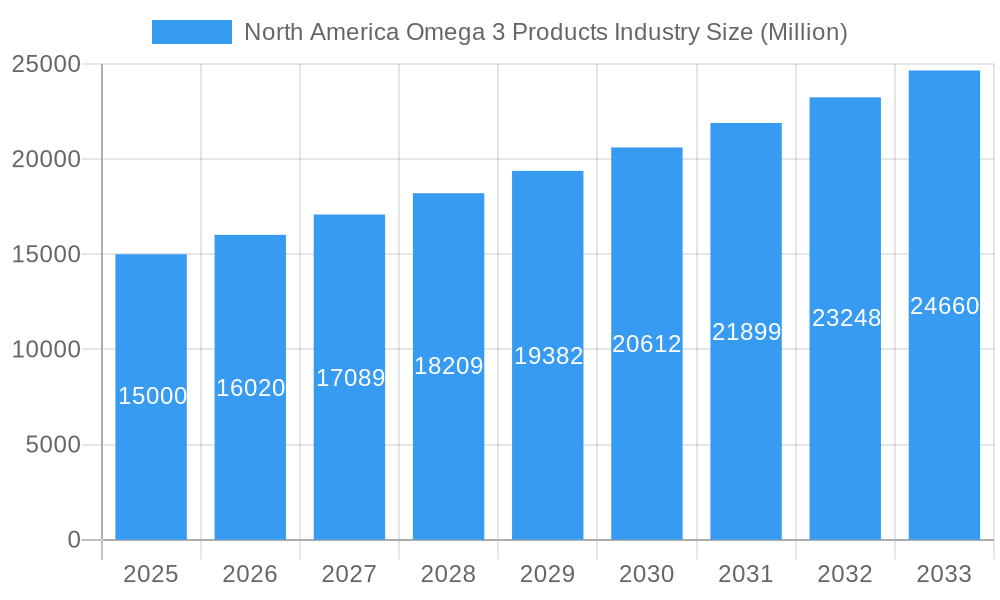
North America Omega 3 Products Industry Market Size (In Billion)
The dietary supplement sector is anticipated to lead growth, offering convenient and precise omega-3 dosages. Infant nutrition also shows strong potential, acknowledging the vital role of omega-3s in early development. Despite challenges like raw material price volatility and regulatory hurdles, the North American omega-3 market demonstrates a positive outlook for substantial growth between 2024 and 2033. The integration of omega-3s into pet food and feed offers an emerging opportunity, aligning with the increasing consumer emphasis on pet health and well-being.
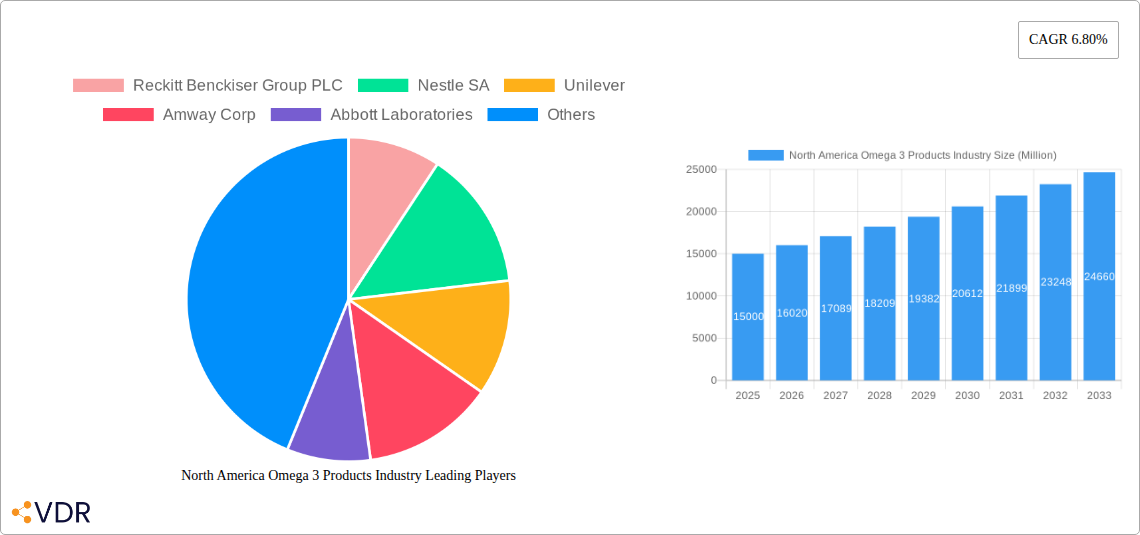
North America Omega 3 Products Industry Company Market Share
North America Omega-3 Products Industry Market Report: 2019-2033
This comprehensive report provides a detailed analysis of the North America Omega-3 Products industry, encompassing market dynamics, growth trends, competitive landscape, and future outlook. With a study period spanning 2019-2033, a base year of 2025, and a forecast period of 2025-2033, this report is an invaluable resource for industry professionals, investors, and strategic decision-makers. The report leverages rigorous data analysis to provide actionable insights into this rapidly evolving market, segmented by product type (Functional Food, Dietary Supplements, Infant Nutrition, Pet Food and Feed, Pharmaceuticals) and distribution channel (Grocery Retailers, Pharmacies and Health Stores, Internet Retailing, Other Distribution Channels). Market values are presented in million units.
North America Omega-3 Products Industry Market Dynamics & Structure
The North American Omega-3 products market is characterized by moderate concentration, with key players such as Reckitt Benckiser Group PLC, Nestle SA, Unilever, Amway Corp, Abbott Laboratories, Herbalife Nutrition, Nutrigold Inc., and GNC holding significant market share. The market is driven by increasing consumer awareness of the health benefits of Omega-3 fatty acids, technological advancements in extraction and formulation, and supportive regulatory frameworks. However, challenges include price volatility of raw materials, competition from substitutes (e.g., plant-based Omega-3 sources), and stringent regulatory compliance requirements. The market has witnessed significant M&A activity in recent years, with xx deals recorded between 2019 and 2024, reflecting consolidation trends within the industry.
- Market Concentration: Moderately concentrated, with top 8 players holding approximately xx% market share in 2024.
- Technological Innovation: Focus on sustainable sourcing, improved extraction techniques, and innovative delivery systems (e.g., microencapsulation).
- Regulatory Landscape: Stringent regulations regarding labeling, purity, and safety standards.
- Competitive Substitutes: Plant-based Omega-3 sources (e.g., flaxseed oil, chia seeds) pose a competitive threat.
- End-User Demographics: Growing demand from health-conscious consumers, particularly millennials and Gen Z.
- M&A Activity: xx deals completed between 2019 and 2024, indicating industry consolidation.
North America Omega-3 Products Industry Growth Trends & Insights
The North America Omega-3 products market experienced robust growth during the historical period (2019-2024), with a CAGR of xx%. This growth is attributed to increasing prevalence of chronic diseases, rising disposable incomes, and growing awareness of the preventative health benefits of Omega-3s. The market size reached xx million units in 2024 and is projected to reach xx million units by 2033, exhibiting a CAGR of xx% during the forecast period (2025-2033). Technological advancements, such as improved extraction methods and the development of more stable and bioavailable Omega-3 formulations, are driving market expansion. Shifting consumer preferences toward healthier lifestyles and increased adoption of online retail channels are also contributing to market growth. Market penetration in key segments like dietary supplements remains relatively high, while opportunities for growth exist in functional foods and infant nutrition.
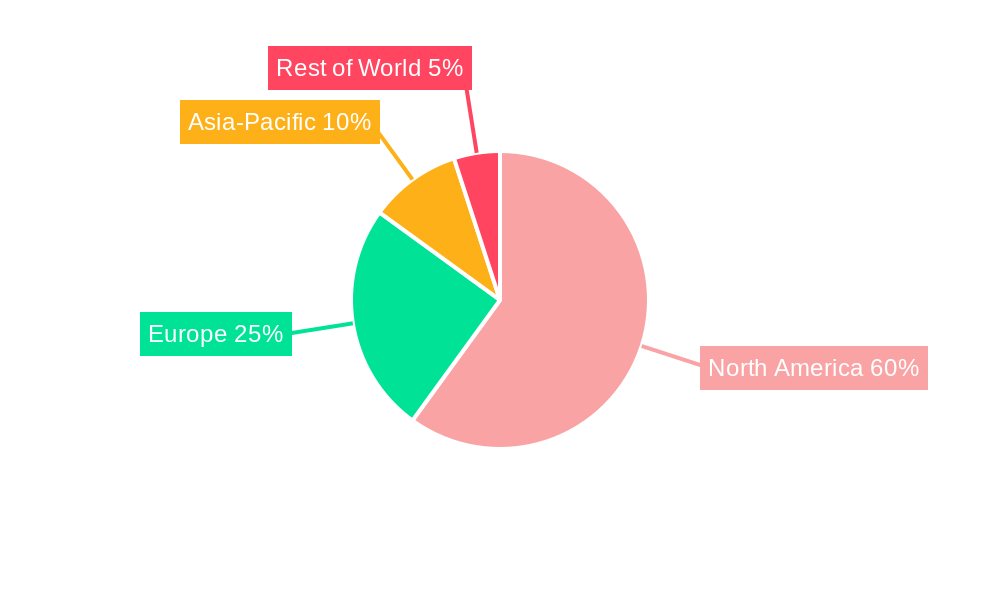
Dominant Regions, Countries, or Segments in North America Omega-3 Products Industry
The United States dominates the North American Omega-3 products market, accounting for approximately xx% of the total market value in 2024. This dominance is attributed to high consumer awareness, strong regulatory frameworks, and a well-established distribution network. Within product types, Dietary Supplements represent the largest segment, followed by Functional Foods. The growth of internet retailing has significantly contributed to market expansion across all segments.
- Key Growth Drivers:
- High consumer health awareness in the US.
- Strong presence of major players in the US market.
- Well-developed distribution channels.
- Dominant Segments: Dietary Supplements and the US Market.
- Growth Potential: Significant potential for growth in the infant nutrition and pet food and feed segments.
North America Omega-3 Products Industry Product Landscape
The Omega-3 product landscape is diverse, encompassing various forms like capsules, liquids, gummies, and functional foods integrated with Omega-3s. Recent innovations include sustained-release formulations, enhanced bioavailability technologies, and products targeting specific health needs. Unique selling propositions focus on purity, sourcing, sustainability, and added functionalities like enhanced absorption and reduced fishy burps.
Key Drivers, Barriers & Challenges in North America Omega-3 Products Industry
Key Drivers:
- Growing consumer awareness of health benefits.
- Increasing prevalence of chronic diseases.
- Technological advancements in production and formulation.
- Expanding distribution channels.
Key Barriers & Challenges:
- Price volatility of raw materials, especially fish oil.
- Stringent regulatory requirements.
- Competition from plant-based alternatives and other supplements.
- Concerns about sustainability and ethical sourcing.
Emerging Opportunities in North America Omega-3 Products Industry
- Expanding into untapped markets like plant-based Omega-3 products.
- Developing innovative product formulations tailored to specific consumer needs (e.g., vegetarian/vegan, allergy-friendly).
- Leveraging personalized nutrition and precision medicine approaches.
Growth Accelerators in the North America Omega 3 Products Industry Industry
Technological advancements, strategic partnerships, and expansion into new markets are key growth accelerators. Developing innovative delivery systems that enhance bioavailability and masking of unpleasant taste will further drive market growth. Strengthening relationships with healthcare professionals and integrating personalized health recommendations can also significantly boost market expansion.
Key Players Shaping the North America Omega-3 Products Market
- Reckitt Benckiser Group PLC
- Nestle SA
- Unilever
- Amway Corp
- Abbott Laboratories
- Herbalife Nutrition
- Nutrigold Inc.
- GNC
Notable Milestones in North America Omega-3 Products Industry Sector
- 2020: Increased regulatory scrutiny on Omega-3 supplement labeling and purity.
- 2022: Launch of several novel Omega-3 delivery systems with improved bioavailability.
- 2023: Several major players invested heavily in sustainable sourcing initiatives.
In-Depth North America Omega-3 Products Industry Market Outlook
The North American Omega-3 products market is poised for continued growth, driven by increasing consumer demand, technological innovation, and expanding distribution channels. Strategic opportunities exist in developing personalized products, focusing on sustainability, and tapping into emerging markets, ensuring continued market dominance. The long-term outlook for the industry remains positive, with significant growth potential across various segments and geographies.
North America Omega 3 Products Industry Segmentation
-
1. Product Type
- 1.1. Functional Food
- 1.2. Dietary Supplements
- 1.3. Infant Nutrition
- 1.4. Pet Food and Feed
- 1.5. Pharmaceuticals
-
2. Distribution Channel
- 2.1. Grocery Retailers
- 2.2. Pharmacies and Health Stores
- 2.3. Internet Retailing
- 2.4. Other Distribution Channels
-
3. Geography
-
3.1. North America
- 3.1.1. United States
- 3.1.2. Canada
- 3.1.3. Mexico
- 3.1.4. Rest of North America
-
3.1. North America
North America Omega 3 Products Industry Segmentation By Geography
-
1. North America
- 1.1. United States
- 1.2. Canada
- 1.3. Mexico
- 1.4. Rest of North America
North America Omega 3 Products Industry Regional Market Share
Geographic Coverage of North America Omega 3 Products Industry
North America Omega 3 Products Industry REPORT HIGHLIGHTS
| Aspects | Details |
|---|---|
| Study Period | 2020-2034 |
| Base Year | 2025 |
| Estimated Year | 2026 |
| Forecast Period | 2026-2034 |
| Historical Period | 2020-2025 |
| Growth Rate | CAGR of 5.9% from 2020-2034 |
| Segmentation |
|
Table of Contents
- 1. Introduction
- 1.1. Research Scope
- 1.2. Market Segmentation
- 1.3. Research Objective
- 1.4. Definitions and Assumptions
- 2. Executive Summary
- 2.1. Market Snapshot
- 3. Market Dynamics
- 3.1. Market Drivers
- 3.2. Market Restrains
- 3.3. Market Trends
- 3.4. Market Opportunities
- 4. Market Factor Analysis
- 4.1. Porters Five Forces
- 4.1.1. Bargaining Power of Suppliers
- 4.1.2. Bargaining Power of Buyers
- 4.1.3. Threat of New Entrants
- 4.1.4. Threat of Substitutes
- 4.1.5. Competitive Rivalry
- 4.2. PESTEL analysis
- 4.3. BCG Analysis
- 4.3.1. Stars (High Growth, High Market Share)
- 4.3.2. Cash Cows (Low Growth, High Market Share)
- 4.3.3. Question Mark (High Growth, Low Market Share)
- 4.3.4. Dogs (Low Growth, Low Market Share)
- 4.4. Ansoff Matrix Analysis
- 4.5. Supply Chain Analysis
- 4.6. Regulatory Landscape
- 4.7. Current Market Potential and Opportunity Assessment (TAM–SAM–SOM Framework)
- 4.8. VDR Analyst Note
- 4.1. Porters Five Forces
- 5. Market Analysis, Insights and Forecast 2021-2033
- 5.1. Market Analysis, Insights and Forecast - by Product Type
- 5.1.1. Functional Food
- 5.1.2. Dietary Supplements
- 5.1.3. Infant Nutrition
- 5.1.4. Pet Food and Feed
- 5.1.5. Pharmaceuticals
- 5.2. Market Analysis, Insights and Forecast - by Distribution Channel
- 5.2.1. Grocery Retailers
- 5.2.2. Pharmacies and Health Stores
- 5.2.3. Internet Retailing
- 5.2.4. Other Distribution Channels
- 5.3. Market Analysis, Insights and Forecast - by Geography
- 5.3.1. North America
- 5.3.1.1. United States
- 5.3.1.2. Canada
- 5.3.1.3. Mexico
- 5.3.1.4. Rest of North America
- 5.3.1. North America
- 5.4. Market Analysis, Insights and Forecast - by Region
- 5.4.1. North America
- 5.1. Market Analysis, Insights and Forecast - by Product Type
- 6. North America Omega 3 Products Industry Analysis, Insights and Forecast, 2021-2033
- 6.1. Market Analysis, Insights and Forecast - by Product Type
- 6.1.1. Functional Food
- 6.1.2. Dietary Supplements
- 6.1.3. Infant Nutrition
- 6.1.4. Pet Food and Feed
- 6.1.5. Pharmaceuticals
- 6.2. Market Analysis, Insights and Forecast - by Distribution Channel
- 6.2.1. Grocery Retailers
- 6.2.2. Pharmacies and Health Stores
- 6.2.3. Internet Retailing
- 6.2.4. Other Distribution Channels
- 6.3. Market Analysis, Insights and Forecast - by Geography
- 6.3.1. North America
- 6.3.1.1. United States
- 6.3.1.2. Canada
- 6.3.1.3. Mexico
- 6.3.1.4. Rest of North America
- 6.3.1. North America
- 6.1. Market Analysis, Insights and Forecast - by Product Type
- 7. Competitive Analysis
- 7.1. Company Profiles
- 7.1.1 Reckitt Benckiser Group PLC
- 7.1.1.1. Company Overview
- 7.1.1.2. Products
- 7.1.1.3. Company Financials
- 7.1.1.4. SWOT Analysis
- 7.1.2 Nestle SA
- 7.1.2.1. Company Overview
- 7.1.2.2. Products
- 7.1.2.3. Company Financials
- 7.1.2.4. SWOT Analysis
- 7.1.3 Unilever
- 7.1.3.1. Company Overview
- 7.1.3.2. Products
- 7.1.3.3. Company Financials
- 7.1.3.4. SWOT Analysis
- 7.1.4 Amway Corp
- 7.1.4.1. Company Overview
- 7.1.4.2. Products
- 7.1.4.3. Company Financials
- 7.1.4.4. SWOT Analysis
- 7.1.5 Abbott Laboratories
- 7.1.5.1. Company Overview
- 7.1.5.2. Products
- 7.1.5.3. Company Financials
- 7.1.5.4. SWOT Analysis
- 7.1.6 Herbalife Nutrition
- 7.1.6.1. Company Overview
- 7.1.6.2. Products
- 7.1.6.3. Company Financials
- 7.1.6.4. SWOT Analysis
- 7.1.7 Nutrigold Inc.
- 7.1.7.1. Company Overview
- 7.1.7.2. Products
- 7.1.7.3. Company Financials
- 7.1.7.4. SWOT Analysis
- 7.1.8 GNC
- 7.1.8.1. Company Overview
- 7.1.8.2. Products
- 7.1.8.3. Company Financials
- 7.1.8.4. SWOT Analysis
- 7.1.1 Reckitt Benckiser Group PLC
- 7.2. Market Entropy
- 7.2.1 Company's Key Areas Served
- 7.2.2 Recent Developments
- 7.3. Company Market Share Analysis 2025
- 7.3.1 Top 5 Companies Market Share Analysis
- 7.3.2 Top 3 Companies Market Share Analysis
- 7.4. List of Potential Customers
- 8. Research Methodology
List of Figures
- Figure 1: North America Omega 3 Products Industry Revenue Breakdown (billion, %) by Product 2025 & 2033
- Figure 2: North America Omega 3 Products Industry Share (%) by Company 2025
List of Tables
- Table 1: North America Omega 3 Products Industry Revenue billion Forecast, by Product Type 2020 & 2033
- Table 2: North America Omega 3 Products Industry Revenue billion Forecast, by Distribution Channel 2020 & 2033
- Table 3: North America Omega 3 Products Industry Revenue billion Forecast, by Geography 2020 & 2033
- Table 4: North America Omega 3 Products Industry Revenue billion Forecast, by Region 2020 & 2033
- Table 5: North America Omega 3 Products Industry Revenue billion Forecast, by Product Type 2020 & 2033
- Table 6: North America Omega 3 Products Industry Revenue billion Forecast, by Distribution Channel 2020 & 2033
- Table 7: North America Omega 3 Products Industry Revenue billion Forecast, by Geography 2020 & 2033
- Table 8: North America Omega 3 Products Industry Revenue billion Forecast, by Country 2020 & 2033
- Table 9: United States North America Omega 3 Products Industry Revenue (billion) Forecast, by Application 2020 & 2033
- Table 10: Canada North America Omega 3 Products Industry Revenue (billion) Forecast, by Application 2020 & 2033
- Table 11: Mexico North America Omega 3 Products Industry Revenue (billion) Forecast, by Application 2020 & 2033
- Table 12: Rest of North America North America Omega 3 Products Industry Revenue (billion) Forecast, by Application 2020 & 2033
Frequently Asked Questions
1. What is the projected Compound Annual Growth Rate (CAGR) of the North America Omega 3 Products Industry?
The projected CAGR is approximately 5.9%.
2. Which companies are prominent players in the North America Omega 3 Products Industry?
Key companies in the market include Reckitt Benckiser Group PLC, Nestle SA, Unilever, Amway Corp, Abbott Laboratories, Herbalife Nutrition, Nutrigold Inc., GNC.
3. What are the main segments of the North America Omega 3 Products Industry?
The market segments include Product Type, Distribution Channel, Geography.
4. Can you provide details about the market size?
The market size is estimated to be USD 2.5 billion as of 2022.
5. What are some drivers contributing to market growth?
Increasing awareness of the health benefits of Omega-3 fatty acids; Rising Prevalence of Chronic Diseases.
6. What are the notable trends driving market growth?
Growing interest in plant-based diets and veganism is driving demand for plant-derived Omega-3 sources.
7. Are there any restraints impacting market growth?
Omega-3 supplements can be expensive compared to other nutritional products.
8. Can you provide examples of recent developments in the market?
N/A
9. What pricing options are available for accessing the report?
Pricing options include single-user, multi-user, and enterprise licenses priced at USD 4750, USD 5250, and USD 8750 respectively.
10. Is the market size provided in terms of value or volume?
The market size is provided in terms of value, measured in billion.
11. Are there any specific market keywords associated with the report?
Yes, the market keyword associated with the report is "North America Omega 3 Products Industry," which aids in identifying and referencing the specific market segment covered.
12. How do I determine which pricing option suits my needs best?
The pricing options vary based on user requirements and access needs. Individual users may opt for single-user licenses, while businesses requiring broader access may choose multi-user or enterprise licenses for cost-effective access to the report.
13. Are there any additional resources or data provided in the North America Omega 3 Products Industry report?
While the report offers comprehensive insights, it's advisable to review the specific contents or supplementary materials provided to ascertain if additional resources or data are available.
14. How can I stay updated on further developments or reports in the North America Omega 3 Products Industry?
To stay informed about further developments, trends, and reports in the North America Omega 3 Products Industry, consider subscribing to industry newsletters, following relevant companies and organizations, or regularly checking reputable industry news sources and publications.
Methodology
Step 1 - Identification of Relevant Samples Size from Population Database


Step 2 - Approaches for Defining Global Market Size (Value, Volume* & Price*)

Note*: In applicable scenarios
Step 3 - Data Sources
Primary Research
- Web Analytics
- Survey Reports
- Research Institute
- Latest Research Reports
- Opinion Leaders
Secondary Research
- Annual Reports
- White Paper
- Latest Press Release
- Industry Association
- Paid Database
- Investor Presentations

Step 4 - Data Triangulation
Involves using different sources of information in order to increase the validity of a study
These sources are likely to be stakeholders in a program - participants, other researchers, program staff, other community members, and so on.
Then we put all data in single framework & apply various statistical tools to find out the dynamic on the market.
During the analysis stage, feedback from the stakeholder groups would be compared to determine areas of agreement as well as areas of divergence