

Key Insights
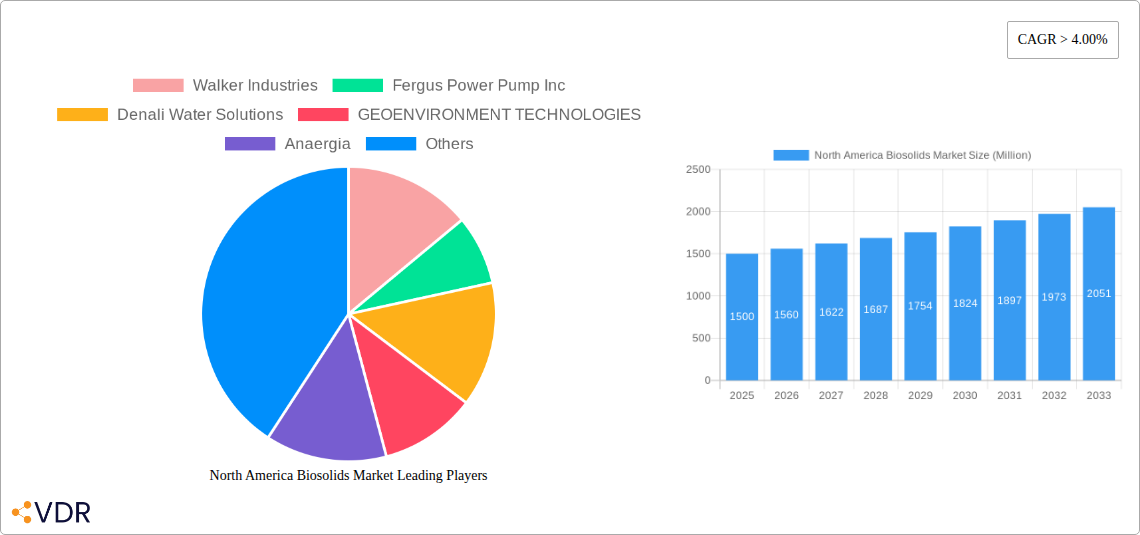
The North American biosolids market, projected to reach $3.84 billion by 2024, is exhibiting significant expansion. This market is anticipated to grow at a Compound Annual Growth Rate (CAGR) of 4.5% from 2024 to 2033. Key growth drivers include heightened awareness of sustainable waste management, stringent wastewater treatment regulations, and the increasing demand for biosolids as agricultural fertilizers and for land reclamation. The market is segmented by biosolids type (Class A, Class A EQ, Class B), form (cakes, liquid, pellets), and application (agriculture, reclamation, landscaping, energy production). Agriculture remains the dominant application, driven by the need for cost-effective, sustainable fertilizers. Energy production is emerging as a substantial growth avenue, reflecting rising interest in renewable energy. Leading companies, including Walker Industries and Fergus Power Pump Inc., are instrumental in market expansion through innovation and strategic alliances. Potential challenges involve commodity price volatility, regulatory complexities, and public perception. Nevertheless, advancements in processing technologies and supportive government incentives are poised to overcome these restraints and foster continued market growth.
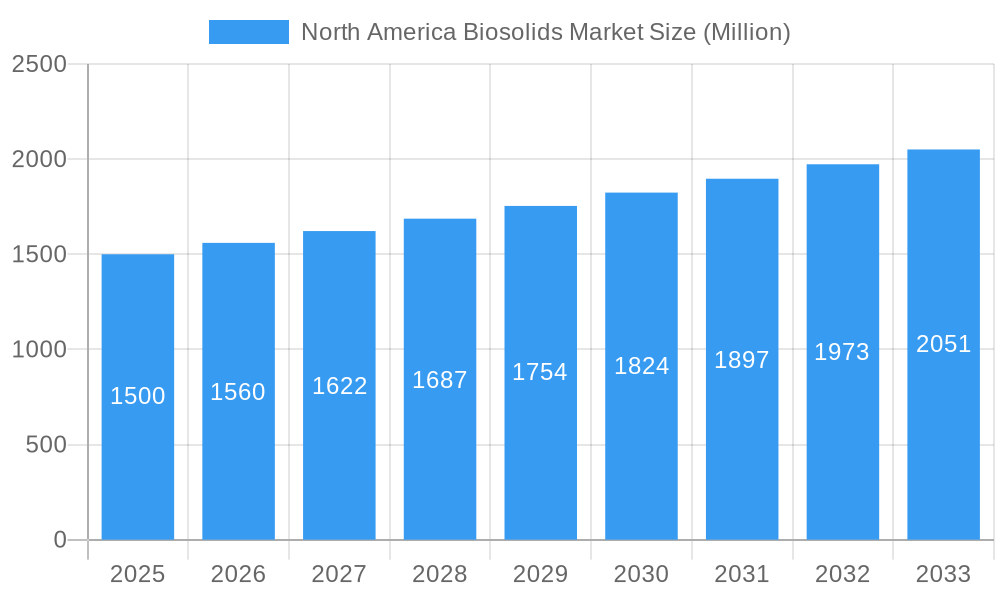
North America Biosolids Market Market Size (In Billion)
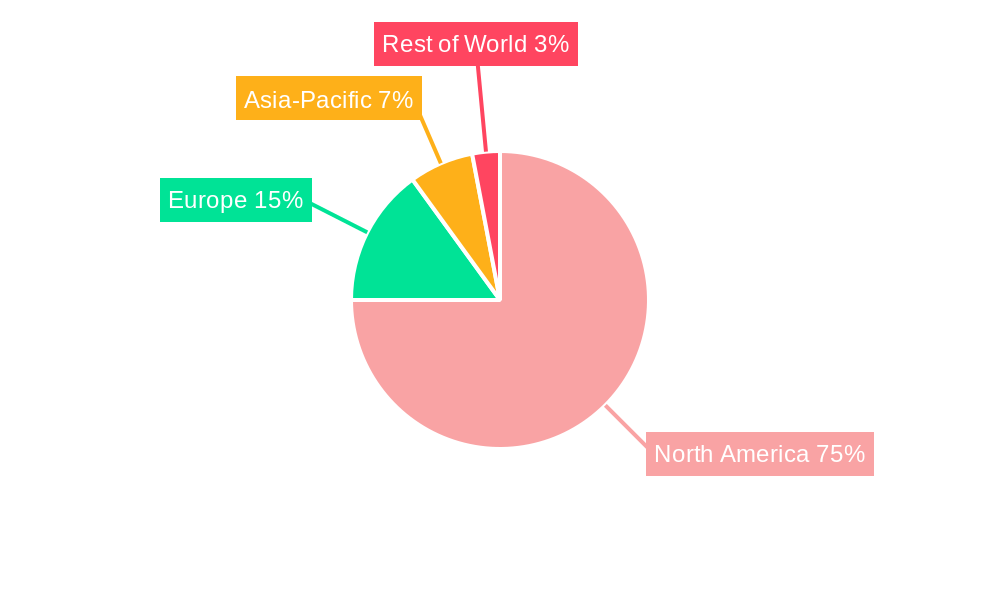
The United States commands the largest share of the North American biosolids market, supported by its robust wastewater treatment infrastructure and substantial agricultural sector. Canada and Mexico are also experiencing notable growth, particularly in land reclamation applications. Segments like Class A and Class A EQ are growing faster than Class B due to their superior quality and broader applicability in agriculture and landscaping. Pelleted biosolids are gaining traction for their handling and transportation advantages. Future market expansion will be heavily influenced by technological innovations that enhance processing efficiency, nutrient recovery, and reduce logistics expenses. The growing emphasis on circular economy principles and evolving regulations are shaping the future trajectory of the North American biosolids market, creating opportunities for novel solutions and sustainable practices.
North America Biosolids Market Company Market Share
North America Biosolids Market: A Comprehensive Report (2019-2033)
This comprehensive report provides an in-depth analysis of the North America biosolids market, encompassing market dynamics, growth trends, regional performance, product landscape, key players, and future outlook. The study period spans from 2019 to 2033, with 2025 serving as the base and estimated year. This report is a crucial resource for industry professionals, investors, and stakeholders seeking to understand and capitalize on the opportunities within this dynamic market. The parent market is the waste management industry, while the child market is specifically biosolids processing and utilization. The market size is projected to reach xx Million by 2033.
North America Biosolids Market Market Dynamics & Structure
The North America biosolids market is characterized by a moderately concentrated landscape with several large players and numerous smaller regional operators. Technological innovation, particularly in advanced treatment and beneficial reuse technologies, is a key driver. Stringent environmental regulations and increasing awareness of sustainable waste management practices further shape market dynamics. Competitive substitutes include landfilling and incineration, but biosolids offer a more environmentally friendly and potentially cost-effective alternative. End-user demographics include agricultural businesses, municipalities, and reclamation projects. M&A activity has been moderate, with larger players seeking to expand their geographic reach and service offerings.
- Market Concentration: Moderately concentrated, with a Herfindahl-Hirschman Index (HHI) of xx.
- Technological Innovation: Focus on advanced digestion, dewatering, and pathogen reduction technologies.
- Regulatory Framework: Stringent EPA regulations governing biosolids handling and disposal.
- Competitive Substitutes: Landfill disposal and incineration.
- End-User Demographics: Agriculture (xx%), Reclamation (xx%), Others (xx%).
- M&A Trends: xx M&A deals recorded between 2019-2024, with an average deal value of xx Million.
North America Biosolids Market Growth Trends & Insights
The North America biosolids market has experienced steady growth over the past few years, driven by increasing urbanization, stricter environmental regulations, and growing awareness of the environmental and economic benefits of biosolids reuse. Market size expanded from xx Million in 2019 to xx Million in 2024, demonstrating a Compound Annual Growth Rate (CAGR) of xx%. Adoption rates for advanced biosolids treatment technologies are increasing, with a market penetration rate of xx% in 2024, projected to reach xx% by 2033. Technological disruptions, such as the development of innovative biosolids processing and application methods, further fuel market expansion. Consumer behavior shifts towards environmentally friendly practices are also contributing to growth. The market is expected to maintain a robust CAGR of xx% during the forecast period (2025-2033), reaching xx Million by 2033.
Dominant Regions, Countries, or Segments in North America Biosolids Market
The Western United States, particularly California, is currently the dominant region, driven by robust agricultural applications and stringent environmental regulations. Within the segments, Class A biosolids command the largest market share due to their higher quality and wider range of applications. The cakes form holds the majority of the market share due to efficient transportation and storage. Agriculture is the leading application segment, owing to the high demand for nutrient-rich biosolids as soil amendments.
- Dominant Region: Western United States (xx% market share)
- Key Country: California (xx% of regional market share)
- Leading Type: Class A (xx% market share)
- Leading Form: Cakes (xx% market share)
- Leading Application: Agriculture (xx% market share)
- Key Drivers: Stringent environmental regulations, large agricultural sector, and government incentives for sustainable waste management.
North America Biosolids Market Product Landscape
The biosolids market showcases continuous innovation in processing technologies, leading to improved product quality and expanded applications. Class A EQ biosolids are gaining traction due to their exceptional quality and suitability for various uses, including direct land application. Technological advancements in anaerobic digestion and dewatering are enhancing efficiency and reducing environmental impact. Unique selling propositions include reduced pathogen load, optimized nutrient content, and suitability for specific applications.
Key Drivers, Barriers & Challenges in North America Biosolids Market
Key Drivers:
- Growing urbanization and increasing wastewater generation.
- Stricter environmental regulations promoting sustainable waste management.
- Rising demand for nutrient-rich soil amendments in agriculture.
- Technological advancements in biosolids treatment and processing.
Challenges & Restraints:
- Public perception issues related to biosolids use.
- High capital costs associated with advanced treatment technologies.
- Transportation and logistical challenges for biosolids distribution.
- Regulatory hurdles and permitting complexities. This results in a xx% delay in project implementation.
Emerging Opportunities in North America Biosolids Market
Emerging opportunities include:
- Expanding biosolids applications in energy production (biogas).
- Development of innovative biosolids-based products, such as biochar.
- Increased adoption of decentralized biosolids treatment systems.
- Leveraging digital technologies to improve biosolids management and tracking.
Growth Accelerators in the North America Biosolids Market Industry
Technological breakthroughs in biosolids processing and beneficial reuse technologies, coupled with strategic partnerships between waste management companies and agricultural businesses, are accelerating market growth. Expansion into new application areas, such as biofuel production and construction materials, further fuels the market's trajectory.
Key Players Shaping the North America Biosolids Market Market
- Walker Industries
- Fergus Power Pump Inc
- Denali Water Solutions
- GEOENVIRONMENT TECHNOLOGIES
- Anaergia
- New England Fertilizer Co (NEFCO)
- DC Water
- Recyc Systems Inc
- BCR Environmental
- Burch Hydro
- SYLVIS
- Casella Waste Systems Inc
- Englobe
- Lystek International
- Synagro Technologies
- Merrell Bros Inc
Notable Milestones in North America Biosolids Market Sector
- 2021: Lystek International launched a new biosolids processing technology.
- 2022: A major merger between two large biosolids management companies.
- 2023: Introduction of new regulations impacting biosolids handling in several states.
In-Depth North America Biosolids Market Market Outlook
The North America biosolids market is poised for sustained growth, driven by technological advancements, increasing environmental awareness, and supportive government policies. Strategic partnerships and expansion into new application areas will further unlock market potential, making it an attractive sector for investment and innovation. The market's future is bright, promising significant opportunities for companies engaged in biosolids management and utilization.
North America Biosolids Market Segmentation
-
1. Type
- 1.1. Class A
- 1.2. Class A EQ (Exceptional Quality)
- 1.3. Class B
-
2. Form
- 2.1. Cakes
- 2.2. Liquid
- 2.3. Pellet
-
3. Application
-
3.1. Agriculture Land Application
- 3.1.1. Fertiliz
- 3.1.2. Fertilizer for Animal Crop Production - Pastures
-
3.2. Non-agricultural Land Application
- 3.2.1. Forest Crops (Land Restoration and Forestry)
- 3.2.2. Land Reclamation (Roads and Urban Wetlands)
- 3.2.3. Reclaiming Mining Sites
- 3.2.4. Landscaping, Recreational Fields, and Domestic Use
-
3.3. Energy Recovery - Energy Production
- 3.3.1. Heat Generation, Incineration, and Gasification
- 3.3.2. Oil and Cement Production
- 3.3.3. Commercial Uses
-
3.1. Agriculture Land Application
-
4. Geography
- 4.1. United States
- 4.2. Canada
- 4.3. Mexico
- 4.4. Rest of North America
North America Biosolids Market Segmentation By Geography
- 1. United States
- 2. Canada
- 3. Mexico
- 4. Rest of North America
North America Biosolids Market Regional Market Share
Geographic Coverage of North America Biosolids Market
North America Biosolids Market REPORT HIGHLIGHTS
| Aspects | Details |
|---|---|
| Study Period | 2020-2034 |
| Base Year | 2025 |
| Estimated Year | 2026 |
| Forecast Period | 2026-2034 |
| Historical Period | 2020-2025 |
| Growth Rate | CAGR of 4.5% from 2020-2034 |
| Segmentation |
|
Table of Contents
- 1. Introduction
- 1.1. Research Scope
- 1.2. Market Segmentation
- 1.3. Research Objective
- 1.4. Definitions and Assumptions
- 2. Executive Summary
- 2.1. Market Snapshot
- 3. Market Dynamics
- 3.1. Market Drivers
- 3.2. Market Restrains
- 3.3. Market Trends
- 3.4. Market Opportunities
- 4. Market Factor Analysis
- 4.1. Porters Five Forces
- 4.1.1. Bargaining Power of Suppliers
- 4.1.2. Bargaining Power of Buyers
- 4.1.3. Threat of New Entrants
- 4.1.4. Threat of Substitutes
- 4.1.5. Competitive Rivalry
- 4.2. PESTEL analysis
- 4.3. BCG Analysis
- 4.3.1. Stars (High Growth, High Market Share)
- 4.3.2. Cash Cows (Low Growth, High Market Share)
- 4.3.3. Question Mark (High Growth, Low Market Share)
- 4.3.4. Dogs (Low Growth, Low Market Share)
- 4.4. Ansoff Matrix Analysis
- 4.5. Supply Chain Analysis
- 4.6. Regulatory Landscape
- 4.7. Current Market Potential and Opportunity Assessment (TAM–SAM–SOM Framework)
- 4.8. VDR Analyst Note
- 4.1. Porters Five Forces
- 5. Market Analysis, Insights and Forecast 2021-2033
- 5.1. Market Analysis, Insights and Forecast - by Type
- 5.1.1. Class A
- 5.1.2. Class A EQ (Exceptional Quality)
- 5.1.3. Class B
- 5.2. Market Analysis, Insights and Forecast - by Form
- 5.2.1. Cakes
- 5.2.2. Liquid
- 5.2.3. Pellet
- 5.3. Market Analysis, Insights and Forecast - by Application
- 5.3.1. Agriculture Land Application
- 5.3.1.1. Fertiliz
- 5.3.1.2. Fertilizer for Animal Crop Production - Pastures
- 5.3.2. Non-agricultural Land Application
- 5.3.2.1. Forest Crops (Land Restoration and Forestry)
- 5.3.2.2. Land Reclamation (Roads and Urban Wetlands)
- 5.3.2.3. Reclaiming Mining Sites
- 5.3.2.4. Landscaping, Recreational Fields, and Domestic Use
- 5.3.3. Energy Recovery - Energy Production
- 5.3.3.1. Heat Generation, Incineration, and Gasification
- 5.3.3.2. Oil and Cement Production
- 5.3.3.3. Commercial Uses
- 5.3.1. Agriculture Land Application
- 5.4. Market Analysis, Insights and Forecast - by Geography
- 5.4.1. United States
- 5.4.2. Canada
- 5.4.3. Mexico
- 5.4.4. Rest of North America
- 5.5. Market Analysis, Insights and Forecast - by Region
- 5.5.1. United States
- 5.5.2. Canada
- 5.5.3. Mexico
- 5.5.4. Rest of North America
- 5.1. Market Analysis, Insights and Forecast - by Type
- 6. North America Biosolids Market Analysis, Insights and Forecast, 2021-2033
- 6.1. Market Analysis, Insights and Forecast - by Type
- 6.1.1. Class A
- 6.1.2. Class A EQ (Exceptional Quality)
- 6.1.3. Class B
- 6.2. Market Analysis, Insights and Forecast - by Form
- 6.2.1. Cakes
- 6.2.2. Liquid
- 6.2.3. Pellet
- 6.3. Market Analysis, Insights and Forecast - by Application
- 6.3.1. Agriculture Land Application
- 6.3.1.1. Fertiliz
- 6.3.1.2. Fertilizer for Animal Crop Production - Pastures
- 6.3.2. Non-agricultural Land Application
- 6.3.2.1. Forest Crops (Land Restoration and Forestry)
- 6.3.2.2. Land Reclamation (Roads and Urban Wetlands)
- 6.3.2.3. Reclaiming Mining Sites
- 6.3.2.4. Landscaping, Recreational Fields, and Domestic Use
- 6.3.3. Energy Recovery - Energy Production
- 6.3.3.1. Heat Generation, Incineration, and Gasification
- 6.3.3.2. Oil and Cement Production
- 6.3.3.3. Commercial Uses
- 6.3.1. Agriculture Land Application
- 6.4. Market Analysis, Insights and Forecast - by Geography
- 6.4.1. United States
- 6.4.2. Canada
- 6.4.3. Mexico
- 6.4.4. Rest of North America
- 6.1. Market Analysis, Insights and Forecast - by Type
- 7. United States North America Biosolids Market Analysis, Insights and Forecast, 2021-2033
- 7.1. Market Analysis, Insights and Forecast - by Type
- 7.1.1. Class A
- 7.1.2. Class A EQ (Exceptional Quality)
- 7.1.3. Class B
- 7.2. Market Analysis, Insights and Forecast - by Form
- 7.2.1. Cakes
- 7.2.2. Liquid
- 7.2.3. Pellet
- 7.3. Market Analysis, Insights and Forecast - by Application
- 7.3.1. Agriculture Land Application
- 7.3.1.1. Fertiliz
- 7.3.1.2. Fertilizer for Animal Crop Production - Pastures
- 7.3.2. Non-agricultural Land Application
- 7.3.2.1. Forest Crops (Land Restoration and Forestry)
- 7.3.2.2. Land Reclamation (Roads and Urban Wetlands)
- 7.3.2.3. Reclaiming Mining Sites
- 7.3.2.4. Landscaping, Recreational Fields, and Domestic Use
- 7.3.3. Energy Recovery - Energy Production
- 7.3.3.1. Heat Generation, Incineration, and Gasification
- 7.3.3.2. Oil and Cement Production
- 7.3.3.3. Commercial Uses
- 7.3.1. Agriculture Land Application
- 7.4. Market Analysis, Insights and Forecast - by Geography
- 7.4.1. United States
- 7.4.2. Canada
- 7.4.3. Mexico
- 7.4.4. Rest of North America
- 7.1. Market Analysis, Insights and Forecast - by Type
- 8. Canada North America Biosolids Market Analysis, Insights and Forecast, 2021-2033
- 8.1. Market Analysis, Insights and Forecast - by Type
- 8.1.1. Class A
- 8.1.2. Class A EQ (Exceptional Quality)
- 8.1.3. Class B
- 8.2. Market Analysis, Insights and Forecast - by Form
- 8.2.1. Cakes
- 8.2.2. Liquid
- 8.2.3. Pellet
- 8.3. Market Analysis, Insights and Forecast - by Application
- 8.3.1. Agriculture Land Application
- 8.3.1.1. Fertiliz
- 8.3.1.2. Fertilizer for Animal Crop Production - Pastures
- 8.3.2. Non-agricultural Land Application
- 8.3.2.1. Forest Crops (Land Restoration and Forestry)
- 8.3.2.2. Land Reclamation (Roads and Urban Wetlands)
- 8.3.2.3. Reclaiming Mining Sites
- 8.3.2.4. Landscaping, Recreational Fields, and Domestic Use
- 8.3.3. Energy Recovery - Energy Production
- 8.3.3.1. Heat Generation, Incineration, and Gasification
- 8.3.3.2. Oil and Cement Production
- 8.3.3.3. Commercial Uses
- 8.3.1. Agriculture Land Application
- 8.4. Market Analysis, Insights and Forecast - by Geography
- 8.4.1. United States
- 8.4.2. Canada
- 8.4.3. Mexico
- 8.4.4. Rest of North America
- 8.1. Market Analysis, Insights and Forecast - by Type
- 9. Mexico North America Biosolids Market Analysis, Insights and Forecast, 2021-2033
- 9.1. Market Analysis, Insights and Forecast - by Type
- 9.1.1. Class A
- 9.1.2. Class A EQ (Exceptional Quality)
- 9.1.3. Class B
- 9.2. Market Analysis, Insights and Forecast - by Form
- 9.2.1. Cakes
- 9.2.2. Liquid
- 9.2.3. Pellet
- 9.3. Market Analysis, Insights and Forecast - by Application
- 9.3.1. Agriculture Land Application
- 9.3.1.1. Fertiliz
- 9.3.1.2. Fertilizer for Animal Crop Production - Pastures
- 9.3.2. Non-agricultural Land Application
- 9.3.2.1. Forest Crops (Land Restoration and Forestry)
- 9.3.2.2. Land Reclamation (Roads and Urban Wetlands)
- 9.3.2.3. Reclaiming Mining Sites
- 9.3.2.4. Landscaping, Recreational Fields, and Domestic Use
- 9.3.3. Energy Recovery - Energy Production
- 9.3.3.1. Heat Generation, Incineration, and Gasification
- 9.3.3.2. Oil and Cement Production
- 9.3.3.3. Commercial Uses
- 9.3.1. Agriculture Land Application
- 9.4. Market Analysis, Insights and Forecast - by Geography
- 9.4.1. United States
- 9.4.2. Canada
- 9.4.3. Mexico
- 9.4.4. Rest of North America
- 9.1. Market Analysis, Insights and Forecast - by Type
- 10. Rest of North America North America Biosolids Market Analysis, Insights and Forecast, 2021-2033
- 10.1. Market Analysis, Insights and Forecast - by Type
- 10.1.1. Class A
- 10.1.2. Class A EQ (Exceptional Quality)
- 10.1.3. Class B
- 10.2. Market Analysis, Insights and Forecast - by Form
- 10.2.1. Cakes
- 10.2.2. Liquid
- 10.2.3. Pellet
- 10.3. Market Analysis, Insights and Forecast - by Application
- 10.3.1. Agriculture Land Application
- 10.3.1.1. Fertiliz
- 10.3.1.2. Fertilizer for Animal Crop Production - Pastures
- 10.3.2. Non-agricultural Land Application
- 10.3.2.1. Forest Crops (Land Restoration and Forestry)
- 10.3.2.2. Land Reclamation (Roads and Urban Wetlands)
- 10.3.2.3. Reclaiming Mining Sites
- 10.3.2.4. Landscaping, Recreational Fields, and Domestic Use
- 10.3.3. Energy Recovery - Energy Production
- 10.3.3.1. Heat Generation, Incineration, and Gasification
- 10.3.3.2. Oil and Cement Production
- 10.3.3.3. Commercial Uses
- 10.3.1. Agriculture Land Application
- 10.4. Market Analysis, Insights and Forecast - by Geography
- 10.4.1. United States
- 10.4.2. Canada
- 10.4.3. Mexico
- 10.4.4. Rest of North America
- 10.1. Market Analysis, Insights and Forecast - by Type
- 11. Competitive Analysis
- 11.1. Company Profiles
- 11.1.1 Walker Industries
- 11.1.1.1. Company Overview
- 11.1.1.2. Products
- 11.1.1.3. Company Financials
- 11.1.1.4. SWOT Analysis
- 11.1.2 Fergus Power Pump Inc
- 11.1.2.1. Company Overview
- 11.1.2.2. Products
- 11.1.2.3. Company Financials
- 11.1.2.4. SWOT Analysis
- 11.1.3 Denali Water Solutions
- 11.1.3.1. Company Overview
- 11.1.3.2. Products
- 11.1.3.3. Company Financials
- 11.1.3.4. SWOT Analysis
- 11.1.4 GEOENVIRONMENT TECHNOLOGIES
- 11.1.4.1. Company Overview
- 11.1.4.2. Products
- 11.1.4.3. Company Financials
- 11.1.4.4. SWOT Analysis
- 11.1.5 Anaergia
- 11.1.5.1. Company Overview
- 11.1.5.2. Products
- 11.1.5.3. Company Financials
- 11.1.5.4. SWOT Analysis
- 11.1.6 New England Fertilizer Co (NEFCO)
- 11.1.6.1. Company Overview
- 11.1.6.2. Products
- 11.1.6.3. Company Financials
- 11.1.6.4. SWOT Analysis
- 11.1.7 DC Water
- 11.1.7.1. Company Overview
- 11.1.7.2. Products
- 11.1.7.3. Company Financials
- 11.1.7.4. SWOT Analysis
- 11.1.8 Recyc Systems Inc
- 11.1.8.1. Company Overview
- 11.1.8.2. Products
- 11.1.8.3. Company Financials
- 11.1.8.4. SWOT Analysis
- 11.1.9 BCR Environmental
- 11.1.9.1. Company Overview
- 11.1.9.2. Products
- 11.1.9.3. Company Financials
- 11.1.9.4. SWOT Analysis
- 11.1.10 Burch Hydro
- 11.1.10.1. Company Overview
- 11.1.10.2. Products
- 11.1.10.3. Company Financials
- 11.1.10.4. SWOT Analysis
- 11.1.11 SYLVIS
- 11.1.11.1. Company Overview
- 11.1.11.2. Products
- 11.1.11.3. Company Financials
- 11.1.11.4. SWOT Analysis
- 11.1.12 Casella Waste Systems Inc
- 11.1.12.1. Company Overview
- 11.1.12.2. Products
- 11.1.12.3. Company Financials
- 11.1.12.4. SWOT Analysis
- 11.1.13 Englobe
- 11.1.13.1. Company Overview
- 11.1.13.2. Products
- 11.1.13.3. Company Financials
- 11.1.13.4. SWOT Analysis
- 11.1.14 Lystek International
- 11.1.14.1. Company Overview
- 11.1.14.2. Products
- 11.1.14.3. Company Financials
- 11.1.14.4. SWOT Analysis
- 11.1.15 Synagro Technologies
- 11.1.15.1. Company Overview
- 11.1.15.2. Products
- 11.1.15.3. Company Financials
- 11.1.15.4. SWOT Analysis
- 11.1.16 Merrell Bros Inc
- 11.1.16.1. Company Overview
- 11.1.16.2. Products
- 11.1.16.3. Company Financials
- 11.1.16.4. SWOT Analysis
- 11.1.1 Walker Industries
- 11.2. Market Entropy
- 11.2.1 Company's Key Areas Served
- 11.2.2 Recent Developments
- 11.3. Company Market Share Analysis 2025
- 11.3.1 Top 5 Companies Market Share Analysis
- 11.3.2 Top 3 Companies Market Share Analysis
- 11.4. List of Potential Customers
- 12. Research Methodology
List of Figures
- Figure 1: North America Biosolids Market Revenue Breakdown (billion, %) by Product 2025 & 2033
- Figure 2: North America Biosolids Market Share (%) by Company 2025
List of Tables
- Table 1: North America Biosolids Market Revenue billion Forecast, by Type 2020 & 2033
- Table 2: North America Biosolids Market Volume K Tons Forecast, by Type 2020 & 2033
- Table 3: North America Biosolids Market Revenue billion Forecast, by Form 2020 & 2033
- Table 4: North America Biosolids Market Volume K Tons Forecast, by Form 2020 & 2033
- Table 5: North America Biosolids Market Revenue billion Forecast, by Application 2020 & 2033
- Table 6: North America Biosolids Market Volume K Tons Forecast, by Application 2020 & 2033
- Table 7: North America Biosolids Market Revenue billion Forecast, by Geography 2020 & 2033
- Table 8: North America Biosolids Market Volume K Tons Forecast, by Geography 2020 & 2033
- Table 9: North America Biosolids Market Revenue billion Forecast, by Region 2020 & 2033
- Table 10: North America Biosolids Market Volume K Tons Forecast, by Region 2020 & 2033
- Table 11: North America Biosolids Market Revenue billion Forecast, by Type 2020 & 2033
- Table 12: North America Biosolids Market Volume K Tons Forecast, by Type 2020 & 2033
- Table 13: North America Biosolids Market Revenue billion Forecast, by Form 2020 & 2033
- Table 14: North America Biosolids Market Volume K Tons Forecast, by Form 2020 & 2033
- Table 15: North America Biosolids Market Revenue billion Forecast, by Application 2020 & 2033
- Table 16: North America Biosolids Market Volume K Tons Forecast, by Application 2020 & 2033
- Table 17: North America Biosolids Market Revenue billion Forecast, by Geography 2020 & 2033
- Table 18: North America Biosolids Market Volume K Tons Forecast, by Geography 2020 & 2033
- Table 19: North America Biosolids Market Revenue billion Forecast, by Country 2020 & 2033
- Table 20: North America Biosolids Market Volume K Tons Forecast, by Country 2020 & 2033
- Table 21: North America Biosolids Market Revenue billion Forecast, by Type 2020 & 2033
- Table 22: North America Biosolids Market Volume K Tons Forecast, by Type 2020 & 2033
- Table 23: North America Biosolids Market Revenue billion Forecast, by Form 2020 & 2033
- Table 24: North America Biosolids Market Volume K Tons Forecast, by Form 2020 & 2033
- Table 25: North America Biosolids Market Revenue billion Forecast, by Application 2020 & 2033
- Table 26: North America Biosolids Market Volume K Tons Forecast, by Application 2020 & 2033
- Table 27: North America Biosolids Market Revenue billion Forecast, by Geography 2020 & 2033
- Table 28: North America Biosolids Market Volume K Tons Forecast, by Geography 2020 & 2033
- Table 29: North America Biosolids Market Revenue billion Forecast, by Country 2020 & 2033
- Table 30: North America Biosolids Market Volume K Tons Forecast, by Country 2020 & 2033
- Table 31: North America Biosolids Market Revenue billion Forecast, by Type 2020 & 2033
- Table 32: North America Biosolids Market Volume K Tons Forecast, by Type 2020 & 2033
- Table 33: North America Biosolids Market Revenue billion Forecast, by Form 2020 & 2033
- Table 34: North America Biosolids Market Volume K Tons Forecast, by Form 2020 & 2033
- Table 35: North America Biosolids Market Revenue billion Forecast, by Application 2020 & 2033
- Table 36: North America Biosolids Market Volume K Tons Forecast, by Application 2020 & 2033
- Table 37: North America Biosolids Market Revenue billion Forecast, by Geography 2020 & 2033
- Table 38: North America Biosolids Market Volume K Tons Forecast, by Geography 2020 & 2033
- Table 39: North America Biosolids Market Revenue billion Forecast, by Country 2020 & 2033
- Table 40: North America Biosolids Market Volume K Tons Forecast, by Country 2020 & 2033
- Table 41: North America Biosolids Market Revenue billion Forecast, by Type 2020 & 2033
- Table 42: North America Biosolids Market Volume K Tons Forecast, by Type 2020 & 2033
- Table 43: North America Biosolids Market Revenue billion Forecast, by Form 2020 & 2033
- Table 44: North America Biosolids Market Volume K Tons Forecast, by Form 2020 & 2033
- Table 45: North America Biosolids Market Revenue billion Forecast, by Application 2020 & 2033
- Table 46: North America Biosolids Market Volume K Tons Forecast, by Application 2020 & 2033
- Table 47: North America Biosolids Market Revenue billion Forecast, by Geography 2020 & 2033
- Table 48: North America Biosolids Market Volume K Tons Forecast, by Geography 2020 & 2033
- Table 49: North America Biosolids Market Revenue billion Forecast, by Country 2020 & 2033
- Table 50: North America Biosolids Market Volume K Tons Forecast, by Country 2020 & 2033
Frequently Asked Questions
1. What is the projected Compound Annual Growth Rate (CAGR) of the North America Biosolids Market?
The projected CAGR is approximately 4.5%.
2. Which companies are prominent players in the North America Biosolids Market?
Key companies in the market include Walker Industries, Fergus Power Pump Inc, Denali Water Solutions, GEOENVIRONMENT TECHNOLOGIES, Anaergia, New England Fertilizer Co (NEFCO), DC Water, Recyc Systems Inc, BCR Environmental, Burch Hydro, SYLVIS, Casella Waste Systems Inc, Englobe, Lystek International, Synagro Technologies, Merrell Bros Inc.
3. What are the main segments of the North America Biosolids Market?
The market segments include Type, Form, Application, Geography.
4. Can you provide details about the market size?
The market size is estimated to be USD 3.84 billion as of 2022.
5. What are some drivers contributing to market growth?
; Growing Use as a Replacement For Hazardous Chemical Fertilizers; Stringent Government Emission Laws; Growing Awareness About Organic Food.
6. What are the notable trends driving market growth?
Agriculture Land Application to Dominate the Market.
7. Are there any restraints impacting market growth?
; Lack of Proper Knowledge and Awareness on Biosolids; Impact of COVID-19 Pandemic; Other Restraints.
8. Can you provide examples of recent developments in the market?
N/A
9. What pricing options are available for accessing the report?
Pricing options include single-user, multi-user, and enterprise licenses priced at USD 4750, USD 5250, and USD 8750 respectively.
10. Is the market size provided in terms of value or volume?
The market size is provided in terms of value, measured in billion and volume, measured in K Tons.
11. Are there any specific market keywords associated with the report?
Yes, the market keyword associated with the report is "North America Biosolids Market," which aids in identifying and referencing the specific market segment covered.
12. How do I determine which pricing option suits my needs best?
The pricing options vary based on user requirements and access needs. Individual users may opt for single-user licenses, while businesses requiring broader access may choose multi-user or enterprise licenses for cost-effective access to the report.
13. Are there any additional resources or data provided in the North America Biosolids Market report?
While the report offers comprehensive insights, it's advisable to review the specific contents or supplementary materials provided to ascertain if additional resources or data are available.
14. How can I stay updated on further developments or reports in the North America Biosolids Market?
To stay informed about further developments, trends, and reports in the North America Biosolids Market, consider subscribing to industry newsletters, following relevant companies and organizations, or regularly checking reputable industry news sources and publications.
Methodology
Step 1 - Identification of Relevant Samples Size from Population Database


Step 2 - Approaches for Defining Global Market Size (Value, Volume* & Price*)

Note*: In applicable scenarios
Step 3 - Data Sources
Primary Research
- Web Analytics
- Survey Reports
- Research Institute
- Latest Research Reports
- Opinion Leaders
Secondary Research
- Annual Reports
- White Paper
- Latest Press Release
- Industry Association
- Paid Database
- Investor Presentations

Step 4 - Data Triangulation
Involves using different sources of information in order to increase the validity of a study
These sources are likely to be stakeholders in a program - participants, other researchers, program staff, other community members, and so on.
Then we put all data in single framework & apply various statistical tools to find out the dynamic on the market.
During the analysis stage, feedback from the stakeholder groups would be compared to determine areas of agreement as well as areas of divergence