

Key Insights
The North American amusement park market is projected to reach $33.3 billion by 2025, with an anticipated Compound Annual Growth Rate (CAGR) of 29.8% through 2033. This substantial growth is driven by rising disposable incomes, particularly among the 19-35 demographic, leading to increased attendance and spending on park amenities. Continuous innovation in attractions, including new rides and immersive experiences, consistently draws visitors across all age groups. Strategic collaborations with hospitality providers, offering bundled packages, and geographic expansion into high-growth regions further bolster revenue. Potential market restraints include economic volatility and escalating operational expenses.
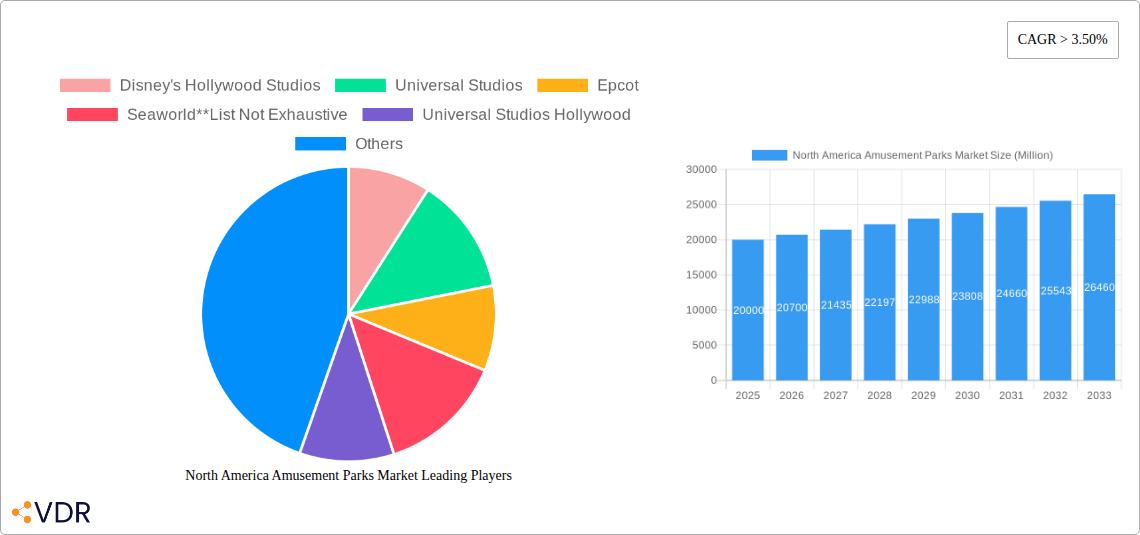
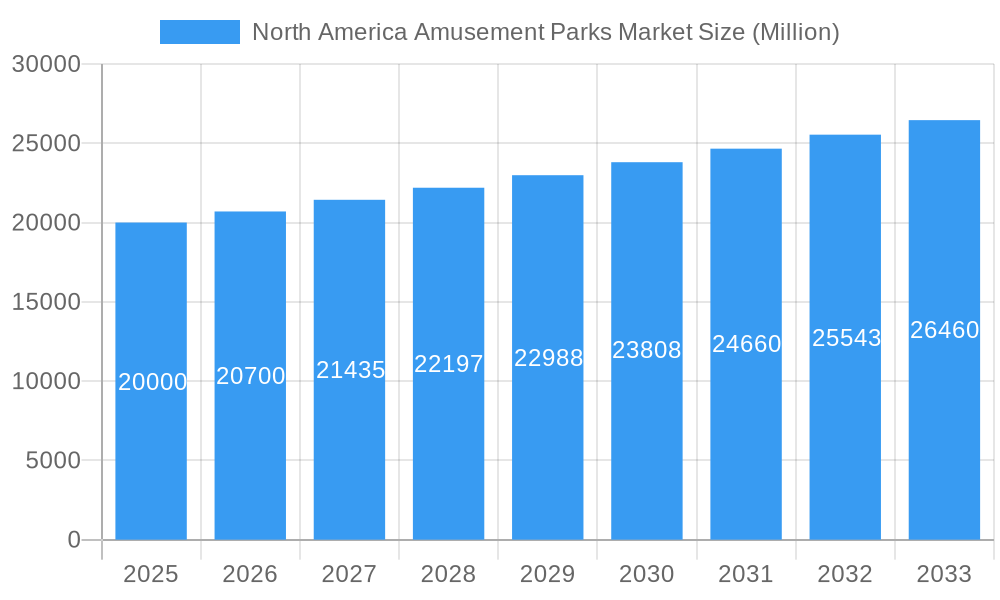
North America Amusement Parks Market Market Size (In Billion)
Opportunities within this dynamic market are varied. While traditional rides remain popular, there is a growing demand for technologically advanced and unique attractions. The 19-35 age segment is a key demographic for targeted marketing initiatives. Revenue diversification through food and beverage, merchandise, and hotel partnerships is vital for sustained profitability. The United States leads the North American market, with Canada and Mexico offering distinct growth prospects based on their demographics and tourism appeal. Adherence to stringent safety regulations and a focus on exceptional customer experiences are critical for maintaining positive market momentum.
North America Amusement Parks Market Company Market Share
North America Amusement Parks Market: A Comprehensive Report (2019-2033)
This in-depth report provides a comprehensive analysis of the North America amusement parks market, encompassing historical data (2019-2024), current estimates (2025), and future forecasts (2025-2033). We delve into market dynamics, growth trends, dominant segments, and key players, offering invaluable insights for industry professionals, investors, and strategic decision-makers. The report covers the parent market of North American leisure and entertainment and the child market of amusement parks specifically. Market value is presented in million units.
North America Amusement Parks Market Dynamics & Structure
The North American amusement park market is characterized by a moderately concentrated structure, with major players like Disney and Universal holding significant market share. Technological innovation, particularly in ride technology and immersive experiences, is a key driver. However, regulatory frameworks regarding safety and accessibility present ongoing challenges. Competitive substitutes include other forms of entertainment, such as video games and streaming services, putting pressure on pricing and attendance. The market's end-user demographics are broad, spanning diverse age groups and family structures. M&A activity has been notable, with several significant acquisitions in recent years.
- Market Concentration: The top 5 players hold approximately XX% of the market share (2025 est.).
- Technological Innovation: VR/AR integration, robotic animatronics, and advanced queuing systems are driving growth.
- Regulatory Framework: Safety standards and accessibility regulations influence operational costs and expansion plans.
- Competitive Substitutes: The rise of home entertainment options poses a constant threat to amusement park attendance.
- End-User Demographics: Family groups (with children under 18) represent the largest segment, but significant market share comes from the 19-35 and 36-50 age groups.
- M&A Trends: The past five years have seen XX major mergers and acquisitions, indicating a trend toward consolidation.
North America Amusement Parks Market Growth Trends & Insights
The North American amusement parks market experienced a CAGR of XX% during the historical period (2019-2024), driven by rising disposable incomes, increasing tourism, and the introduction of innovative rides and attractions. The market is projected to witness a CAGR of YY% during the forecast period (2025-2033), fueled by continued technological advancements and strategic investments by major players. However, economic downturns and potential global uncertainties could impact growth trajectory. Consumer behavior is shifting towards immersive experiences and personalized offerings. Market penetration varies significantly across different regions and segments.
- Market Size (2025 est.): XXX million
- Market Penetration (2025 est.): XX% in major metropolitan areas, YY% in smaller cities.
- Technological Disruptions: The adoption of advanced technology leads to improved guest experience and revenue streams.
Dominant Regions, Countries, or Segments in North America Amusement Parks Market
The United States dominates the North American amusement park market, accounting for approximately ZZ% of the total revenue. Within the U.S., Florida and California are the leading states due to established theme parks. The "Up to 18 years" age segment generates significant revenue, but the "19 to 35 years" segment shows higher growth potential. By revenue stream, "Tickets" accounts for the largest share; however, "Food & Beverages" and "Merchandise" are high-margin segments with growth potential. Mechanical Rides are the most prevalent type of ride.
- Dominant Region: United States (ZZ% market share)
- Leading Segment (by age): Up to 18 years (XX% of revenue)
- Leading Segment (by revenue): Tickets (XX% of revenue)
- Leading Segment (by ride): Mechanical Rides (XX% of revenue)
- Growth Potential: 19-35 year-old demographic shows higher growth potential.
North America Amusement Parks Market Product Landscape
The amusement park product landscape is characterized by a continuous evolution of rides, attractions, and entertainment experiences. Recent innovations include the incorporation of virtual reality (VR), augmented reality (AR), and interactive technologies to enhance guest engagement. The focus remains on creating immersive, memorable, and technologically advanced attractions that cater to diverse age groups and interests. Unique selling propositions include themed experiences, innovative ride technologies, and interactive shows.
Key Drivers, Barriers & Challenges in North America Amusement Parks Market
Key Drivers:
- Increasing disposable incomes.
- Growing tourism.
- Technological advancements in ride design and guest experience.
- Strategic partnerships and expansion by major players.
Challenges:
- Economic downturns (potential impact of XX% revenue decrease in severe recession).
- Intense competition.
- High operational costs, including labor and maintenance.
- Seasonal fluctuations in attendance.
Emerging Opportunities in North America Amusement Parks Market
Emerging opportunities include expansion into underserved markets, development of niche theme parks, and increasing integration of mobile technology for enhanced guest engagement. Personalized experiences, customized packages, and enhanced safety measures are becoming increasingly important. The incorporation of sustainable practices could also appeal to an environmentally conscious consumer base.
Growth Accelerators in the North America Amusement Parks Market Industry
Long-term growth will be driven by continuous technological innovation, strategic partnerships (e.g., collaborations with entertainment companies), and expansion into new geographic areas. Investment in infrastructure, such as transportation and accommodation, will play a crucial role. Targeting specific demographics with tailored experiences will also contribute to long-term growth and increased revenue streams.
Key Players Shaping the North America Amusement Parks Market Market
- Disney's Hollywood Studios
- Universal Studios Hollywood
- Universal Studios Orlando
- Epcot
- Seaworld
- Magic Kingdom
- Disney's Animal Kingdom
- Disney's California Adventure
- Islands of Adventure
- Disneyland
Notable Milestones in North America Amusement Parks Market Sector
- July 2022: Five Star Parks & Attractions acquired three Malibu Jack's Indoor Theme Parks. This acquisition expands the indoor theme park market.
- January 2023: Delaware North's acquisition of Best Western Premier Grand Canyon Squire Inn signals continued expansion in the parks and lodging sector.
In-Depth North America Amusement Parks Market Market Outlook
The North American amusement park market exhibits strong growth potential, driven by technological advancements, evolving consumer preferences, and strategic investments by key players. Future opportunities lie in creating immersive experiences, personalized offerings, and sustainable practices. Strategic partnerships and market expansion will play a vital role in shaping the future of the industry. The market is expected to reach XXX million by 2033.
North America Amusement Parks Market Segmentation
-
1. Rides
- 1.1. Mechanical Rides
- 1.2. Water Rides
- 1.3. Other Rides
-
2. Age
- 2.1. Upto 18 years
- 2.2. 19 to 35 years
- 2.3. 36 to 50 years
- 2.4. 51 to 65 years
- 2.5. More than 65 years
-
3. Revenue
- 3.1. Tickets
- 3.2. Food & Beverages
- 3.3. Merchandise
- 3.4. Hotels/Resorts
- 3.5. Other Revenues
North America Amusement Parks Market Segmentation By Geography
-
1. North America
- 1.1. United States
- 1.2. Canada
- 1.3. Mexico
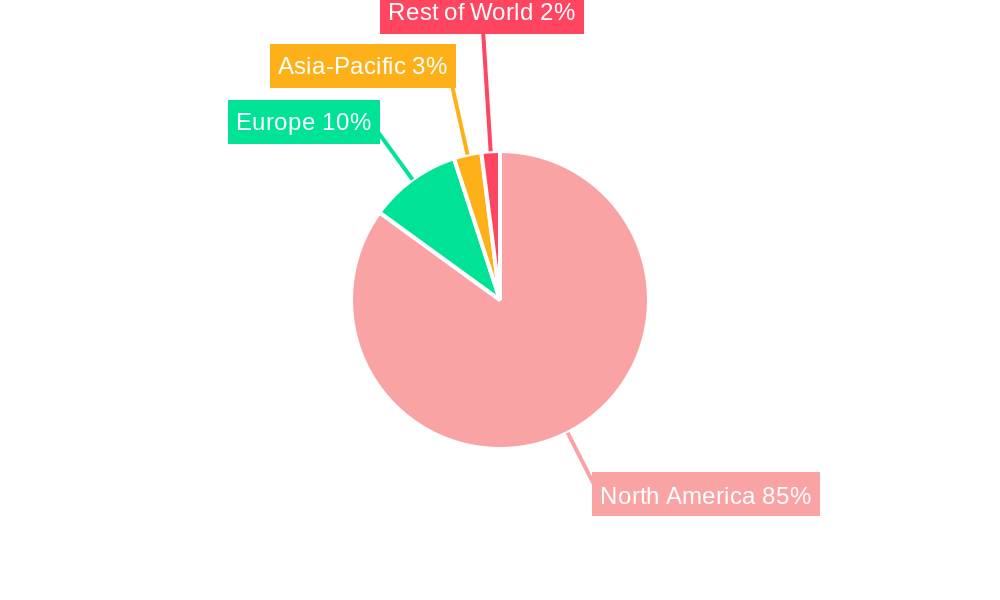
North America Amusement Parks Market Regional Market Share
Geographic Coverage of North America Amusement Parks Market
North America Amusement Parks Market REPORT HIGHLIGHTS
| Aspects | Details |
|---|---|
| Study Period | 2020-2034 |
| Base Year | 2025 |
| Estimated Year | 2026 |
| Forecast Period | 2026-2034 |
| Historical Period | 2020-2025 |
| Growth Rate | CAGR of 29.8% from 2020-2034 |
| Segmentation |
|
Table of Contents
- 1. Introduction
- 1.1. Research Scope
- 1.2. Market Segmentation
- 1.3. Research Objective
- 1.4. Definitions and Assumptions
- 2. Executive Summary
- 2.1. Market Snapshot
- 3. Market Dynamics
- 3.1. Market Drivers
- 3.2. Market Restrains
- 3.3. Market Trends
- 3.4. Market Opportunities
- 4. Market Factor Analysis
- 4.1. Porters Five Forces
- 4.1.1. Bargaining Power of Suppliers
- 4.1.2. Bargaining Power of Buyers
- 4.1.3. Threat of New Entrants
- 4.1.4. Threat of Substitutes
- 4.1.5. Competitive Rivalry
- 4.2. PESTEL analysis
- 4.3. BCG Analysis
- 4.3.1. Stars (High Growth, High Market Share)
- 4.3.2. Cash Cows (Low Growth, High Market Share)
- 4.3.3. Question Mark (High Growth, Low Market Share)
- 4.3.4. Dogs (Low Growth, Low Market Share)
- 4.4. Ansoff Matrix Analysis
- 4.5. Supply Chain Analysis
- 4.6. Regulatory Landscape
- 4.7. Current Market Potential and Opportunity Assessment (TAM–SAM–SOM Framework)
- 4.8. VDR Analyst Note
- 4.1. Porters Five Forces
- 5. Market Analysis, Insights and Forecast 2021-2033
- 5.1. Market Analysis, Insights and Forecast - by Rides
- 5.1.1. Mechanical Rides
- 5.1.2. Water Rides
- 5.1.3. Other Rides
- 5.2. Market Analysis, Insights and Forecast - by Age
- 5.2.1. Upto 18 years
- 5.2.2. 19 to 35 years
- 5.2.3. 36 to 50 years
- 5.2.4. 51 to 65 years
- 5.2.5. More than 65 years
- 5.3. Market Analysis, Insights and Forecast - by Revenue
- 5.3.1. Tickets
- 5.3.2. Food & Beverages
- 5.3.3. Merchandise
- 5.3.4. Hotels/Resorts
- 5.3.5. Other Revenues
- 5.4. Market Analysis, Insights and Forecast - by Region
- 5.4.1. North America
- 5.1. Market Analysis, Insights and Forecast - by Rides
- 6. North America Amusement Parks Market Analysis, Insights and Forecast, 2021-2033
- 6.1. Market Analysis, Insights and Forecast - by Rides
- 6.1.1. Mechanical Rides
- 6.1.2. Water Rides
- 6.1.3. Other Rides
- 6.2. Market Analysis, Insights and Forecast - by Age
- 6.2.1. Upto 18 years
- 6.2.2. 19 to 35 years
- 6.2.3. 36 to 50 years
- 6.2.4. 51 to 65 years
- 6.2.5. More than 65 years
- 6.3. Market Analysis, Insights and Forecast - by Revenue
- 6.3.1. Tickets
- 6.3.2. Food & Beverages
- 6.3.3. Merchandise
- 6.3.4. Hotels/Resorts
- 6.3.5. Other Revenues
- 6.1. Market Analysis, Insights and Forecast - by Rides
- 7. Competitive Analysis
- 7.1. Company Profiles
- 7.1.1 Disney's Hollywood Studios
- 7.1.1.1. Company Overview
- 7.1.1.2. Products
- 7.1.1.3. Company Financials
- 7.1.1.4. SWOT Analysis
- 7.1.2 Universal Studios
- 7.1.2.1. Company Overview
- 7.1.2.2. Products
- 7.1.2.3. Company Financials
- 7.1.2.4. SWOT Analysis
- 7.1.3 Epcot
- 7.1.3.1. Company Overview
- 7.1.3.2. Products
- 7.1.3.3. Company Financials
- 7.1.3.4. SWOT Analysis
- 7.1.4 Seaworld**List Not Exhaustive
- 7.1.4.1. Company Overview
- 7.1.4.2. Products
- 7.1.4.3. Company Financials
- 7.1.4.4. SWOT Analysis
- 7.1.5 Universal Studios Hollywood
- 7.1.5.1. Company Overview
- 7.1.5.2. Products
- 7.1.5.3. Company Financials
- 7.1.5.4. SWOT Analysis
- 7.1.6 Magic Kingdom
- 7.1.6.1. Company Overview
- 7.1.6.2. Products
- 7.1.6.3. Company Financials
- 7.1.6.4. SWOT Analysis
- 7.1.7 Disney's Animal Kingdom
- 7.1.7.1. Company Overview
- 7.1.7.2. Products
- 7.1.7.3. Company Financials
- 7.1.7.4. SWOT Analysis
- 7.1.8 Disney's California Adventure
- 7.1.8.1. Company Overview
- 7.1.8.2. Products
- 7.1.8.3. Company Financials
- 7.1.8.4. SWOT Analysis
- 7.1.9 Islands of Adventure
- 7.1.9.1. Company Overview
- 7.1.9.2. Products
- 7.1.9.3. Company Financials
- 7.1.9.4. SWOT Analysis
- 7.1.10 Disneyland
- 7.1.10.1. Company Overview
- 7.1.10.2. Products
- 7.1.10.3. Company Financials
- 7.1.10.4. SWOT Analysis
- 7.1.1 Disney's Hollywood Studios
- 7.2. Market Entropy
- 7.2.1 Company's Key Areas Served
- 7.2.2 Recent Developments
- 7.3. Company Market Share Analysis 2025
- 7.3.1 Top 5 Companies Market Share Analysis
- 7.3.2 Top 3 Companies Market Share Analysis
- 7.4. List of Potential Customers
- 8. Research Methodology
List of Figures
- Figure 1: North America Amusement Parks Market Revenue Breakdown (billion, %) by Product 2025 & 2033
- Figure 2: North America Amusement Parks Market Share (%) by Company 2025
List of Tables
- Table 1: North America Amusement Parks Market Revenue billion Forecast, by Rides 2020 & 2033
- Table 2: North America Amusement Parks Market Revenue billion Forecast, by Age 2020 & 2033
- Table 3: North America Amusement Parks Market Revenue billion Forecast, by Revenue 2020 & 2033
- Table 4: North America Amusement Parks Market Revenue billion Forecast, by Region 2020 & 2033
- Table 5: North America Amusement Parks Market Revenue billion Forecast, by Rides 2020 & 2033
- Table 6: North America Amusement Parks Market Revenue billion Forecast, by Age 2020 & 2033
- Table 7: North America Amusement Parks Market Revenue billion Forecast, by Revenue 2020 & 2033
- Table 8: North America Amusement Parks Market Revenue billion Forecast, by Country 2020 & 2033
- Table 9: United States North America Amusement Parks Market Revenue (billion) Forecast, by Application 2020 & 2033
- Table 10: Canada North America Amusement Parks Market Revenue (billion) Forecast, by Application 2020 & 2033
- Table 11: Mexico North America Amusement Parks Market Revenue (billion) Forecast, by Application 2020 & 2033
Frequently Asked Questions
1. What is the projected Compound Annual Growth Rate (CAGR) of the North America Amusement Parks Market?
The projected CAGR is approximately 29.8%.
2. Which companies are prominent players in the North America Amusement Parks Market?
Key companies in the market include Disney's Hollywood Studios, Universal Studios, Epcot, Seaworld**List Not Exhaustive, Universal Studios Hollywood, Magic Kingdom, Disney's Animal Kingdom, Disney's California Adventure, Islands of Adventure, Disneyland.
3. What are the main segments of the North America Amusement Parks Market?
The market segments include Rides, Age, Revenue.
4. Can you provide details about the market size?
The market size is estimated to be USD 33.3 billion as of 2022.
5. What are some drivers contributing to market growth?
Rise in the Number of Visitors to Museums is Driving the Market; Digitalization is Driving the Market.
6. What are the notable trends driving market growth?
Mechanical Rides Powering North America's Amusement Park Industry.
7. Are there any restraints impacting market growth?
Maintenance and Preservation Costs; Changing Visitor Preferences.
8. Can you provide examples of recent developments in the market?
January 2023: Global hospitality and entertainment company Delaware North announced its continued expansion in the parks and lodging sector through the acquisition of the Best Western Premier Grand Canyon Squire Inn.
9. What pricing options are available for accessing the report?
Pricing options include single-user, multi-user, and enterprise licenses priced at USD 4750, USD 4950, and USD 6800 respectively.
10. Is the market size provided in terms of value or volume?
The market size is provided in terms of value, measured in billion.
11. Are there any specific market keywords associated with the report?
Yes, the market keyword associated with the report is "North America Amusement Parks Market," which aids in identifying and referencing the specific market segment covered.
12. How do I determine which pricing option suits my needs best?
The pricing options vary based on user requirements and access needs. Individual users may opt for single-user licenses, while businesses requiring broader access may choose multi-user or enterprise licenses for cost-effective access to the report.
13. Are there any additional resources or data provided in the North America Amusement Parks Market report?
While the report offers comprehensive insights, it's advisable to review the specific contents or supplementary materials provided to ascertain if additional resources or data are available.
14. How can I stay updated on further developments or reports in the North America Amusement Parks Market?
To stay informed about further developments, trends, and reports in the North America Amusement Parks Market, consider subscribing to industry newsletters, following relevant companies and organizations, or regularly checking reputable industry news sources and publications.
Methodology
Step 1 - Identification of Relevant Samples Size from Population Database


Step 2 - Approaches for Defining Global Market Size (Value, Volume* & Price*)

Note*: In applicable scenarios
Step 3 - Data Sources
Primary Research
- Web Analytics
- Survey Reports
- Research Institute
- Latest Research Reports
- Opinion Leaders
Secondary Research
- Annual Reports
- White Paper
- Latest Press Release
- Industry Association
- Paid Database
- Investor Presentations

Step 4 - Data Triangulation
Involves using different sources of information in order to increase the validity of a study
These sources are likely to be stakeholders in a program - participants, other researchers, program staff, other community members, and so on.
Then we put all data in single framework & apply various statistical tools to find out the dynamic on the market.
During the analysis stage, feedback from the stakeholder groups would be compared to determine areas of agreement as well as areas of divergence