


Key Insights
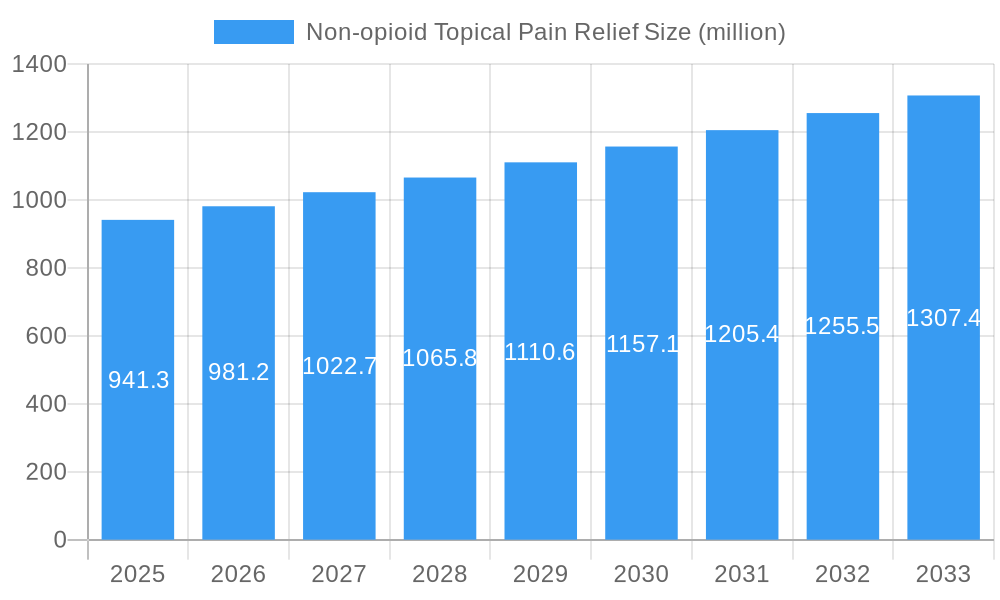
The non-opioid topical pain relief market, valued at $941.3 million in 2025, is projected to experience steady growth, driven by increasing prevalence of chronic pain conditions and a rising preference for non-addictive pain management solutions. The market's Compound Annual Growth Rate (CAGR) of 4.2% from 2025 to 2033 indicates a consistent expansion, fueled by advancements in topical formulations, improved efficacy, and increased consumer awareness of the risks associated with opioid analgesics. Major players like Johnson & Johnson, GlaxoSmithKline, and Pfizer are significantly contributing to market growth through continuous research and development, leading to the introduction of innovative products with enhanced pain-relieving properties and fewer side effects. The market is segmented by product type (creams, gels, patches, sprays), application (arthritis, muscle pain, back pain, neuropathy), and distribution channel (pharmacies, hospitals, online retailers). Growth is further propelled by the rising geriatric population globally, a demographic highly susceptible to chronic pain conditions requiring effective, non-addictive management strategies. However, factors such as stringent regulatory approvals for new drug launches and the availability of generic alternatives may present challenges to market expansion.
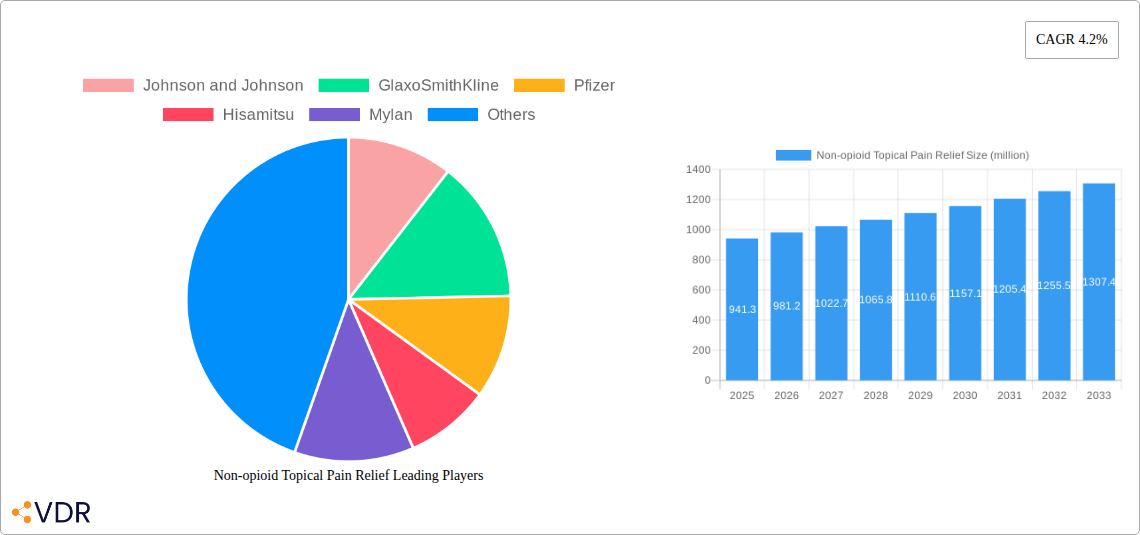
Non-opioid Topical Pain Relief Market Size (In Million)

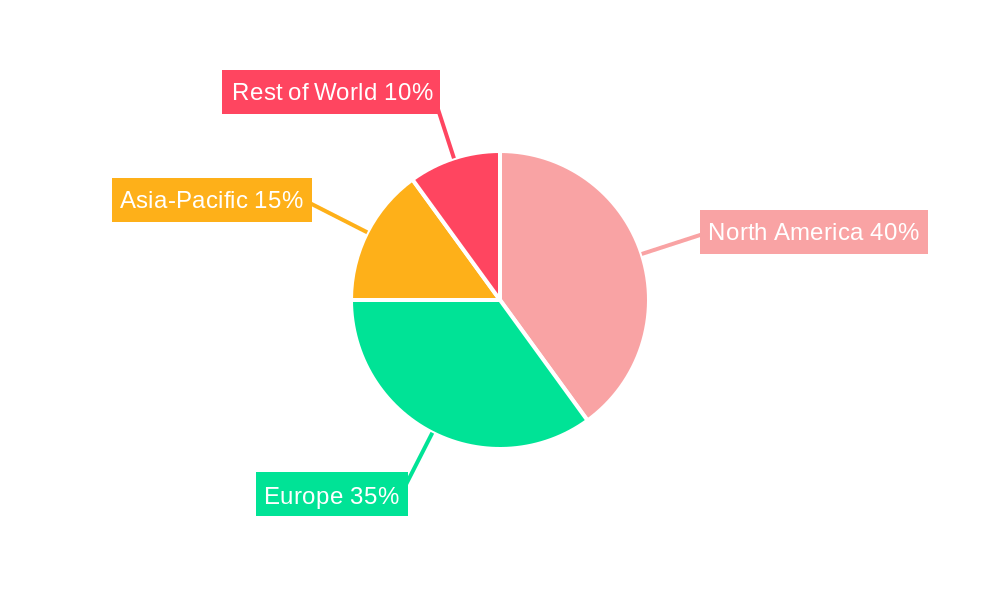
The competitive landscape is characterized by a mix of established pharmaceutical giants and emerging specialized companies. Competition is fierce, with companies focusing on product differentiation, marketing strategies targeted at specific patient segments, and strategic partnerships to enhance market reach. The North American and European regions are currently leading the market, however, Asia-Pacific is projected to showcase substantial growth potential in the coming years due to the expanding healthcare infrastructure and increasing awareness of non-opioid pain management options. Future growth is anticipated to be influenced by factors such as technological innovations resulting in improved formulations with enhanced absorption and efficacy, the development of personalized pain management approaches, and increasing investment in research and development by major players in the industry. The market’s future trajectory suggests a continued rise in demand for safe and effective non-opioid topical pain relief options.
Non-opioid Topical Pain Relief Company Market Share
Non-opioid Topical Pain Relief Market Report: 2019-2033
This comprehensive report provides an in-depth analysis of the non-opioid topical pain relief market, encompassing market dynamics, growth trends, regional dominance, product landscape, key players, and future outlook. The study period covers 2019-2033, with a base year of 2025 and a forecast period of 2025-2033. This report is a crucial resource for industry professionals, investors, and researchers seeking to understand and capitalize on opportunities within this rapidly evolving market segment. The parent market is the pain management market, while the child market is non-opioid topical analgesics.
Non-opioid Topical Pain Relief Market Dynamics & Structure
This section analyzes the competitive landscape, technological advancements, regulatory influences, and market trends impacting the non-opioid topical pain relief market. The market is characterized by a diverse range of players, with varying levels of market share. The report quantifies market concentration through Herfindahl-Hirschman Index (HHI) calculations and analyses market share distribution amongst key players. Technological innovation is a significant driver, with ongoing research into novel formulations and delivery systems. Regulatory frameworks concerning drug approvals and safety standards play a crucial role in market growth and product development.
- Market Concentration: The market exhibits a moderately concentrated structure, with the top 5 players holding approximately XX% market share in 2025. The HHI is estimated at XX.
- Technological Innovation: Advancements in drug delivery systems (e.g., microneedle patches, liposomal formulations) are driving market expansion. Innovation barriers include high R&D costs and stringent regulatory approvals.
- Regulatory Frameworks: Stringent FDA and EMA guidelines concerning efficacy and safety testing influence product development and market access. Variations in regulatory frameworks across different regions present challenges for global expansion.
- Competitive Product Substitutes: Over-the-counter (OTC) NSAIDs, and other pain management methods represent significant competitive substitutes.
- End-User Demographics: The aging global population and rising prevalence of chronic pain conditions are key growth drivers. Increased awareness of opioid risks fuels demand for non-opioid alternatives.
- M&A Trends: The market has witnessed XX M&A deals in the historical period (2019-2024), primarily focused on strengthening product portfolios and expanding market reach.
Non-opioid Topical Pain Relief Growth Trends & Insights
This section details the market's historical and projected growth trajectory, underpinned by detailed analysis of various market dynamics. The market experienced a CAGR of XX% during the historical period (2019-2024), primarily driven by factors such as increasing prevalence of chronic pain, growing awareness of opioid side effects, and the launch of novel products. The forecast period (2025-2033) anticipates a CAGR of XX%, fueled by continued technological advancements and increasing consumer adoption of effective and safer topical pain relief alternatives.
Market size is expected to grow from approximately XXX million units in 2025 to approximately XXX million units by 2033. Market penetration of non-opioid topical pain relief products is projected to increase from XX% in 2025 to XX% by 2033. Technological disruptions, such as the development of advanced delivery systems, are contributing to enhanced efficacy and patient compliance, further accelerating market growth. Consumer behavior shifts, including increased preference for non-pharmacological and natural pain management options, influence market dynamics, though not as significantly compared to other influencing factors.
Dominant Regions, Countries, or Segments in Non-opioid Topical Pain Relief
North America currently holds the largest market share in the non-opioid topical pain relief market, primarily driven by high healthcare expenditure, advanced healthcare infrastructure, and increasing awareness of opioid-related risks. The region is expected to maintain its dominance throughout the forecast period. Europe is another significant market, characterized by strong regulatory frameworks and increasing adoption of non-opioid pain relief solutions. The Asia-Pacific region exhibits high growth potential, fueled by rising disposable incomes, increasing prevalence of chronic pain, and expanding healthcare infrastructure.
- North America: High healthcare expenditure, robust regulatory frameworks, and high awareness of opioid risks contribute to market leadership.
- Europe: Strong regulatory frameworks and increasing focus on patient safety contribute to significant market growth.
- Asia-Pacific: Rapidly expanding healthcare infrastructure, rising disposable incomes, and increasing prevalence of chronic pain drive substantial growth potential.
Non-opioid Topical Pain Relief Product Landscape
The non-opioid topical pain relief market encompasses a wide array of products, including creams, gels, patches, sprays, and ointments. These products utilize diverse active ingredients, such as NSAIDs, capsaicin, lidocaine, and menthol, each with unique mechanisms of action and efficacy profiles. Recent innovations focus on improved drug delivery systems, enhanced efficacy, and reduced side effects. Unique selling propositions often center around superior pain relief, ease of application, and minimal side effects. Technological advancements include micro-needle patches for enhanced drug penetration and controlled-release formulations for sustained pain relief.
Key Drivers, Barriers & Challenges in Non-opioid Topical Pain Relief
Key Drivers:
- Increasing prevalence of chronic pain conditions globally.
- Rising awareness of opioid-related risks and stricter regulations on opioid prescriptions.
- Technological advancements leading to improved efficacy and patient compliance.
- Growing demand for non-invasive and convenient pain management solutions.
Key Challenges and Restraints:
- High research and development costs associated with developing novel topical pain relief formulations.
- Stringent regulatory approvals and complex regulatory landscapes in different regions.
- Competition from established pain management options, including oral NSAIDs and other analgesics.
- Potential variability in efficacy across different patient populations and pain conditions. This results in a need for personalized treatment approaches and challenges in standardization of product efficacy.
- Supply chain disruptions and raw material price fluctuations can impact product availability and cost.
Emerging Opportunities in Non-opioid Topical Pain Relief
- Expanding into untapped markets in developing economies.
- Development of personalized topical pain relief solutions tailored to specific patient needs.
- Exploring novel drug delivery systems, such as microneedle patches and liposomal formulations, to enhance efficacy and reduce side effects.
- Leveraging digital health technologies to improve patient education and compliance.
- Development of combination products incorporating multiple active ingredients to achieve synergistic pain relief effects.
Growth Accelerators in the Non-opioid Topical Pain Relief Industry
Technological breakthroughs in drug delivery and formulation are key growth catalysts. Strategic partnerships and collaborations between pharmaceutical companies and technology providers are accelerating innovation. Market expansion strategies targeting underserved patient populations and geographical regions will fuel long-term growth. Furthermore, increasing investments in research and development, aimed at discovering and developing novel non-opioid pain-relieving compounds, will drive market expansion.
Key Players Shaping the Non-opioid Topical Pain Relief Market
- Johnson & Johnson
- GlaxoSmithKline
- Pfizer
- Hisamitsu
- Mylan
- Reckitt Benckiser Group
- Sanofi
- Teva Pharmaceutical
- Sun Pharmaceutical Industries
- Lingrui Pharmaceutical
- Tibet Cheezheng Tibetan Medicine
- China Resources Sanjiu Medical & Pharmaceutical
- Topical BioMedics
- AdvaCare Pharma
- Abacus Health Products
Notable Milestones in Non-opioid Topical Pain Relief Sector
- 2020: Launch of a novel capsaicin patch with enhanced efficacy and reduced side effects by Company X.
- 2022: Approval of a new lidocaine-based gel for neuropathic pain by regulatory body Y.
- 2023: Acquisition of Company A by Company B, expanding the market presence of Company B in the topical pain relief sector.
In-Depth Non-opioid Topical Pain Relief Market Outlook
The non-opioid topical pain relief market is poised for significant growth over the next decade, driven by several factors. Continued technological advancements in drug delivery systems will lead to improved efficacy and patient outcomes. Strategic partnerships and collaborations will accelerate innovation and market penetration. Expanding into underserved markets and focusing on personalized medicine will unlock further growth potential. The long-term outlook remains optimistic, with the market anticipated to reach significant size and market share by 2033, representing a lucrative opportunity for both established and emerging players.
Non-opioid Topical Pain Relief Segmentation
-
1. Application
- 1.1. Pharmacy
- 1.2. Clinic
- 1.3. Hospital
- 1.4. Others
-
2. Types
- 2.1. Prescription Pain Relief
- 2.2. Over-The-Counter Pain Relief
Non-opioid Topical Pain Relief Segmentation By Geography
-
1. North America
- 1.1. United States
- 1.2. Canada
- 1.3. Mexico
-
2. South America
- 2.1. Brazil
- 2.2. Argentina
- 2.3. Rest of South America
-
3. Europe
- 3.1. United Kingdom
- 3.2. Germany
- 3.3. France
- 3.4. Italy
- 3.5. Spain
- 3.6. Russia
- 3.7. Benelux
- 3.8. Nordics
- 3.9. Rest of Europe
-
4. Middle East & Africa
- 4.1. Turkey
- 4.2. Israel
- 4.3. GCC
- 4.4. North Africa
- 4.5. South Africa
- 4.6. Rest of Middle East & Africa
-
5. Asia Pacific
- 5.1. China
- 5.2. India
- 5.3. Japan
- 5.4. South Korea
- 5.5. ASEAN
- 5.6. Oceania
- 5.7. Rest of Asia Pacific
Non-opioid Topical Pain Relief Regional Market Share
Geographic Coverage of Non-opioid Topical Pain Relief
Non-opioid Topical Pain Relief REPORT HIGHLIGHTS
| Aspects | Details |
|---|---|
| Study Period | 2020-2034 |
| Base Year | 2025 |
| Estimated Year | 2026 |
| Forecast Period | 2026-2034 |
| Historical Period | 2020-2025 |
| Growth Rate | CAGR of 5.2% from 2020-2034 |
| Segmentation |
|
Table of Contents
- 1. Introduction
- 1.1. Research Scope
- 1.2. Market Segmentation
- 1.3. Research Methodology
- 1.4. Definitions and Assumptions
- 2. Executive Summary
- 2.1. Introduction
- 3. Market Dynamics
- 3.1. Introduction
- 3.2. Market Drivers
- 3.3. Market Restrains
- 3.4. Market Trends
- 4. Market Factor Analysis
- 4.1. Porters Five Forces
- 4.2. Supply/Value Chain
- 4.3. PESTEL analysis
- 4.4. Market Entropy
- 4.5. Patent/Trademark Analysis
- 5. Global Non-opioid Topical Pain Relief Analysis, Insights and Forecast, 2020-2032
- 5.1. Market Analysis, Insights and Forecast - by Application
- 5.1.1. Pharmacy
- 5.1.2. Clinic
- 5.1.3. Hospital
- 5.1.4. Others
- 5.2. Market Analysis, Insights and Forecast - by Types
- 5.2.1. Prescription Pain Relief
- 5.2.2. Over-The-Counter Pain Relief
- 5.3. Market Analysis, Insights and Forecast - by Region
- 5.3.1. North America
- 5.3.2. South America
- 5.3.3. Europe
- 5.3.4. Middle East & Africa
- 5.3.5. Asia Pacific
- 5.1. Market Analysis, Insights and Forecast - by Application
- 6. North America Non-opioid Topical Pain Relief Analysis, Insights and Forecast, 2020-2032
- 6.1. Market Analysis, Insights and Forecast - by Application
- 6.1.1. Pharmacy
- 6.1.2. Clinic
- 6.1.3. Hospital
- 6.1.4. Others
- 6.2. Market Analysis, Insights and Forecast - by Types
- 6.2.1. Prescription Pain Relief
- 6.2.2. Over-The-Counter Pain Relief
- 6.1. Market Analysis, Insights and Forecast - by Application
- 7. South America Non-opioid Topical Pain Relief Analysis, Insights and Forecast, 2020-2032
- 7.1. Market Analysis, Insights and Forecast - by Application
- 7.1.1. Pharmacy
- 7.1.2. Clinic
- 7.1.3. Hospital
- 7.1.4. Others
- 7.2. Market Analysis, Insights and Forecast - by Types
- 7.2.1. Prescription Pain Relief
- 7.2.2. Over-The-Counter Pain Relief
- 7.1. Market Analysis, Insights and Forecast - by Application
- 8. Europe Non-opioid Topical Pain Relief Analysis, Insights and Forecast, 2020-2032
- 8.1. Market Analysis, Insights and Forecast - by Application
- 8.1.1. Pharmacy
- 8.1.2. Clinic
- 8.1.3. Hospital
- 8.1.4. Others
- 8.2. Market Analysis, Insights and Forecast - by Types
- 8.2.1. Prescription Pain Relief
- 8.2.2. Over-The-Counter Pain Relief
- 8.1. Market Analysis, Insights and Forecast - by Application
- 9. Middle East & Africa Non-opioid Topical Pain Relief Analysis, Insights and Forecast, 2020-2032
- 9.1. Market Analysis, Insights and Forecast - by Application
- 9.1.1. Pharmacy
- 9.1.2. Clinic
- 9.1.3. Hospital
- 9.1.4. Others
- 9.2. Market Analysis, Insights and Forecast - by Types
- 9.2.1. Prescription Pain Relief
- 9.2.2. Over-The-Counter Pain Relief
- 9.1. Market Analysis, Insights and Forecast - by Application
- 10. Asia Pacific Non-opioid Topical Pain Relief Analysis, Insights and Forecast, 2020-2032
- 10.1. Market Analysis, Insights and Forecast - by Application
- 10.1.1. Pharmacy
- 10.1.2. Clinic
- 10.1.3. Hospital
- 10.1.4. Others
- 10.2. Market Analysis, Insights and Forecast - by Types
- 10.2.1. Prescription Pain Relief
- 10.2.2. Over-The-Counter Pain Relief
- 10.1. Market Analysis, Insights and Forecast - by Application
- 11. Competitive Analysis
- 11.1. Global Market Share Analysis 2025
- 11.2. Company Profiles
- 11.2.1 Johnson and Johnson
- 11.2.1.1. Overview
- 11.2.1.2. Products
- 11.2.1.3. SWOT Analysis
- 11.2.1.4. Recent Developments
- 11.2.1.5. Financials (Based on Availability)
- 11.2.2 GlaxoSmithKline
- 11.2.2.1. Overview
- 11.2.2.2. Products
- 11.2.2.3. SWOT Analysis
- 11.2.2.4. Recent Developments
- 11.2.2.5. Financials (Based on Availability)
- 11.2.3 Pfizer
- 11.2.3.1. Overview
- 11.2.3.2. Products
- 11.2.3.3. SWOT Analysis
- 11.2.3.4. Recent Developments
- 11.2.3.5. Financials (Based on Availability)
- 11.2.4 Hisamitsu
- 11.2.4.1. Overview
- 11.2.4.2. Products
- 11.2.4.3. SWOT Analysis
- 11.2.4.4. Recent Developments
- 11.2.4.5. Financials (Based on Availability)
- 11.2.5 Mylan
- 11.2.5.1. Overview
- 11.2.5.2. Products
- 11.2.5.3. SWOT Analysis
- 11.2.5.4. Recent Developments
- 11.2.5.5. Financials (Based on Availability)
- 11.2.6 Reckitt Benckiser Group
- 11.2.6.1. Overview
- 11.2.6.2. Products
- 11.2.6.3. SWOT Analysis
- 11.2.6.4. Recent Developments
- 11.2.6.5. Financials (Based on Availability)
- 11.2.7 Sanofi
- 11.2.7.1. Overview
- 11.2.7.2. Products
- 11.2.7.3. SWOT Analysis
- 11.2.7.4. Recent Developments
- 11.2.7.5. Financials (Based on Availability)
- 11.2.8 Teva Pharmaceutical
- 11.2.8.1. Overview
- 11.2.8.2. Products
- 11.2.8.3. SWOT Analysis
- 11.2.8.4. Recent Developments
- 11.2.8.5. Financials (Based on Availability)
- 11.2.9 Sun Pharmaceutical Industries
- 11.2.9.1. Overview
- 11.2.9.2. Products
- 11.2.9.3. SWOT Analysis
- 11.2.9.4. Recent Developments
- 11.2.9.5. Financials (Based on Availability)
- 11.2.10 Lingrui Pharmaceutical
- 11.2.10.1. Overview
- 11.2.10.2. Products
- 11.2.10.3. SWOT Analysis
- 11.2.10.4. Recent Developments
- 11.2.10.5. Financials (Based on Availability)
- 11.2.11 Tibet Cheezheng Tibetan Medicine
- 11.2.11.1. Overview
- 11.2.11.2. Products
- 11.2.11.3. SWOT Analysis
- 11.2.11.4. Recent Developments
- 11.2.11.5. Financials (Based on Availability)
- 11.2.12 China Resources Sanjiu Medical & Pharmaceutical
- 11.2.12.1. Overview
- 11.2.12.2. Products
- 11.2.12.3. SWOT Analysis
- 11.2.12.4. Recent Developments
- 11.2.12.5. Financials (Based on Availability)
- 11.2.13 Topical BioMedics
- 11.2.13.1. Overview
- 11.2.13.2. Products
- 11.2.13.3. SWOT Analysis
- 11.2.13.4. Recent Developments
- 11.2.13.5. Financials (Based on Availability)
- 11.2.14 AdvaCare Pharma
- 11.2.14.1. Overview
- 11.2.14.2. Products
- 11.2.14.3. SWOT Analysis
- 11.2.14.4. Recent Developments
- 11.2.14.5. Financials (Based on Availability)
- 11.2.15 Abacus Health Products
- 11.2.15.1. Overview
- 11.2.15.2. Products
- 11.2.15.3. SWOT Analysis
- 11.2.15.4. Recent Developments
- 11.2.15.5. Financials (Based on Availability)
- 11.2.1 Johnson and Johnson
List of Figures
- Figure 1: Global Non-opioid Topical Pain Relief Revenue Breakdown (undefined, %) by Region 2025 & 2033
- Figure 2: North America Non-opioid Topical Pain Relief Revenue (undefined), by Application 2025 & 2033
- Figure 3: North America Non-opioid Topical Pain Relief Revenue Share (%), by Application 2025 & 2033
- Figure 4: North America Non-opioid Topical Pain Relief Revenue (undefined), by Types 2025 & 2033
- Figure 5: North America Non-opioid Topical Pain Relief Revenue Share (%), by Types 2025 & 2033
- Figure 6: North America Non-opioid Topical Pain Relief Revenue (undefined), by Country 2025 & 2033
- Figure 7: North America Non-opioid Topical Pain Relief Revenue Share (%), by Country 2025 & 2033
- Figure 8: South America Non-opioid Topical Pain Relief Revenue (undefined), by Application 2025 & 2033
- Figure 9: South America Non-opioid Topical Pain Relief Revenue Share (%), by Application 2025 & 2033
- Figure 10: South America Non-opioid Topical Pain Relief Revenue (undefined), by Types 2025 & 2033
- Figure 11: South America Non-opioid Topical Pain Relief Revenue Share (%), by Types 2025 & 2033
- Figure 12: South America Non-opioid Topical Pain Relief Revenue (undefined), by Country 2025 & 2033
- Figure 13: South America Non-opioid Topical Pain Relief Revenue Share (%), by Country 2025 & 2033
- Figure 14: Europe Non-opioid Topical Pain Relief Revenue (undefined), by Application 2025 & 2033
- Figure 15: Europe Non-opioid Topical Pain Relief Revenue Share (%), by Application 2025 & 2033
- Figure 16: Europe Non-opioid Topical Pain Relief Revenue (undefined), by Types 2025 & 2033
- Figure 17: Europe Non-opioid Topical Pain Relief Revenue Share (%), by Types 2025 & 2033
- Figure 18: Europe Non-opioid Topical Pain Relief Revenue (undefined), by Country 2025 & 2033
- Figure 19: Europe Non-opioid Topical Pain Relief Revenue Share (%), by Country 2025 & 2033
- Figure 20: Middle East & Africa Non-opioid Topical Pain Relief Revenue (undefined), by Application 2025 & 2033
- Figure 21: Middle East & Africa Non-opioid Topical Pain Relief Revenue Share (%), by Application 2025 & 2033
- Figure 22: Middle East & Africa Non-opioid Topical Pain Relief Revenue (undefined), by Types 2025 & 2033
- Figure 23: Middle East & Africa Non-opioid Topical Pain Relief Revenue Share (%), by Types 2025 & 2033
- Figure 24: Middle East & Africa Non-opioid Topical Pain Relief Revenue (undefined), by Country 2025 & 2033
- Figure 25: Middle East & Africa Non-opioid Topical Pain Relief Revenue Share (%), by Country 2025 & 2033
- Figure 26: Asia Pacific Non-opioid Topical Pain Relief Revenue (undefined), by Application 2025 & 2033
- Figure 27: Asia Pacific Non-opioid Topical Pain Relief Revenue Share (%), by Application 2025 & 2033
- Figure 28: Asia Pacific Non-opioid Topical Pain Relief Revenue (undefined), by Types 2025 & 2033
- Figure 29: Asia Pacific Non-opioid Topical Pain Relief Revenue Share (%), by Types 2025 & 2033
- Figure 30: Asia Pacific Non-opioid Topical Pain Relief Revenue (undefined), by Country 2025 & 2033
- Figure 31: Asia Pacific Non-opioid Topical Pain Relief Revenue Share (%), by Country 2025 & 2033
List of Tables
- Table 1: Global Non-opioid Topical Pain Relief Revenue undefined Forecast, by Application 2020 & 2033
- Table 2: Global Non-opioid Topical Pain Relief Revenue undefined Forecast, by Types 2020 & 2033
- Table 3: Global Non-opioid Topical Pain Relief Revenue undefined Forecast, by Region 2020 & 2033
- Table 4: Global Non-opioid Topical Pain Relief Revenue undefined Forecast, by Application 2020 & 2033
- Table 5: Global Non-opioid Topical Pain Relief Revenue undefined Forecast, by Types 2020 & 2033
- Table 6: Global Non-opioid Topical Pain Relief Revenue undefined Forecast, by Country 2020 & 2033
- Table 7: United States Non-opioid Topical Pain Relief Revenue (undefined) Forecast, by Application 2020 & 2033
- Table 8: Canada Non-opioid Topical Pain Relief Revenue (undefined) Forecast, by Application 2020 & 2033
- Table 9: Mexico Non-opioid Topical Pain Relief Revenue (undefined) Forecast, by Application 2020 & 2033
- Table 10: Global Non-opioid Topical Pain Relief Revenue undefined Forecast, by Application 2020 & 2033
- Table 11: Global Non-opioid Topical Pain Relief Revenue undefined Forecast, by Types 2020 & 2033
- Table 12: Global Non-opioid Topical Pain Relief Revenue undefined Forecast, by Country 2020 & 2033
- Table 13: Brazil Non-opioid Topical Pain Relief Revenue (undefined) Forecast, by Application 2020 & 2033
- Table 14: Argentina Non-opioid Topical Pain Relief Revenue (undefined) Forecast, by Application 2020 & 2033
- Table 15: Rest of South America Non-opioid Topical Pain Relief Revenue (undefined) Forecast, by Application 2020 & 2033
- Table 16: Global Non-opioid Topical Pain Relief Revenue undefined Forecast, by Application 2020 & 2033
- Table 17: Global Non-opioid Topical Pain Relief Revenue undefined Forecast, by Types 2020 & 2033
- Table 18: Global Non-opioid Topical Pain Relief Revenue undefined Forecast, by Country 2020 & 2033
- Table 19: United Kingdom Non-opioid Topical Pain Relief Revenue (undefined) Forecast, by Application 2020 & 2033
- Table 20: Germany Non-opioid Topical Pain Relief Revenue (undefined) Forecast, by Application 2020 & 2033
- Table 21: France Non-opioid Topical Pain Relief Revenue (undefined) Forecast, by Application 2020 & 2033
- Table 22: Italy Non-opioid Topical Pain Relief Revenue (undefined) Forecast, by Application 2020 & 2033
- Table 23: Spain Non-opioid Topical Pain Relief Revenue (undefined) Forecast, by Application 2020 & 2033
- Table 24: Russia Non-opioid Topical Pain Relief Revenue (undefined) Forecast, by Application 2020 & 2033
- Table 25: Benelux Non-opioid Topical Pain Relief Revenue (undefined) Forecast, by Application 2020 & 2033
- Table 26: Nordics Non-opioid Topical Pain Relief Revenue (undefined) Forecast, by Application 2020 & 2033
- Table 27: Rest of Europe Non-opioid Topical Pain Relief Revenue (undefined) Forecast, by Application 2020 & 2033
- Table 28: Global Non-opioid Topical Pain Relief Revenue undefined Forecast, by Application 2020 & 2033
- Table 29: Global Non-opioid Topical Pain Relief Revenue undefined Forecast, by Types 2020 & 2033
- Table 30: Global Non-opioid Topical Pain Relief Revenue undefined Forecast, by Country 2020 & 2033
- Table 31: Turkey Non-opioid Topical Pain Relief Revenue (undefined) Forecast, by Application 2020 & 2033
- Table 32: Israel Non-opioid Topical Pain Relief Revenue (undefined) Forecast, by Application 2020 & 2033
- Table 33: GCC Non-opioid Topical Pain Relief Revenue (undefined) Forecast, by Application 2020 & 2033
- Table 34: North Africa Non-opioid Topical Pain Relief Revenue (undefined) Forecast, by Application 2020 & 2033
- Table 35: South Africa Non-opioid Topical Pain Relief Revenue (undefined) Forecast, by Application 2020 & 2033
- Table 36: Rest of Middle East & Africa Non-opioid Topical Pain Relief Revenue (undefined) Forecast, by Application 2020 & 2033
- Table 37: Global Non-opioid Topical Pain Relief Revenue undefined Forecast, by Application 2020 & 2033
- Table 38: Global Non-opioid Topical Pain Relief Revenue undefined Forecast, by Types 2020 & 2033
- Table 39: Global Non-opioid Topical Pain Relief Revenue undefined Forecast, by Country 2020 & 2033
- Table 40: China Non-opioid Topical Pain Relief Revenue (undefined) Forecast, by Application 2020 & 2033
- Table 41: India Non-opioid Topical Pain Relief Revenue (undefined) Forecast, by Application 2020 & 2033
- Table 42: Japan Non-opioid Topical Pain Relief Revenue (undefined) Forecast, by Application 2020 & 2033
- Table 43: South Korea Non-opioid Topical Pain Relief Revenue (undefined) Forecast, by Application 2020 & 2033
- Table 44: ASEAN Non-opioid Topical Pain Relief Revenue (undefined) Forecast, by Application 2020 & 2033
- Table 45: Oceania Non-opioid Topical Pain Relief Revenue (undefined) Forecast, by Application 2020 & 2033
- Table 46: Rest of Asia Pacific Non-opioid Topical Pain Relief Revenue (undefined) Forecast, by Application 2020 & 2033
Frequently Asked Questions
1. What is the projected Compound Annual Growth Rate (CAGR) of the Non-opioid Topical Pain Relief?
The projected CAGR is approximately 5.2%.
2. Which companies are prominent players in the Non-opioid Topical Pain Relief?
Key companies in the market include Johnson and Johnson, GlaxoSmithKline, Pfizer, Hisamitsu, Mylan, Reckitt Benckiser Group, Sanofi, Teva Pharmaceutical, Sun Pharmaceutical Industries, Lingrui Pharmaceutical, Tibet Cheezheng Tibetan Medicine, China Resources Sanjiu Medical & Pharmaceutical, Topical BioMedics, AdvaCare Pharma, Abacus Health Products.
3. What are the main segments of the Non-opioid Topical Pain Relief?
The market segments include Application, Types.
4. Can you provide details about the market size?
The market size is estimated to be USD XXX N/A as of 2022.
5. What are some drivers contributing to market growth?
N/A
6. What are the notable trends driving market growth?
N/A
7. Are there any restraints impacting market growth?
N/A
8. Can you provide examples of recent developments in the market?
N/A
9. What pricing options are available for accessing the report?
Pricing options include single-user, multi-user, and enterprise licenses priced at USD 2900.00, USD 4350.00, and USD 5800.00 respectively.
10. Is the market size provided in terms of value or volume?
The market size is provided in terms of value, measured in N/A.
11. Are there any specific market keywords associated with the report?
Yes, the market keyword associated with the report is "Non-opioid Topical Pain Relief," which aids in identifying and referencing the specific market segment covered.
12. How do I determine which pricing option suits my needs best?
The pricing options vary based on user requirements and access needs. Individual users may opt for single-user licenses, while businesses requiring broader access may choose multi-user or enterprise licenses for cost-effective access to the report.
13. Are there any additional resources or data provided in the Non-opioid Topical Pain Relief report?
While the report offers comprehensive insights, it's advisable to review the specific contents or supplementary materials provided to ascertain if additional resources or data are available.
14. How can I stay updated on further developments or reports in the Non-opioid Topical Pain Relief?
To stay informed about further developments, trends, and reports in the Non-opioid Topical Pain Relief, consider subscribing to industry newsletters, following relevant companies and organizations, or regularly checking reputable industry news sources and publications.
Methodology
Step 1 - Identification of Relevant Samples Size from Population Database


Step 2 - Approaches for Defining Global Market Size (Value, Volume* & Price*)

Note*: In applicable scenarios
Step 3 - Data Sources
Primary Research
- Web Analytics
- Survey Reports
- Research Institute
- Latest Research Reports
- Opinion Leaders
Secondary Research
- Annual Reports
- White Paper
- Latest Press Release
- Industry Association
- Paid Database
- Investor Presentations

Step 4 - Data Triangulation
Involves using different sources of information in order to increase the validity of a study
These sources are likely to be stakeholders in a program - participants, other researchers, program staff, other community members, and so on.
Then we put all data in single framework & apply various statistical tools to find out the dynamic on the market.
During the analysis stage, feedback from the stakeholder groups would be compared to determine areas of agreement as well as areas of divergence