

Key Insights
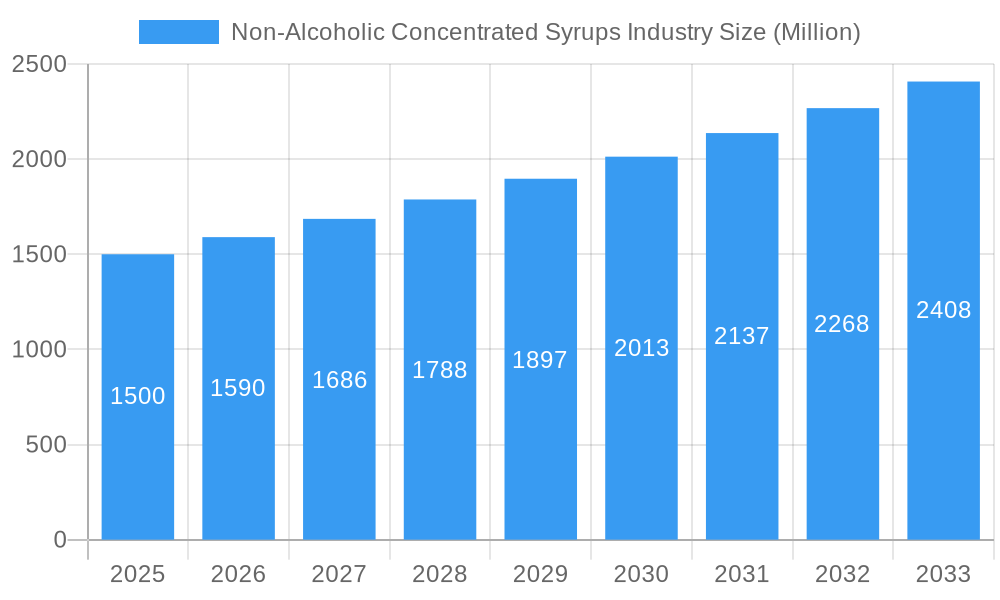
The global non-alcoholic concentrated syrups market, projected at $10.97 billion in 2025, is anticipated to grow at a CAGR of 14.17% from 2025 to 2033. This robust expansion is driven by several key factors, including the escalating consumer preference for convenient and healthier beverage choices over traditional sugary drinks. The inherent versatility of concentrated syrups, enabling personalized flavor creation and dilution, effectively addresses diverse market demands. Growth is further accelerated by the expanding food service sector, encompassing cafes, restaurants, and fast-food outlets that extensively utilize these syrups for their beverage portfolios. Additionally, continuous product innovation, such as the introduction of organic, functional, and novel flavor profiles, is fostering market diversification and attracting new consumer demographics. Challenges include price volatility of raw materials and increasing consumer focus on low-sugar alternatives. The market is segmented by type (fruit squashes, vegetable squashes, others) and sales channel (off-trade, on-trade). Geographically, North America, Europe, and Asia-Pacific represent strong markets, with South America and MEA showing significant growth potential.
Non-Alcoholic Concentrated Syrups Industry Market Size (In Billion)
Market segmentation reveals key consumer trends. Fruit squashes currently lead the market due to widespread consumer acceptance. However, vegetable squashes are expected to exhibit accelerated growth, driven by rising health awareness and demand for nutrient-rich alternatives. The on-trade channel is projected to remain influential, owing to its dependence on concentrated syrups for consistent beverage quality in the food service industry. Established markets in North America and Europe are complemented by significant growth opportunities in the Asia-Pacific region, fueled by rising disposable incomes and evolving beverage consumption patterns. Strategic partnerships, acquisitions, and ongoing product innovation will continue to define the competitive landscape. A thorough understanding of these market dynamics and consumer preferences is crucial for stakeholders in this evolving industry.
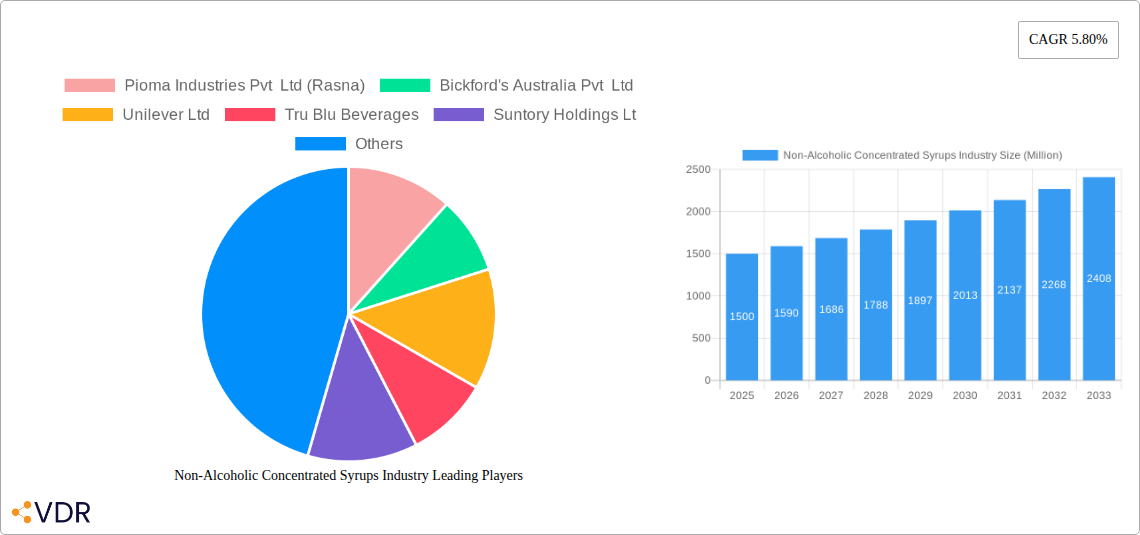
Non-Alcoholic Concentrated Syrups Industry Company Market Share
Non-Alcoholic Concentrated Syrups Industry Market Report: 2019-2033
This comprehensive report provides a detailed analysis of the Non-Alcoholic Concentrated Syrups industry, encompassing market dynamics, growth trends, regional dominance, product landscape, and future outlook. The study period covers 2019-2033, with a base year of 2025 and a forecast period of 2025-2033. The report offers invaluable insights for industry professionals, investors, and strategists seeking to navigate this dynamic market. Parent market: Beverage Industry, Child Market: Non-Alcoholic Beverages.
Non-Alcoholic Concentrated Syrups Industry Market Dynamics & Structure
This section analyzes the competitive landscape, technological advancements, regulatory influences, and market trends within the non-alcoholic concentrated syrups industry. We delve into market concentration, identifying key players and their market shares. The analysis includes an examination of M&A activity, highlighting significant deals and their impact on the market structure. Technological innovation drivers and barriers are assessed, considering factors such as R&D investment and regulatory approvals. The report also examines competitive product substitutes and their market penetration, alongside evolving end-user demographics and preferences.
- Market Concentration: The market is moderately concentrated, with the top five players holding approximately xx% market share in 2025.
- M&A Activity: A total of xx M&A deals were recorded between 2019 and 2024, with an average deal value of xx million.
- Technological Innovation: Key drivers include the development of natural and organic syrups, and innovative flavor profiles. Barriers include high R&D costs and stringent regulatory requirements.
- Regulatory Framework: Varying regulations across different regions impact product formulation and labeling.
- Competitive Substitutes: Ready-to-drink beverages and powdered mixes pose competitive challenges.
Non-Alcoholic Concentrated Syrups Industry Growth Trends & Insights
This section presents a comprehensive analysis of the non-alcoholic concentrated syrups market growth trajectory. Using extensive data analysis, the report projects market size evolution, adoption rates across various segments, and the influence of technological disruptions and shifting consumer behaviors. Key metrics, including CAGR and market penetration rates, are presented to provide in-depth insights into market dynamics. The forecast reveals substantial growth driven by factors like increasing demand for convenient and flavorful beverages, coupled with rising disposable incomes in developing economies. The report also highlights the impact of health and wellness trends on consumer preference and market segmentation. We examine specific trends like the growing preference for natural and organic ingredients and the impact of these trends on market share across different product types. Detailed analysis of consumer behavior, including purchasing patterns and brand loyalty, provides valuable insights for strategic decision-making. The impact of e-commerce and online retail on distribution channels and market reach is also examined.
Dominant Regions, Countries, or Segments in Non-Alcoholic Concentrated Syrups Industry
This section identifies the leading regions, countries, and segments within the non-alcoholic concentrated syrups market driving overall growth. We analyze dominance factors, considering market share, growth potential, and key drivers such as economic policies and infrastructure development. The analysis focuses on:
Type: Fruit squashes currently dominate the market, holding an xx% market share in 2025, followed by other types (xx%) and vegetable squashes (xx%). Growth is projected to be highest in the other types segment, driven by innovation in flavors and ingredients.
Sales Channel: The off-trade channel (e.g., supermarkets, retail stores) accounts for a significant portion (xx%) of the market, with the on-trade (e.g., restaurants, cafes) showing steady growth.
Region: Asia-Pacific is expected to be the leading region, with a xx% market share in 2025, driven by increasing demand and strong economic growth. Specific countries contributing significantly include India and China.
Key Drivers: Rising disposable incomes, changing lifestyles, and expanding retail infrastructure contribute to market growth in key regions.
Non-Alcoholic Concentrated Syrups Industry Product Landscape
This section details the innovative product offerings, applications, and performance metrics within the non-alcoholic concentrated syrups market. We analyze unique selling propositions (USPs) and technological advancements that shape product differentiation and consumer appeal. The increasing demand for healthier and more natural options has spurred the development of syrups with reduced sugar content, organic ingredients, and unique flavor profiles. The use of sustainable packaging materials is also gaining traction, reflecting broader industry trends towards environmentally conscious practices. The report explores the functional aspects of different syrups, highlighting their suitability for various applications, including ready-to-drink beverages, desserts, and culinary uses.
Key Drivers, Barriers & Challenges in Non-Alcoholic Concentrated Syrups Industry
Key Drivers: Increasing consumer demand for convenient and flavorful beverages, coupled with the rising popularity of homemade drinks, are major drivers. Health and wellness trends, such as the demand for natural and organic ingredients, also propel market growth. Furthermore, continuous product innovation, including new flavors and functional benefits, fuels market expansion.
Key Challenges: Fluctuations in raw material prices, stringent regulatory requirements for food and beverage products, and intense competition from established players and new entrants present significant challenges. Supply chain disruptions, particularly related to sourcing raw materials, can also impact production and profitability.
Emerging Opportunities in Non-Alcoholic Concentrated Syrups Industry
Emerging opportunities in the non-alcoholic concentrated syrups market stem from evolving consumer preferences and technological advancements. The rising demand for functional beverages, offering health benefits beyond taste, opens avenues for innovative product development. Expanding into untapped markets in developing economies, where demand for affordable and convenient beverages is growing, presents significant potential. Strategic partnerships with foodservice providers and retailers can facilitate market penetration and brand visibility.
Growth Accelerators in the Non-Alcoholic Concentrated Syrups Industry Industry
Long-term growth in the non-alcoholic concentrated syrups industry is fueled by several key factors. Technological advancements in flavor creation and ingredient sourcing allow for greater product differentiation. Strategic collaborations among manufacturers, distributors, and retailers enhance supply chain efficiency and market reach. The expansion into new geographic markets and the introduction of innovative product formats, such as single-serve pouches and sustainable packaging, further contribute to sustained growth.
Key Players Shaping the Non-Alcoholic Concentrated Syrups Industry Market
- Pioma Industries Pvt Ltd (Rasna)
- Bickford's Australia Pvt Ltd
- Unilever Ltd
- Tru Blu Beverages
- Suntory Holdings Lt
- Britvic PLC
- Golden Circle Ltd
Notable Milestones in Non-Alcoholic Concentrated Syrups Industry Sector
- 2020-Q3: Unilever launched a new line of organic fruit squashes.
- 2021-Q1: Britvic PLC acquired a smaller syrup manufacturer, expanding its market share.
- 2022-Q4: Rasna introduced a range of sugar-free syrups targeting health-conscious consumers. (Further milestones can be added here as data becomes available).
In-Depth Non-Alcoholic Concentrated Syrups Industry Market Outlook
The non-alcoholic concentrated syrups market exhibits significant growth potential, driven by the ongoing demand for convenient and flavorful beverages. Strategic opportunities exist in the development of premium and functional syrups catering to specific health and wellness needs. Expansion into emerging markets and the adoption of sustainable practices present further avenues for growth. The focus on innovation, strategic partnerships, and efficient supply chain management will be crucial for success in this dynamic market.
Non-Alcoholic Concentrated Syrups Industry Segmentation
-
1. Type
- 1.1. Fruit Squashes
- 1.2. Vegetable Squashes
- 1.3. Other Types
-
2. Sales Channel
- 2.1. Off-trade
- 2.2. On-trade
Non-Alcoholic Concentrated Syrups Industry Segmentation By Geography
-
1. North America
- 1.1. United States
- 1.2. Canada
- 1.3. Mexico
- 1.4. Rest of North America
-
2. Europe
- 2.1. Spain
- 2.2. United Kingdom
- 2.3. Germany
- 2.4. France
- 2.5. Italy
- 2.6. Russia
- 2.7. Rest of Europe
-
3. Asia Pacific
- 3.1. China
- 3.2. Japan
- 3.3. India
- 3.4. Australia
- 3.5. Rest of Asia Pacific
-
4. Rest of the World
- 4.1. South America
- 4.2. Middle East
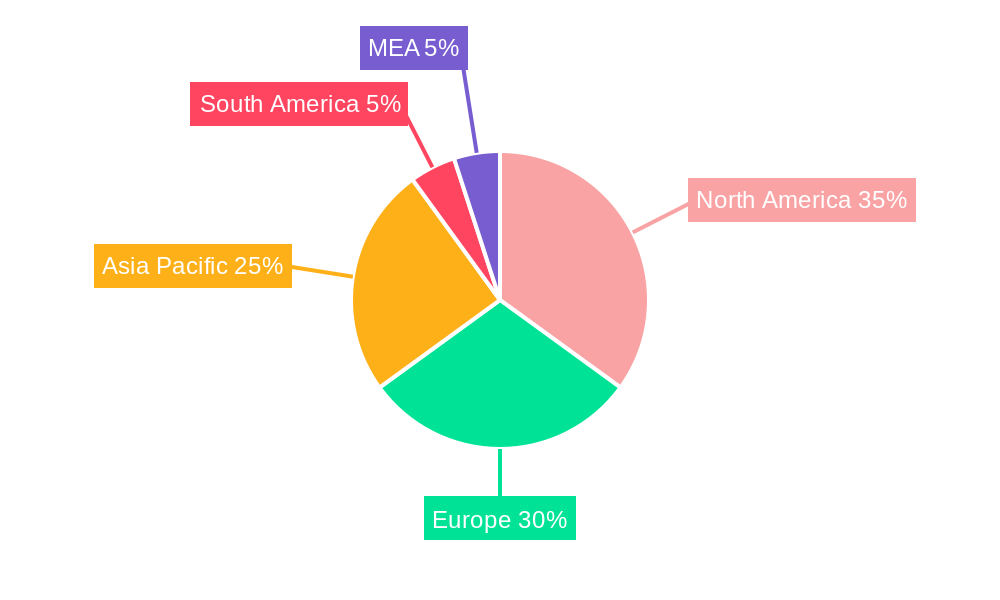
Non-Alcoholic Concentrated Syrups Industry Regional Market Share
Geographic Coverage of Non-Alcoholic Concentrated Syrups Industry
Non-Alcoholic Concentrated Syrups Industry REPORT HIGHLIGHTS
| Aspects | Details |
|---|---|
| Study Period | 2020-2034 |
| Base Year | 2025 |
| Estimated Year | 2026 |
| Forecast Period | 2026-2034 |
| Historical Period | 2020-2025 |
| Growth Rate | CAGR of 14.17% from 2020-2034 |
| Segmentation |
|
Table of Contents
- 1. Introduction
- 1.1. Research Scope
- 1.2. Market Segmentation
- 1.3. Research Objective
- 1.4. Definitions and Assumptions
- 2. Executive Summary
- 2.1. Market Snapshot
- 3. Market Dynamics
- 3.1. Market Drivers
- 3.2. Market Restrains
- 3.3. Market Trends
- 3.4. Market Opportunities
- 4. Market Factor Analysis
- 4.1. Porters Five Forces
- 4.1.1. Bargaining Power of Suppliers
- 4.1.2. Bargaining Power of Buyers
- 4.1.3. Threat of New Entrants
- 4.1.4. Threat of Substitutes
- 4.1.5. Competitive Rivalry
- 4.2. PESTEL analysis
- 4.3. BCG Analysis
- 4.3.1. Stars (High Growth, High Market Share)
- 4.3.2. Cash Cows (Low Growth, High Market Share)
- 4.3.3. Question Mark (High Growth, Low Market Share)
- 4.3.4. Dogs (Low Growth, Low Market Share)
- 4.4. Ansoff Matrix Analysis
- 4.5. Supply Chain Analysis
- 4.6. Regulatory Landscape
- 4.7. Current Market Potential and Opportunity Assessment (TAM–SAM–SOM Framework)
- 4.8. VDR Analyst Note
- 4.1. Porters Five Forces
- 5. Market Analysis, Insights and Forecast 2021-2033
- 5.1. Market Analysis, Insights and Forecast - by Type
- 5.1.1. Fruit Squashes
- 5.1.2. Vegetable Squashes
- 5.1.3. Other Types
- 5.2. Market Analysis, Insights and Forecast - by Sales Channel
- 5.2.1. Off-trade
- 5.2.2. On-trade
- 5.3. Market Analysis, Insights and Forecast - by Region
- 5.3.1. North America
- 5.3.2. Europe
- 5.3.3. Asia Pacific
- 5.3.4. Rest of the World
- 5.1. Market Analysis, Insights and Forecast - by Type
- 6. Global Non-Alcoholic Concentrated Syrups Industry Analysis, Insights and Forecast, 2021-2033
- 6.1. Market Analysis, Insights and Forecast - by Type
- 6.1.1. Fruit Squashes
- 6.1.2. Vegetable Squashes
- 6.1.3. Other Types
- 6.2. Market Analysis, Insights and Forecast - by Sales Channel
- 6.2.1. Off-trade
- 6.2.2. On-trade
- 6.1. Market Analysis, Insights and Forecast - by Type
- 7. North America Non-Alcoholic Concentrated Syrups Industry Analysis, Insights and Forecast, 2021-2033
- 7.1. Market Analysis, Insights and Forecast - by Type
- 7.1.1. Fruit Squashes
- 7.1.2. Vegetable Squashes
- 7.1.3. Other Types
- 7.2. Market Analysis, Insights and Forecast - by Sales Channel
- 7.2.1. Off-trade
- 7.2.2. On-trade
- 7.1. Market Analysis, Insights and Forecast - by Type
- 8. Europe Non-Alcoholic Concentrated Syrups Industry Analysis, Insights and Forecast, 2021-2033
- 8.1. Market Analysis, Insights and Forecast - by Type
- 8.1.1. Fruit Squashes
- 8.1.2. Vegetable Squashes
- 8.1.3. Other Types
- 8.2. Market Analysis, Insights and Forecast - by Sales Channel
- 8.2.1. Off-trade
- 8.2.2. On-trade
- 8.1. Market Analysis, Insights and Forecast - by Type
- 9. Asia Pacific Non-Alcoholic Concentrated Syrups Industry Analysis, Insights and Forecast, 2021-2033
- 9.1. Market Analysis, Insights and Forecast - by Type
- 9.1.1. Fruit Squashes
- 9.1.2. Vegetable Squashes
- 9.1.3. Other Types
- 9.2. Market Analysis, Insights and Forecast - by Sales Channel
- 9.2.1. Off-trade
- 9.2.2. On-trade
- 9.1. Market Analysis, Insights and Forecast - by Type
- 10. Rest of the World Non-Alcoholic Concentrated Syrups Industry Analysis, Insights and Forecast, 2021-2033
- 10.1. Market Analysis, Insights and Forecast - by Type
- 10.1.1. Fruit Squashes
- 10.1.2. Vegetable Squashes
- 10.1.3. Other Types
- 10.2. Market Analysis, Insights and Forecast - by Sales Channel
- 10.2.1. Off-trade
- 10.2.2. On-trade
- 10.1. Market Analysis, Insights and Forecast - by Type
- 11. Competitive Analysis
- 11.1. Company Profiles
- 11.1.1 Pioma Industries Pvt Ltd (Rasna)
- 11.1.1.1. Company Overview
- 11.1.1.2. Products
- 11.1.1.3. Company Financials
- 11.1.1.4. SWOT Analysis
- 11.1.2 Bickford's Australia Pvt Ltd
- 11.1.2.1. Company Overview
- 11.1.2.2. Products
- 11.1.2.3. Company Financials
- 11.1.2.4. SWOT Analysis
- 11.1.3 Unilever Ltd
- 11.1.3.1. Company Overview
- 11.1.3.2. Products
- 11.1.3.3. Company Financials
- 11.1.3.4. SWOT Analysis
- 11.1.4 Tru Blu Beverages
- 11.1.4.1. Company Overview
- 11.1.4.2. Products
- 11.1.4.3. Company Financials
- 11.1.4.4. SWOT Analysis
- 11.1.5 Suntory Holdings Lt
- 11.1.5.1. Company Overview
- 11.1.5.2. Products
- 11.1.5.3. Company Financials
- 11.1.5.4. SWOT Analysis
- 11.1.6 Britvic PLC
- 11.1.6.1. Company Overview
- 11.1.6.2. Products
- 11.1.6.3. Company Financials
- 11.1.6.4. SWOT Analysis
- 11.1.7 Golden Circle Ltd
- 11.1.7.1. Company Overview
- 11.1.7.2. Products
- 11.1.7.3. Company Financials
- 11.1.7.4. SWOT Analysis
- 11.1.1 Pioma Industries Pvt Ltd (Rasna)
- 11.2. Market Entropy
- 11.2.1 Company's Key Areas Served
- 11.2.2 Recent Developments
- 11.3. Company Market Share Analysis 2025
- 11.3.1 Top 5 Companies Market Share Analysis
- 11.3.2 Top 3 Companies Market Share Analysis
- 11.4. List of Potential Customers
- 12. Research Methodology
List of Figures
- Figure 1: Global Non-Alcoholic Concentrated Syrups Industry Revenue Breakdown (billion, %) by Region 2025 & 2033
- Figure 2: North America Non-Alcoholic Concentrated Syrups Industry Revenue (billion), by Type 2025 & 2033
- Figure 3: North America Non-Alcoholic Concentrated Syrups Industry Revenue Share (%), by Type 2025 & 2033
- Figure 4: North America Non-Alcoholic Concentrated Syrups Industry Revenue (billion), by Sales Channel 2025 & 2033
- Figure 5: North America Non-Alcoholic Concentrated Syrups Industry Revenue Share (%), by Sales Channel 2025 & 2033
- Figure 6: North America Non-Alcoholic Concentrated Syrups Industry Revenue (billion), by Country 2025 & 2033
- Figure 7: North America Non-Alcoholic Concentrated Syrups Industry Revenue Share (%), by Country 2025 & 2033
- Figure 8: Europe Non-Alcoholic Concentrated Syrups Industry Revenue (billion), by Type 2025 & 2033
- Figure 9: Europe Non-Alcoholic Concentrated Syrups Industry Revenue Share (%), by Type 2025 & 2033
- Figure 10: Europe Non-Alcoholic Concentrated Syrups Industry Revenue (billion), by Sales Channel 2025 & 2033
- Figure 11: Europe Non-Alcoholic Concentrated Syrups Industry Revenue Share (%), by Sales Channel 2025 & 2033
- Figure 12: Europe Non-Alcoholic Concentrated Syrups Industry Revenue (billion), by Country 2025 & 2033
- Figure 13: Europe Non-Alcoholic Concentrated Syrups Industry Revenue Share (%), by Country 2025 & 2033
- Figure 14: Asia Pacific Non-Alcoholic Concentrated Syrups Industry Revenue (billion), by Type 2025 & 2033
- Figure 15: Asia Pacific Non-Alcoholic Concentrated Syrups Industry Revenue Share (%), by Type 2025 & 2033
- Figure 16: Asia Pacific Non-Alcoholic Concentrated Syrups Industry Revenue (billion), by Sales Channel 2025 & 2033
- Figure 17: Asia Pacific Non-Alcoholic Concentrated Syrups Industry Revenue Share (%), by Sales Channel 2025 & 2033
- Figure 18: Asia Pacific Non-Alcoholic Concentrated Syrups Industry Revenue (billion), by Country 2025 & 2033
- Figure 19: Asia Pacific Non-Alcoholic Concentrated Syrups Industry Revenue Share (%), by Country 2025 & 2033
- Figure 20: Rest of the World Non-Alcoholic Concentrated Syrups Industry Revenue (billion), by Type 2025 & 2033
- Figure 21: Rest of the World Non-Alcoholic Concentrated Syrups Industry Revenue Share (%), by Type 2025 & 2033
- Figure 22: Rest of the World Non-Alcoholic Concentrated Syrups Industry Revenue (billion), by Sales Channel 2025 & 2033
- Figure 23: Rest of the World Non-Alcoholic Concentrated Syrups Industry Revenue Share (%), by Sales Channel 2025 & 2033
- Figure 24: Rest of the World Non-Alcoholic Concentrated Syrups Industry Revenue (billion), by Country 2025 & 2033
- Figure 25: Rest of the World Non-Alcoholic Concentrated Syrups Industry Revenue Share (%), by Country 2025 & 2033
List of Tables
- Table 1: Global Non-Alcoholic Concentrated Syrups Industry Revenue billion Forecast, by Type 2020 & 2033
- Table 2: Global Non-Alcoholic Concentrated Syrups Industry Revenue billion Forecast, by Sales Channel 2020 & 2033
- Table 3: Global Non-Alcoholic Concentrated Syrups Industry Revenue billion Forecast, by Region 2020 & 2033
- Table 4: Global Non-Alcoholic Concentrated Syrups Industry Revenue billion Forecast, by Type 2020 & 2033
- Table 5: Global Non-Alcoholic Concentrated Syrups Industry Revenue billion Forecast, by Sales Channel 2020 & 2033
- Table 6: Global Non-Alcoholic Concentrated Syrups Industry Revenue billion Forecast, by Country 2020 & 2033
- Table 7: United States Non-Alcoholic Concentrated Syrups Industry Revenue (billion) Forecast, by Application 2020 & 2033
- Table 8: Canada Non-Alcoholic Concentrated Syrups Industry Revenue (billion) Forecast, by Application 2020 & 2033
- Table 9: Mexico Non-Alcoholic Concentrated Syrups Industry Revenue (billion) Forecast, by Application 2020 & 2033
- Table 10: Rest of North America Non-Alcoholic Concentrated Syrups Industry Revenue (billion) Forecast, by Application 2020 & 2033
- Table 11: Global Non-Alcoholic Concentrated Syrups Industry Revenue billion Forecast, by Type 2020 & 2033
- Table 12: Global Non-Alcoholic Concentrated Syrups Industry Revenue billion Forecast, by Sales Channel 2020 & 2033
- Table 13: Global Non-Alcoholic Concentrated Syrups Industry Revenue billion Forecast, by Country 2020 & 2033
- Table 14: Spain Non-Alcoholic Concentrated Syrups Industry Revenue (billion) Forecast, by Application 2020 & 2033
- Table 15: United Kingdom Non-Alcoholic Concentrated Syrups Industry Revenue (billion) Forecast, by Application 2020 & 2033
- Table 16: Germany Non-Alcoholic Concentrated Syrups Industry Revenue (billion) Forecast, by Application 2020 & 2033
- Table 17: France Non-Alcoholic Concentrated Syrups Industry Revenue (billion) Forecast, by Application 2020 & 2033
- Table 18: Italy Non-Alcoholic Concentrated Syrups Industry Revenue (billion) Forecast, by Application 2020 & 2033
- Table 19: Russia Non-Alcoholic Concentrated Syrups Industry Revenue (billion) Forecast, by Application 2020 & 2033
- Table 20: Rest of Europe Non-Alcoholic Concentrated Syrups Industry Revenue (billion) Forecast, by Application 2020 & 2033
- Table 21: Global Non-Alcoholic Concentrated Syrups Industry Revenue billion Forecast, by Type 2020 & 2033
- Table 22: Global Non-Alcoholic Concentrated Syrups Industry Revenue billion Forecast, by Sales Channel 2020 & 2033
- Table 23: Global Non-Alcoholic Concentrated Syrups Industry Revenue billion Forecast, by Country 2020 & 2033
- Table 24: China Non-Alcoholic Concentrated Syrups Industry Revenue (billion) Forecast, by Application 2020 & 2033
- Table 25: Japan Non-Alcoholic Concentrated Syrups Industry Revenue (billion) Forecast, by Application 2020 & 2033
- Table 26: India Non-Alcoholic Concentrated Syrups Industry Revenue (billion) Forecast, by Application 2020 & 2033
- Table 27: Australia Non-Alcoholic Concentrated Syrups Industry Revenue (billion) Forecast, by Application 2020 & 2033
- Table 28: Rest of Asia Pacific Non-Alcoholic Concentrated Syrups Industry Revenue (billion) Forecast, by Application 2020 & 2033
- Table 29: Global Non-Alcoholic Concentrated Syrups Industry Revenue billion Forecast, by Type 2020 & 2033
- Table 30: Global Non-Alcoholic Concentrated Syrups Industry Revenue billion Forecast, by Sales Channel 2020 & 2033
- Table 31: Global Non-Alcoholic Concentrated Syrups Industry Revenue billion Forecast, by Country 2020 & 2033
- Table 32: South America Non-Alcoholic Concentrated Syrups Industry Revenue (billion) Forecast, by Application 2020 & 2033
- Table 33: Middle East Non-Alcoholic Concentrated Syrups Industry Revenue (billion) Forecast, by Application 2020 & 2033
Frequently Asked Questions
1. What is the projected Compound Annual Growth Rate (CAGR) of the Non-Alcoholic Concentrated Syrups Industry?
The projected CAGR is approximately 14.17%.
2. Which companies are prominent players in the Non-Alcoholic Concentrated Syrups Industry?
Key companies in the market include Pioma Industries Pvt Ltd (Rasna), Bickford's Australia Pvt Ltd, Unilever Ltd, Tru Blu Beverages, Suntory Holdings Lt, Britvic PLC, Golden Circle Ltd.
3. What are the main segments of the Non-Alcoholic Concentrated Syrups Industry?
The market segments include Type, Sales Channel.
4. Can you provide details about the market size?
The market size is estimated to be USD 10.97 billion as of 2022.
5. What are some drivers contributing to market growth?
The ease of use and long shelf life of concentrated syrups make them popular for both commercial use and at-home preparation of beverages..
6. What are the notable trends driving market growth?
Increasing interest in syrups made with natural ingredients. reduced sugar content. and organic certifications to cater to health-conscious consumers.
7. Are there any restraints impacting market growth?
Some consumers may be wary of concentrated syrups due to concerns about high sugar content and artificial ingredients. which can affect market growth.
8. Can you provide examples of recent developments in the market?
N/A
9. What pricing options are available for accessing the report?
Pricing options include single-user, multi-user, and enterprise licenses priced at USD 4750, USD 5250, and USD 8750 respectively.
10. Is the market size provided in terms of value or volume?
The market size is provided in terms of value, measured in billion.
11. Are there any specific market keywords associated with the report?
Yes, the market keyword associated with the report is "Non-Alcoholic Concentrated Syrups Industry," which aids in identifying and referencing the specific market segment covered.
12. How do I determine which pricing option suits my needs best?
The pricing options vary based on user requirements and access needs. Individual users may opt for single-user licenses, while businesses requiring broader access may choose multi-user or enterprise licenses for cost-effective access to the report.
13. Are there any additional resources or data provided in the Non-Alcoholic Concentrated Syrups Industry report?
While the report offers comprehensive insights, it's advisable to review the specific contents or supplementary materials provided to ascertain if additional resources or data are available.
14. How can I stay updated on further developments or reports in the Non-Alcoholic Concentrated Syrups Industry?
To stay informed about further developments, trends, and reports in the Non-Alcoholic Concentrated Syrups Industry, consider subscribing to industry newsletters, following relevant companies and organizations, or regularly checking reputable industry news sources and publications.
Methodology
Step 1 - Identification of Relevant Samples Size from Population Database


Step 2 - Approaches for Defining Global Market Size (Value, Volume* & Price*)

Note*: In applicable scenarios
Step 3 - Data Sources
Primary Research
- Web Analytics
- Survey Reports
- Research Institute
- Latest Research Reports
- Opinion Leaders
Secondary Research
- Annual Reports
- White Paper
- Latest Press Release
- Industry Association
- Paid Database
- Investor Presentations

Step 4 - Data Triangulation
Involves using different sources of information in order to increase the validity of a study
These sources are likely to be stakeholders in a program - participants, other researchers, program staff, other community members, and so on.
Then we put all data in single framework & apply various statistical tools to find out the dynamic on the market.
During the analysis stage, feedback from the stakeholder groups would be compared to determine areas of agreement as well as areas of divergence