

Key Insights
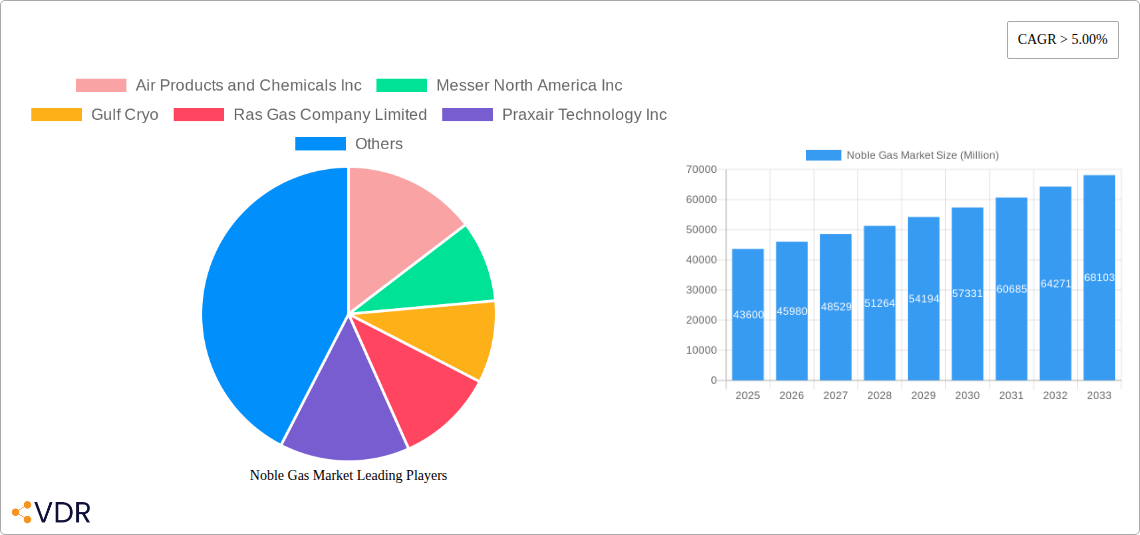
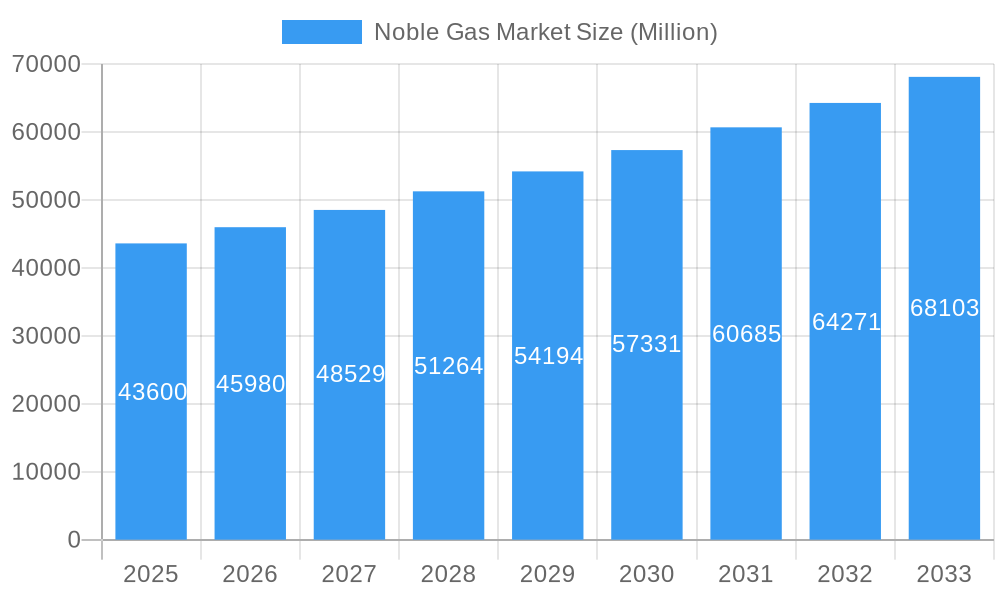
The global noble gas market, valued at $43,600 million in 2025, is projected to experience robust growth, exhibiting a Compound Annual Growth Rate (CAGR) exceeding 5% from 2025 to 2033. This expansion is driven by increasing demand across diverse sectors. The healthcare industry, particularly in anesthesia and medical imaging, is a significant driver, fueled by rising healthcare expenditure and technological advancements. Simultaneously, the burgeoning oil and gas exploration and production sector relies heavily on noble gases for various applications, including enhanced oil recovery and leak detection. The electronics and lighting industries also contribute significantly, with noble gases playing a crucial role in producing energy-efficient lighting solutions and advanced display technologies. Growth is further stimulated by increasing industrial automation and the adoption of advanced manufacturing techniques across various sectors. However, the market faces constraints such as price volatility influenced by supply chain dynamics and the environmental impact of certain extraction and purification processes. Technological advancements in gas separation and purification techniques are expected to alleviate some of these challenges. Regional variations in market growth will be influenced by economic conditions, regulatory landscapes, and the pace of technological adoption. Asia-Pacific, led by China and India, is anticipated to showcase significant growth due to rapid industrialization and rising disposable incomes. North America and Europe are also expected to maintain substantial market shares, driven by ongoing research and development in the field and increasing awareness about the diverse applications of noble gases.
Noble Gas Market Market Size (In Billion)
The segmentation of the noble gas market reveals diverse application areas. Helium, with its unique properties, is extensively utilized in MRI machines and cryogenic applications, while argon finds extensive use in welding and industrial processes. Neon's dominance in lighting applications continues, and krypton and xenon are increasingly employed in specialized lighting and laser technologies. The radioactive radon segment, although smaller, holds significance in niche applications in scientific research. End-user industries, such as healthcare, aerospace, energy, and construction, are key contributors to market growth. The competitive landscape is characterized by both large multinational corporations and specialized regional players, highlighting opportunities for innovation, strategic partnerships, and further market penetration.
Noble Gas Market Company Market Share
Noble Gas Market: A Comprehensive Market Report (2019-2033)
This comprehensive report provides a detailed analysis of the global Noble Gas market, encompassing its dynamics, growth trends, leading players, and future outlook. From the parent market of industrial gases to the child market segments of helium, argon, and neon, this study offers invaluable insights for industry professionals, investors, and strategists seeking to navigate this dynamic sector. The report covers the period 2019-2033, with a focus on the forecast period 2025-2033 and a base year of 2025. The market size is presented in million units.
Noble Gas Market Dynamics & Structure
The noble gas market is characterized by moderate concentration, with several large multinational corporations holding significant market share. Technological innovation, particularly in helium purification and liquefaction, plays a crucial role. Stringent regulatory frameworks concerning the handling and transportation of noble gases, especially radioactive radon, influence market operations. Competition from alternative materials and technologies in specific applications is also a factor. The end-user demographics are diverse, spanning various industries. M&A activity is moderate, reflecting consolidation efforts within the sector.
- Market Concentration: High (xx%), dominated by a few major players.
- Technological Innovation: Focus on energy-efficient purification and liquefaction processes.
- Regulatory Framework: Stringent safety and environmental regulations, particularly for radon.
- Competitive Substitutes: Emergence of alternative materials in specific applications (e.g., LED lighting reducing neon demand).
- End-user Demographics: Diverse, with significant presence in healthcare, aerospace, and industrial sectors.
- M&A Trends: Moderate level of mergers and acquisitions, driven by consolidation and expansion strategies. (xx number of deals in the past 5 years).
Noble Gas Market Growth Trends & Insights
The global noble gas market exhibited a CAGR of xx% during the historical period (2019-2024) and is projected to grow at a CAGR of xx% during the forecast period (2025-2033), reaching a market size of xx million units by 2033. This growth is driven by increasing demand from various end-use industries, particularly in healthcare (medical imaging and anesthesia) and industrial applications (welding, refrigeration). Technological advancements, such as improved purification techniques and the development of more efficient delivery systems, are also contributing to market expansion. Shifting consumer preferences towards advanced technologies and rising disposable incomes in developing economies are further influencing market adoption rates. However, price volatility and supply chain constraints for certain noble gases, especially helium, present challenges to consistent growth.
Dominant Regions, Countries, or Segments in Noble Gas Market
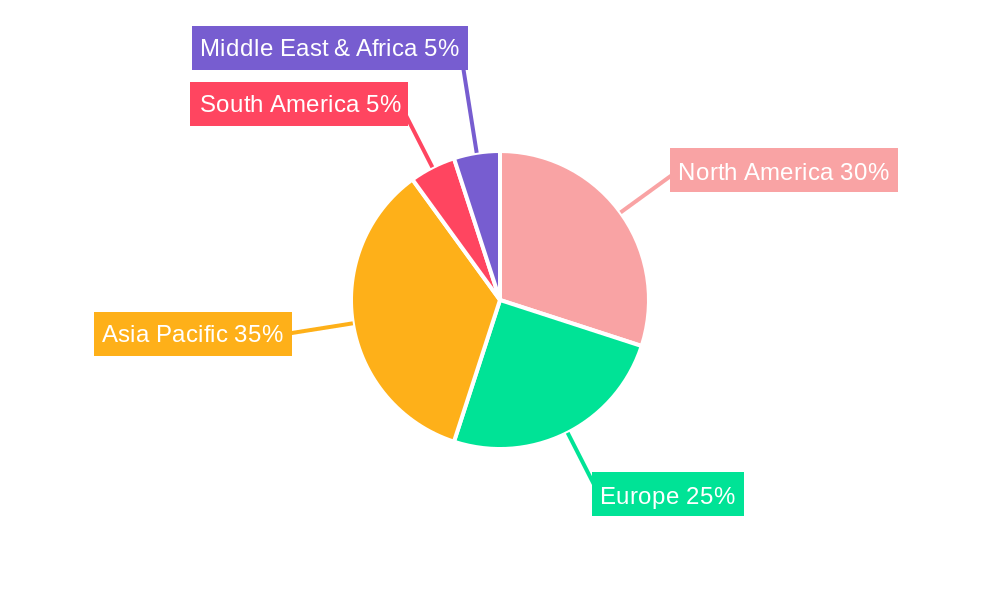
North America currently holds the largest market share in the noble gas market, driven by strong demand from the aerospace and healthcare sectors. Within the types of noble gases, Helium dominates the market in terms of volume and value, followed by Argon. In terms of applications, the welding segment exhibits the strongest growth, followed by medical applications. Key drivers for regional dominance include established industrial infrastructure, strong regulatory frameworks supporting innovation, and substantial investment in R&D.
- Leading Region: North America (Market share: xx%)
- Leading Type: Helium (Market share: xx%)
- Leading Application: Welding (Market share: xx%)
- Key Drivers: Strong industrial base, technological advancements, favorable government policies.
Noble Gas Market Product Landscape
Noble gas products are increasingly characterized by higher purity levels and improved efficiency in various applications. The market offers a range of products, from high-purity gases for specialized applications to gas mixtures tailored for specific industrial processes. Significant innovations include advanced purification techniques and improved delivery systems (e.g., cryogenic tanks and pipelines) that enhance safety, reduce costs, and improve overall performance. Unique selling propositions focus on product purity, efficient delivery methods, and specialized gas mixtures for niche applications.
Key Drivers, Barriers & Challenges in Noble Gas Market
Key Drivers: Increasing demand from diverse industries (e.g., healthcare, aerospace, electronics); technological advancements leading to higher efficiency and purity; supportive government policies promoting innovation and industrial development.
Key Challenges: Price volatility of certain noble gases (especially helium); supply chain constraints and geopolitical factors affecting availability; stringent environmental regulations and safety standards; increasing competition from substitute technologies. (e.g., xx% increase in helium prices in 2022 impacting market growth).
Emerging Opportunities in Noble Gas Market
Emerging opportunities lie in the expansion into developing economies, the exploration of novel applications in emerging technologies (e.g., quantum computing), and the development of sustainable and environmentally friendly noble gas production and utilization methods. The focus on improved gas recovery techniques and waste reduction presents significant opportunities.
Growth Accelerators in the Noble Gas Market Industry
Long-term growth will be accelerated by technological breakthroughs in purification and liquefaction, strategic collaborations among industry players, and expansion into new and emerging markets. Government initiatives supporting R&D and sustainable practices are key catalysts.
Key Players Shaping the Noble Gas Market Market
- Air Products and Chemicals Inc
- Messer North America Inc
- Gulf Cryo
- Ras Gas Company Limited
- Praxair Technology Inc
- BASF SE
- ITM Power
- Linde plc
- American Gas
- TAIYO NIPPON SANSO CORPORATION
- Royal Dutch Shell PLC
- Buzwair Industrial Gases Factories
- Air Liquide
- Airgas Inc
Notable Milestones in Noble Gas Market Sector
- April 2022: Linde signed an off-take agreement to recover helium from Freeport LNG's Texas production site and will construct a helium processing plant in the United States. This expands Linde's helium supply capacity and strengthens its position in the market.
- November 2022: Air Products secured USD 1.07 billion in contracts to supply 33 million liters of liquid helium to NASA's Kennedy Space Center. This signifies the crucial role of helium in aerospace applications and underscores Air Products' market leadership.
In-Depth Noble Gas Market Market Outlook
The noble gas market is poised for continued growth, driven by robust demand from diverse sectors and technological innovation. Strategic partnerships, investments in R&D, and expansion into emerging markets present significant opportunities for market players. Addressing the challenges of price volatility and sustainable sourcing will be crucial for long-term market stability and growth.
Noble Gas Market Segmentation
-
1. Type
- 1.1. Helium
- 1.2. Krypton
- 1.3. Argon
- 1.4. Neon
- 1.5. Xenon
- 1.6. Radioactive Radon
-
2. Application
- 2.1. Picture Projection
- 2.2. Anesthetic
- 2.3. Welding
- 2.4. Insulation
- 2.5. Lighting
- 2.6. Television Tubes
- 2.7. Advertising
- 2.8. Refrigerant
- 2.9. Working Fluid
- 2.10. Chemical Analysis
-
3. End-user Industry
- 3.1. Oil and Gas
- 3.2. Mining
- 3.3. Healthcare
- 3.4. Aerospace
- 3.5. Construction
- 3.6. Energy and Power
Noble Gas Market Segmentation By Geography
-
1. Asia Pacific
- 1.1. China
- 1.2. India
- 1.3. Japan
- 1.4. South Korea
- 1.5. Rest of Asia Pacific
-
2. North America
- 2.1. United States
- 2.2. Canada
- 2.3. Mexico
-
3. Europe
- 3.1. Germany
- 3.2. United Kingdom
- 3.3. Italy
- 3.4. France
- 3.5. Rest of Europe
-
4. South America
- 4.1. Brazil
- 4.2. Argentina
- 4.3. Rest of South America
- 5. Middle East
-
6. Saudi Arabia
- 6.1. South Africa
- 6.2. Rest of Middle East
Noble Gas Market Regional Market Share
Geographic Coverage of Noble Gas Market
Noble Gas Market REPORT HIGHLIGHTS
| Aspects | Details |
|---|---|
| Study Period | 2020-2034 |
| Base Year | 2025 |
| Estimated Year | 2026 |
| Forecast Period | 2026-2034 |
| Historical Period | 2020-2025 |
| Growth Rate | CAGR of > 5.00% from 2020-2034 |
| Segmentation |
|
Table of Contents
- 1. Introduction
- 1.1. Research Scope
- 1.2. Market Segmentation
- 1.3. Research Objective
- 1.4. Definitions and Assumptions
- 2. Executive Summary
- 2.1. Market Snapshot
- 3. Market Dynamics
- 3.1. Market Drivers
- 3.2. Market Restrains
- 3.3. Market Trends
- 3.4. Market Opportunities
- 4. Market Factor Analysis
- 4.1. Porters Five Forces
- 4.1.1. Bargaining Power of Suppliers
- 4.1.2. Bargaining Power of Buyers
- 4.1.3. Threat of New Entrants
- 4.1.4. Threat of Substitutes
- 4.1.5. Competitive Rivalry
- 4.2. PESTEL analysis
- 4.3. BCG Analysis
- 4.3.1. Stars (High Growth, High Market Share)
- 4.3.2. Cash Cows (Low Growth, High Market Share)
- 4.3.3. Question Mark (High Growth, Low Market Share)
- 4.3.4. Dogs (Low Growth, Low Market Share)
- 4.4. Ansoff Matrix Analysis
- 4.5. Supply Chain Analysis
- 4.6. Regulatory Landscape
- 4.7. Current Market Potential and Opportunity Assessment (TAM–SAM–SOM Framework)
- 4.8. VDR Analyst Note
- 4.1. Porters Five Forces
- 5. Market Analysis, Insights and Forecast 2021-2033
- 5.1. Market Analysis, Insights and Forecast - by Type
- 5.1.1. Helium
- 5.1.2. Krypton
- 5.1.3. Argon
- 5.1.4. Neon
- 5.1.5. Xenon
- 5.1.6. Radioactive Radon
- 5.2. Market Analysis, Insights and Forecast - by Application
- 5.2.1. Picture Projection
- 5.2.2. Anesthetic
- 5.2.3. Welding
- 5.2.4. Insulation
- 5.2.5. Lighting
- 5.2.6. Television Tubes
- 5.2.7. Advertising
- 5.2.8. Refrigerant
- 5.2.9. Working Fluid
- 5.2.10. Chemical Analysis
- 5.3. Market Analysis, Insights and Forecast - by End-user Industry
- 5.3.1. Oil and Gas
- 5.3.2. Mining
- 5.3.3. Healthcare
- 5.3.4. Aerospace
- 5.3.5. Construction
- 5.3.6. Energy and Power
- 5.4. Market Analysis, Insights and Forecast - by Region
- 5.4.1. Asia Pacific
- 5.4.2. North America
- 5.4.3. Europe
- 5.4.4. South America
- 5.4.5. Middle East
- 5.4.6. Saudi Arabia
- 5.1. Market Analysis, Insights and Forecast - by Type
- 6. Global Noble Gas Market Analysis, Insights and Forecast, 2021-2033
- 6.1. Market Analysis, Insights and Forecast - by Type
- 6.1.1. Helium
- 6.1.2. Krypton
- 6.1.3. Argon
- 6.1.4. Neon
- 6.1.5. Xenon
- 6.1.6. Radioactive Radon
- 6.2. Market Analysis, Insights and Forecast - by Application
- 6.2.1. Picture Projection
- 6.2.2. Anesthetic
- 6.2.3. Welding
- 6.2.4. Insulation
- 6.2.5. Lighting
- 6.2.6. Television Tubes
- 6.2.7. Advertising
- 6.2.8. Refrigerant
- 6.2.9. Working Fluid
- 6.2.10. Chemical Analysis
- 6.3. Market Analysis, Insights and Forecast - by End-user Industry
- 6.3.1. Oil and Gas
- 6.3.2. Mining
- 6.3.3. Healthcare
- 6.3.4. Aerospace
- 6.3.5. Construction
- 6.3.6. Energy and Power
- 6.1. Market Analysis, Insights and Forecast - by Type
- 7. Asia Pacific Noble Gas Market Analysis, Insights and Forecast, 2021-2033
- 7.1. Market Analysis, Insights and Forecast - by Type
- 7.1.1. Helium
- 7.1.2. Krypton
- 7.1.3. Argon
- 7.1.4. Neon
- 7.1.5. Xenon
- 7.1.6. Radioactive Radon
- 7.2. Market Analysis, Insights and Forecast - by Application
- 7.2.1. Picture Projection
- 7.2.2. Anesthetic
- 7.2.3. Welding
- 7.2.4. Insulation
- 7.2.5. Lighting
- 7.2.6. Television Tubes
- 7.2.7. Advertising
- 7.2.8. Refrigerant
- 7.2.9. Working Fluid
- 7.2.10. Chemical Analysis
- 7.3. Market Analysis, Insights and Forecast - by End-user Industry
- 7.3.1. Oil and Gas
- 7.3.2. Mining
- 7.3.3. Healthcare
- 7.3.4. Aerospace
- 7.3.5. Construction
- 7.3.6. Energy and Power
- 7.1. Market Analysis, Insights and Forecast - by Type
- 8. North America Noble Gas Market Analysis, Insights and Forecast, 2021-2033
- 8.1. Market Analysis, Insights and Forecast - by Type
- 8.1.1. Helium
- 8.1.2. Krypton
- 8.1.3. Argon
- 8.1.4. Neon
- 8.1.5. Xenon
- 8.1.6. Radioactive Radon
- 8.2. Market Analysis, Insights and Forecast - by Application
- 8.2.1. Picture Projection
- 8.2.2. Anesthetic
- 8.2.3. Welding
- 8.2.4. Insulation
- 8.2.5. Lighting
- 8.2.6. Television Tubes
- 8.2.7. Advertising
- 8.2.8. Refrigerant
- 8.2.9. Working Fluid
- 8.2.10. Chemical Analysis
- 8.3. Market Analysis, Insights and Forecast - by End-user Industry
- 8.3.1. Oil and Gas
- 8.3.2. Mining
- 8.3.3. Healthcare
- 8.3.4. Aerospace
- 8.3.5. Construction
- 8.3.6. Energy and Power
- 8.1. Market Analysis, Insights and Forecast - by Type
- 9. Europe Noble Gas Market Analysis, Insights and Forecast, 2021-2033
- 9.1. Market Analysis, Insights and Forecast - by Type
- 9.1.1. Helium
- 9.1.2. Krypton
- 9.1.3. Argon
- 9.1.4. Neon
- 9.1.5. Xenon
- 9.1.6. Radioactive Radon
- 9.2. Market Analysis, Insights and Forecast - by Application
- 9.2.1. Picture Projection
- 9.2.2. Anesthetic
- 9.2.3. Welding
- 9.2.4. Insulation
- 9.2.5. Lighting
- 9.2.6. Television Tubes
- 9.2.7. Advertising
- 9.2.8. Refrigerant
- 9.2.9. Working Fluid
- 9.2.10. Chemical Analysis
- 9.3. Market Analysis, Insights and Forecast - by End-user Industry
- 9.3.1. Oil and Gas
- 9.3.2. Mining
- 9.3.3. Healthcare
- 9.3.4. Aerospace
- 9.3.5. Construction
- 9.3.6. Energy and Power
- 9.1. Market Analysis, Insights and Forecast - by Type
- 10. South America Noble Gas Market Analysis, Insights and Forecast, 2021-2033
- 10.1. Market Analysis, Insights and Forecast - by Type
- 10.1.1. Helium
- 10.1.2. Krypton
- 10.1.3. Argon
- 10.1.4. Neon
- 10.1.5. Xenon
- 10.1.6. Radioactive Radon
- 10.2. Market Analysis, Insights and Forecast - by Application
- 10.2.1. Picture Projection
- 10.2.2. Anesthetic
- 10.2.3. Welding
- 10.2.4. Insulation
- 10.2.5. Lighting
- 10.2.6. Television Tubes
- 10.2.7. Advertising
- 10.2.8. Refrigerant
- 10.2.9. Working Fluid
- 10.2.10. Chemical Analysis
- 10.3. Market Analysis, Insights and Forecast - by End-user Industry
- 10.3.1. Oil and Gas
- 10.3.2. Mining
- 10.3.3. Healthcare
- 10.3.4. Aerospace
- 10.3.5. Construction
- 10.3.6. Energy and Power
- 10.1. Market Analysis, Insights and Forecast - by Type
- 11. Middle East Noble Gas Market Analysis, Insights and Forecast, 2021-2033
- 11.1. Market Analysis, Insights and Forecast - by Type
- 11.1.1. Helium
- 11.1.2. Krypton
- 11.1.3. Argon
- 11.1.4. Neon
- 11.1.5. Xenon
- 11.1.6. Radioactive Radon
- 11.2. Market Analysis, Insights and Forecast - by Application
- 11.2.1. Picture Projection
- 11.2.2. Anesthetic
- 11.2.3. Welding
- 11.2.4. Insulation
- 11.2.5. Lighting
- 11.2.6. Television Tubes
- 11.2.7. Advertising
- 11.2.8. Refrigerant
- 11.2.9. Working Fluid
- 11.2.10. Chemical Analysis
- 11.3. Market Analysis, Insights and Forecast - by End-user Industry
- 11.3.1. Oil and Gas
- 11.3.2. Mining
- 11.3.3. Healthcare
- 11.3.4. Aerospace
- 11.3.5. Construction
- 11.3.6. Energy and Power
- 11.1. Market Analysis, Insights and Forecast - by Type
- 12. Saudi Arabia Noble Gas Market Analysis, Insights and Forecast, 2021-2033
- 12.1. Market Analysis, Insights and Forecast - by Type
- 12.1.1. Helium
- 12.1.2. Krypton
- 12.1.3. Argon
- 12.1.4. Neon
- 12.1.5. Xenon
- 12.1.6. Radioactive Radon
- 12.2. Market Analysis, Insights and Forecast - by Application
- 12.2.1. Picture Projection
- 12.2.2. Anesthetic
- 12.2.3. Welding
- 12.2.4. Insulation
- 12.2.5. Lighting
- 12.2.6. Television Tubes
- 12.2.7. Advertising
- 12.2.8. Refrigerant
- 12.2.9. Working Fluid
- 12.2.10. Chemical Analysis
- 12.3. Market Analysis, Insights and Forecast - by End-user Industry
- 12.3.1. Oil and Gas
- 12.3.2. Mining
- 12.3.3. Healthcare
- 12.3.4. Aerospace
- 12.3.5. Construction
- 12.3.6. Energy and Power
- 12.1. Market Analysis, Insights and Forecast - by Type
- 13. Competitive Analysis
- 13.1. Company Profiles
- 13.1.1 Air Products and Chemicals Inc
- 13.1.1.1. Company Overview
- 13.1.1.2. Products
- 13.1.1.3. Company Financials
- 13.1.1.4. SWOT Analysis
- 13.1.2 Messer North America Inc
- 13.1.2.1. Company Overview
- 13.1.2.2. Products
- 13.1.2.3. Company Financials
- 13.1.2.4. SWOT Analysis
- 13.1.3 Gulf Cryo
- 13.1.3.1. Company Overview
- 13.1.3.2. Products
- 13.1.3.3. Company Financials
- 13.1.3.4. SWOT Analysis
- 13.1.4 Ras Gas Company Limited
- 13.1.4.1. Company Overview
- 13.1.4.2. Products
- 13.1.4.3. Company Financials
- 13.1.4.4. SWOT Analysis
- 13.1.5 Praxair Technology Inc
- 13.1.5.1. Company Overview
- 13.1.5.2. Products
- 13.1.5.3. Company Financials
- 13.1.5.4. SWOT Analysis
- 13.1.6 BASF SE
- 13.1.6.1. Company Overview
- 13.1.6.2. Products
- 13.1.6.3. Company Financials
- 13.1.6.4. SWOT Analysis
- 13.1.7 ITM Power
- 13.1.7.1. Company Overview
- 13.1.7.2. Products
- 13.1.7.3. Company Financials
- 13.1.7.4. SWOT Analysis
- 13.1.8 Linde plc
- 13.1.8.1. Company Overview
- 13.1.8.2. Products
- 13.1.8.3. Company Financials
- 13.1.8.4. SWOT Analysis
- 13.1.9 American Gas
- 13.1.9.1. Company Overview
- 13.1.9.2. Products
- 13.1.9.3. Company Financials
- 13.1.9.4. SWOT Analysis
- 13.1.10 TAIYO NIPPON SANSO CORPORATION*List Not Exhaustive
- 13.1.10.1. Company Overview
- 13.1.10.2. Products
- 13.1.10.3. Company Financials
- 13.1.10.4. SWOT Analysis
- 13.1.11 Royal Dutch Shell PLC
- 13.1.11.1. Company Overview
- 13.1.11.2. Products
- 13.1.11.3. Company Financials
- 13.1.11.4. SWOT Analysis
- 13.1.12 Buzwair Industrial Gases Factories
- 13.1.12.1. Company Overview
- 13.1.12.2. Products
- 13.1.12.3. Company Financials
- 13.1.12.4. SWOT Analysis
- 13.1.13 Air Liquide
- 13.1.13.1. Company Overview
- 13.1.13.2. Products
- 13.1.13.3. Company Financials
- 13.1.13.4. SWOT Analysis
- 13.1.14 Airgas Inc
- 13.1.14.1. Company Overview
- 13.1.14.2. Products
- 13.1.14.3. Company Financials
- 13.1.14.4. SWOT Analysis
- 13.1.1 Air Products and Chemicals Inc
- 13.2. Market Entropy
- 13.2.1 Company's Key Areas Served
- 13.2.2 Recent Developments
- 13.3. Company Market Share Analysis 2025
- 13.3.1 Top 5 Companies Market Share Analysis
- 13.3.2 Top 3 Companies Market Share Analysis
- 13.4. List of Potential Customers
- 14. Research Methodology
List of Figures
- Figure 1: Global Noble Gas Market Revenue Breakdown (Million, %) by Region 2025 & 2033
- Figure 2: Global Noble Gas Market Volume Breakdown (K Tons, %) by Region 2025 & 2033
- Figure 3: Asia Pacific Noble Gas Market Revenue (Million), by Type 2025 & 2033
- Figure 4: Asia Pacific Noble Gas Market Volume (K Tons), by Type 2025 & 2033
- Figure 5: Asia Pacific Noble Gas Market Revenue Share (%), by Type 2025 & 2033
- Figure 6: Asia Pacific Noble Gas Market Volume Share (%), by Type 2025 & 2033
- Figure 7: Asia Pacific Noble Gas Market Revenue (Million), by Application 2025 & 2033
- Figure 8: Asia Pacific Noble Gas Market Volume (K Tons), by Application 2025 & 2033
- Figure 9: Asia Pacific Noble Gas Market Revenue Share (%), by Application 2025 & 2033
- Figure 10: Asia Pacific Noble Gas Market Volume Share (%), by Application 2025 & 2033
- Figure 11: Asia Pacific Noble Gas Market Revenue (Million), by End-user Industry 2025 & 2033
- Figure 12: Asia Pacific Noble Gas Market Volume (K Tons), by End-user Industry 2025 & 2033
- Figure 13: Asia Pacific Noble Gas Market Revenue Share (%), by End-user Industry 2025 & 2033
- Figure 14: Asia Pacific Noble Gas Market Volume Share (%), by End-user Industry 2025 & 2033
- Figure 15: Asia Pacific Noble Gas Market Revenue (Million), by Country 2025 & 2033
- Figure 16: Asia Pacific Noble Gas Market Volume (K Tons), by Country 2025 & 2033
- Figure 17: Asia Pacific Noble Gas Market Revenue Share (%), by Country 2025 & 2033
- Figure 18: Asia Pacific Noble Gas Market Volume Share (%), by Country 2025 & 2033
- Figure 19: North America Noble Gas Market Revenue (Million), by Type 2025 & 2033
- Figure 20: North America Noble Gas Market Volume (K Tons), by Type 2025 & 2033
- Figure 21: North America Noble Gas Market Revenue Share (%), by Type 2025 & 2033
- Figure 22: North America Noble Gas Market Volume Share (%), by Type 2025 & 2033
- Figure 23: North America Noble Gas Market Revenue (Million), by Application 2025 & 2033
- Figure 24: North America Noble Gas Market Volume (K Tons), by Application 2025 & 2033
- Figure 25: North America Noble Gas Market Revenue Share (%), by Application 2025 & 2033
- Figure 26: North America Noble Gas Market Volume Share (%), by Application 2025 & 2033
- Figure 27: North America Noble Gas Market Revenue (Million), by End-user Industry 2025 & 2033
- Figure 28: North America Noble Gas Market Volume (K Tons), by End-user Industry 2025 & 2033
- Figure 29: North America Noble Gas Market Revenue Share (%), by End-user Industry 2025 & 2033
- Figure 30: North America Noble Gas Market Volume Share (%), by End-user Industry 2025 & 2033
- Figure 31: North America Noble Gas Market Revenue (Million), by Country 2025 & 2033
- Figure 32: North America Noble Gas Market Volume (K Tons), by Country 2025 & 2033
- Figure 33: North America Noble Gas Market Revenue Share (%), by Country 2025 & 2033
- Figure 34: North America Noble Gas Market Volume Share (%), by Country 2025 & 2033
- Figure 35: Europe Noble Gas Market Revenue (Million), by Type 2025 & 2033
- Figure 36: Europe Noble Gas Market Volume (K Tons), by Type 2025 & 2033
- Figure 37: Europe Noble Gas Market Revenue Share (%), by Type 2025 & 2033
- Figure 38: Europe Noble Gas Market Volume Share (%), by Type 2025 & 2033
- Figure 39: Europe Noble Gas Market Revenue (Million), by Application 2025 & 2033
- Figure 40: Europe Noble Gas Market Volume (K Tons), by Application 2025 & 2033
- Figure 41: Europe Noble Gas Market Revenue Share (%), by Application 2025 & 2033
- Figure 42: Europe Noble Gas Market Volume Share (%), by Application 2025 & 2033
- Figure 43: Europe Noble Gas Market Revenue (Million), by End-user Industry 2025 & 2033
- Figure 44: Europe Noble Gas Market Volume (K Tons), by End-user Industry 2025 & 2033
- Figure 45: Europe Noble Gas Market Revenue Share (%), by End-user Industry 2025 & 2033
- Figure 46: Europe Noble Gas Market Volume Share (%), by End-user Industry 2025 & 2033
- Figure 47: Europe Noble Gas Market Revenue (Million), by Country 2025 & 2033
- Figure 48: Europe Noble Gas Market Volume (K Tons), by Country 2025 & 2033
- Figure 49: Europe Noble Gas Market Revenue Share (%), by Country 2025 & 2033
- Figure 50: Europe Noble Gas Market Volume Share (%), by Country 2025 & 2033
- Figure 51: South America Noble Gas Market Revenue (Million), by Type 2025 & 2033
- Figure 52: South America Noble Gas Market Volume (K Tons), by Type 2025 & 2033
- Figure 53: South America Noble Gas Market Revenue Share (%), by Type 2025 & 2033
- Figure 54: South America Noble Gas Market Volume Share (%), by Type 2025 & 2033
- Figure 55: South America Noble Gas Market Revenue (Million), by Application 2025 & 2033
- Figure 56: South America Noble Gas Market Volume (K Tons), by Application 2025 & 2033
- Figure 57: South America Noble Gas Market Revenue Share (%), by Application 2025 & 2033
- Figure 58: South America Noble Gas Market Volume Share (%), by Application 2025 & 2033
- Figure 59: South America Noble Gas Market Revenue (Million), by End-user Industry 2025 & 2033
- Figure 60: South America Noble Gas Market Volume (K Tons), by End-user Industry 2025 & 2033
- Figure 61: South America Noble Gas Market Revenue Share (%), by End-user Industry 2025 & 2033
- Figure 62: South America Noble Gas Market Volume Share (%), by End-user Industry 2025 & 2033
- Figure 63: South America Noble Gas Market Revenue (Million), by Country 2025 & 2033
- Figure 64: South America Noble Gas Market Volume (K Tons), by Country 2025 & 2033
- Figure 65: South America Noble Gas Market Revenue Share (%), by Country 2025 & 2033
- Figure 66: South America Noble Gas Market Volume Share (%), by Country 2025 & 2033
- Figure 67: Middle East Noble Gas Market Revenue (Million), by Type 2025 & 2033
- Figure 68: Middle East Noble Gas Market Volume (K Tons), by Type 2025 & 2033
- Figure 69: Middle East Noble Gas Market Revenue Share (%), by Type 2025 & 2033
- Figure 70: Middle East Noble Gas Market Volume Share (%), by Type 2025 & 2033
- Figure 71: Middle East Noble Gas Market Revenue (Million), by Application 2025 & 2033
- Figure 72: Middle East Noble Gas Market Volume (K Tons), by Application 2025 & 2033
- Figure 73: Middle East Noble Gas Market Revenue Share (%), by Application 2025 & 2033
- Figure 74: Middle East Noble Gas Market Volume Share (%), by Application 2025 & 2033
- Figure 75: Middle East Noble Gas Market Revenue (Million), by End-user Industry 2025 & 2033
- Figure 76: Middle East Noble Gas Market Volume (K Tons), by End-user Industry 2025 & 2033
- Figure 77: Middle East Noble Gas Market Revenue Share (%), by End-user Industry 2025 & 2033
- Figure 78: Middle East Noble Gas Market Volume Share (%), by End-user Industry 2025 & 2033
- Figure 79: Middle East Noble Gas Market Revenue (Million), by Country 2025 & 2033
- Figure 80: Middle East Noble Gas Market Volume (K Tons), by Country 2025 & 2033
- Figure 81: Middle East Noble Gas Market Revenue Share (%), by Country 2025 & 2033
- Figure 82: Middle East Noble Gas Market Volume Share (%), by Country 2025 & 2033
- Figure 83: Saudi Arabia Noble Gas Market Revenue (Million), by Type 2025 & 2033
- Figure 84: Saudi Arabia Noble Gas Market Volume (K Tons), by Type 2025 & 2033
- Figure 85: Saudi Arabia Noble Gas Market Revenue Share (%), by Type 2025 & 2033
- Figure 86: Saudi Arabia Noble Gas Market Volume Share (%), by Type 2025 & 2033
- Figure 87: Saudi Arabia Noble Gas Market Revenue (Million), by Application 2025 & 2033
- Figure 88: Saudi Arabia Noble Gas Market Volume (K Tons), by Application 2025 & 2033
- Figure 89: Saudi Arabia Noble Gas Market Revenue Share (%), by Application 2025 & 2033
- Figure 90: Saudi Arabia Noble Gas Market Volume Share (%), by Application 2025 & 2033
- Figure 91: Saudi Arabia Noble Gas Market Revenue (Million), by End-user Industry 2025 & 2033
- Figure 92: Saudi Arabia Noble Gas Market Volume (K Tons), by End-user Industry 2025 & 2033
- Figure 93: Saudi Arabia Noble Gas Market Revenue Share (%), by End-user Industry 2025 & 2033
- Figure 94: Saudi Arabia Noble Gas Market Volume Share (%), by End-user Industry 2025 & 2033
- Figure 95: Saudi Arabia Noble Gas Market Revenue (Million), by Country 2025 & 2033
- Figure 96: Saudi Arabia Noble Gas Market Volume (K Tons), by Country 2025 & 2033
- Figure 97: Saudi Arabia Noble Gas Market Revenue Share (%), by Country 2025 & 2033
- Figure 98: Saudi Arabia Noble Gas Market Volume Share (%), by Country 2025 & 2033
List of Tables
- Table 1: Global Noble Gas Market Revenue Million Forecast, by Type 2020 & 2033
- Table 2: Global Noble Gas Market Volume K Tons Forecast, by Type 2020 & 2033
- Table 3: Global Noble Gas Market Revenue Million Forecast, by Application 2020 & 2033
- Table 4: Global Noble Gas Market Volume K Tons Forecast, by Application 2020 & 2033
- Table 5: Global Noble Gas Market Revenue Million Forecast, by End-user Industry 2020 & 2033
- Table 6: Global Noble Gas Market Volume K Tons Forecast, by End-user Industry 2020 & 2033
- Table 7: Global Noble Gas Market Revenue Million Forecast, by Region 2020 & 2033
- Table 8: Global Noble Gas Market Volume K Tons Forecast, by Region 2020 & 2033
- Table 9: Global Noble Gas Market Revenue Million Forecast, by Type 2020 & 2033
- Table 10: Global Noble Gas Market Volume K Tons Forecast, by Type 2020 & 2033
- Table 11: Global Noble Gas Market Revenue Million Forecast, by Application 2020 & 2033
- Table 12: Global Noble Gas Market Volume K Tons Forecast, by Application 2020 & 2033
- Table 13: Global Noble Gas Market Revenue Million Forecast, by End-user Industry 2020 & 2033
- Table 14: Global Noble Gas Market Volume K Tons Forecast, by End-user Industry 2020 & 2033
- Table 15: Global Noble Gas Market Revenue Million Forecast, by Country 2020 & 2033
- Table 16: Global Noble Gas Market Volume K Tons Forecast, by Country 2020 & 2033
- Table 17: China Noble Gas Market Revenue (Million) Forecast, by Application 2020 & 2033
- Table 18: China Noble Gas Market Volume (K Tons) Forecast, by Application 2020 & 2033
- Table 19: India Noble Gas Market Revenue (Million) Forecast, by Application 2020 & 2033
- Table 20: India Noble Gas Market Volume (K Tons) Forecast, by Application 2020 & 2033
- Table 21: Japan Noble Gas Market Revenue (Million) Forecast, by Application 2020 & 2033
- Table 22: Japan Noble Gas Market Volume (K Tons) Forecast, by Application 2020 & 2033
- Table 23: South Korea Noble Gas Market Revenue (Million) Forecast, by Application 2020 & 2033
- Table 24: South Korea Noble Gas Market Volume (K Tons) Forecast, by Application 2020 & 2033
- Table 25: Rest of Asia Pacific Noble Gas Market Revenue (Million) Forecast, by Application 2020 & 2033
- Table 26: Rest of Asia Pacific Noble Gas Market Volume (K Tons) Forecast, by Application 2020 & 2033
- Table 27: Global Noble Gas Market Revenue Million Forecast, by Type 2020 & 2033
- Table 28: Global Noble Gas Market Volume K Tons Forecast, by Type 2020 & 2033
- Table 29: Global Noble Gas Market Revenue Million Forecast, by Application 2020 & 2033
- Table 30: Global Noble Gas Market Volume K Tons Forecast, by Application 2020 & 2033
- Table 31: Global Noble Gas Market Revenue Million Forecast, by End-user Industry 2020 & 2033
- Table 32: Global Noble Gas Market Volume K Tons Forecast, by End-user Industry 2020 & 2033
- Table 33: Global Noble Gas Market Revenue Million Forecast, by Country 2020 & 2033
- Table 34: Global Noble Gas Market Volume K Tons Forecast, by Country 2020 & 2033
- Table 35: United States Noble Gas Market Revenue (Million) Forecast, by Application 2020 & 2033
- Table 36: United States Noble Gas Market Volume (K Tons) Forecast, by Application 2020 & 2033
- Table 37: Canada Noble Gas Market Revenue (Million) Forecast, by Application 2020 & 2033
- Table 38: Canada Noble Gas Market Volume (K Tons) Forecast, by Application 2020 & 2033
- Table 39: Mexico Noble Gas Market Revenue (Million) Forecast, by Application 2020 & 2033
- Table 40: Mexico Noble Gas Market Volume (K Tons) Forecast, by Application 2020 & 2033
- Table 41: Global Noble Gas Market Revenue Million Forecast, by Type 2020 & 2033
- Table 42: Global Noble Gas Market Volume K Tons Forecast, by Type 2020 & 2033
- Table 43: Global Noble Gas Market Revenue Million Forecast, by Application 2020 & 2033
- Table 44: Global Noble Gas Market Volume K Tons Forecast, by Application 2020 & 2033
- Table 45: Global Noble Gas Market Revenue Million Forecast, by End-user Industry 2020 & 2033
- Table 46: Global Noble Gas Market Volume K Tons Forecast, by End-user Industry 2020 & 2033
- Table 47: Global Noble Gas Market Revenue Million Forecast, by Country 2020 & 2033
- Table 48: Global Noble Gas Market Volume K Tons Forecast, by Country 2020 & 2033
- Table 49: Germany Noble Gas Market Revenue (Million) Forecast, by Application 2020 & 2033
- Table 50: Germany Noble Gas Market Volume (K Tons) Forecast, by Application 2020 & 2033
- Table 51: United Kingdom Noble Gas Market Revenue (Million) Forecast, by Application 2020 & 2033
- Table 52: United Kingdom Noble Gas Market Volume (K Tons) Forecast, by Application 2020 & 2033
- Table 53: Italy Noble Gas Market Revenue (Million) Forecast, by Application 2020 & 2033
- Table 54: Italy Noble Gas Market Volume (K Tons) Forecast, by Application 2020 & 2033
- Table 55: France Noble Gas Market Revenue (Million) Forecast, by Application 2020 & 2033
- Table 56: France Noble Gas Market Volume (K Tons) Forecast, by Application 2020 & 2033
- Table 57: Rest of Europe Noble Gas Market Revenue (Million) Forecast, by Application 2020 & 2033
- Table 58: Rest of Europe Noble Gas Market Volume (K Tons) Forecast, by Application 2020 & 2033
- Table 59: Global Noble Gas Market Revenue Million Forecast, by Type 2020 & 2033
- Table 60: Global Noble Gas Market Volume K Tons Forecast, by Type 2020 & 2033
- Table 61: Global Noble Gas Market Revenue Million Forecast, by Application 2020 & 2033
- Table 62: Global Noble Gas Market Volume K Tons Forecast, by Application 2020 & 2033
- Table 63: Global Noble Gas Market Revenue Million Forecast, by End-user Industry 2020 & 2033
- Table 64: Global Noble Gas Market Volume K Tons Forecast, by End-user Industry 2020 & 2033
- Table 65: Global Noble Gas Market Revenue Million Forecast, by Country 2020 & 2033
- Table 66: Global Noble Gas Market Volume K Tons Forecast, by Country 2020 & 2033
- Table 67: Brazil Noble Gas Market Revenue (Million) Forecast, by Application 2020 & 2033
- Table 68: Brazil Noble Gas Market Volume (K Tons) Forecast, by Application 2020 & 2033
- Table 69: Argentina Noble Gas Market Revenue (Million) Forecast, by Application 2020 & 2033
- Table 70: Argentina Noble Gas Market Volume (K Tons) Forecast, by Application 2020 & 2033
- Table 71: Rest of South America Noble Gas Market Revenue (Million) Forecast, by Application 2020 & 2033
- Table 72: Rest of South America Noble Gas Market Volume (K Tons) Forecast, by Application 2020 & 2033
- Table 73: Global Noble Gas Market Revenue Million Forecast, by Type 2020 & 2033
- Table 74: Global Noble Gas Market Volume K Tons Forecast, by Type 2020 & 2033
- Table 75: Global Noble Gas Market Revenue Million Forecast, by Application 2020 & 2033
- Table 76: Global Noble Gas Market Volume K Tons Forecast, by Application 2020 & 2033
- Table 77: Global Noble Gas Market Revenue Million Forecast, by End-user Industry 2020 & 2033
- Table 78: Global Noble Gas Market Volume K Tons Forecast, by End-user Industry 2020 & 2033
- Table 79: Global Noble Gas Market Revenue Million Forecast, by Country 2020 & 2033
- Table 80: Global Noble Gas Market Volume K Tons Forecast, by Country 2020 & 2033
- Table 81: Global Noble Gas Market Revenue Million Forecast, by Type 2020 & 2033
- Table 82: Global Noble Gas Market Volume K Tons Forecast, by Type 2020 & 2033
- Table 83: Global Noble Gas Market Revenue Million Forecast, by Application 2020 & 2033
- Table 84: Global Noble Gas Market Volume K Tons Forecast, by Application 2020 & 2033
- Table 85: Global Noble Gas Market Revenue Million Forecast, by End-user Industry 2020 & 2033
- Table 86: Global Noble Gas Market Volume K Tons Forecast, by End-user Industry 2020 & 2033
- Table 87: Global Noble Gas Market Revenue Million Forecast, by Country 2020 & 2033
- Table 88: Global Noble Gas Market Volume K Tons Forecast, by Country 2020 & 2033
- Table 89: South Africa Noble Gas Market Revenue (Million) Forecast, by Application 2020 & 2033
- Table 90: South Africa Noble Gas Market Volume (K Tons) Forecast, by Application 2020 & 2033
- Table 91: Rest of Middle East Noble Gas Market Revenue (Million) Forecast, by Application 2020 & 2033
- Table 92: Rest of Middle East Noble Gas Market Volume (K Tons) Forecast, by Application 2020 & 2033
Frequently Asked Questions
1. What is the projected Compound Annual Growth Rate (CAGR) of the Noble Gas Market?
The projected CAGR is approximately > 5.00%.
2. Which companies are prominent players in the Noble Gas Market?
Key companies in the market include Air Products and Chemicals Inc, Messer North America Inc, Gulf Cryo, Ras Gas Company Limited, Praxair Technology Inc, BASF SE, ITM Power, Linde plc, American Gas, TAIYO NIPPON SANSO CORPORATION*List Not Exhaustive, Royal Dutch Shell PLC, Buzwair Industrial Gases Factories, Air Liquide, Airgas Inc.
3. What are the main segments of the Noble Gas Market?
The market segments include Type, Application, End-user Industry.
4. Can you provide details about the market size?
The market size is estimated to be USD 43600 Million as of 2022.
5. What are some drivers contributing to market growth?
Growing Demand in the Healthcare Industry; Expansion of Steel and Automotive industry.
6. What are the notable trends driving market growth?
Increasing Demand from the Healthcare Industry.
7. Are there any restraints impacting market growth?
Fluctuating Prices of Noble gases; Need of high-efficient gas extracting method.
8. Can you provide examples of recent developments in the market?
April 2022: Linde signed an off-take agreement to recover the helium contained in Freeport LNG's production site in Texas (United States). Linde will also construct a helium processing plant for liquid helium in the United States.
9. What pricing options are available for accessing the report?
Pricing options include single-user, multi-user, and enterprise licenses priced at USD 4750, USD 5250, and USD 8750 respectively.
10. Is the market size provided in terms of value or volume?
The market size is provided in terms of value, measured in Million and volume, measured in K Tons.
11. Are there any specific market keywords associated with the report?
Yes, the market keyword associated with the report is "Noble Gas Market," which aids in identifying and referencing the specific market segment covered.
12. How do I determine which pricing option suits my needs best?
The pricing options vary based on user requirements and access needs. Individual users may opt for single-user licenses, while businesses requiring broader access may choose multi-user or enterprise licenses for cost-effective access to the report.
13. Are there any additional resources or data provided in the Noble Gas Market report?
While the report offers comprehensive insights, it's advisable to review the specific contents or supplementary materials provided to ascertain if additional resources or data are available.
14. How can I stay updated on further developments or reports in the Noble Gas Market?
To stay informed about further developments, trends, and reports in the Noble Gas Market, consider subscribing to industry newsletters, following relevant companies and organizations, or regularly checking reputable industry news sources and publications.
Methodology
Step 1 - Identification of Relevant Samples Size from Population Database


Step 2 - Approaches for Defining Global Market Size (Value, Volume* & Price*)

Note*: In applicable scenarios
Step 3 - Data Sources
Primary Research
- Web Analytics
- Survey Reports
- Research Institute
- Latest Research Reports
- Opinion Leaders
Secondary Research
- Annual Reports
- White Paper
- Latest Press Release
- Industry Association
- Paid Database
- Investor Presentations

Step 4 - Data Triangulation
Involves using different sources of information in order to increase the validity of a study
These sources are likely to be stakeholders in a program - participants, other researchers, program staff, other community members, and so on.
Then we put all data in single framework & apply various statistical tools to find out the dynamic on the market.
During the analysis stage, feedback from the stakeholder groups would be compared to determine areas of agreement as well as areas of divergence