

Key Insights
The Next Generation Sugar Substitute market is poised for significant expansion, projected to reach $8.54 billion by 2025. This robust growth is underpinned by a remarkable Compound Annual Growth Rate (CAGR) of 14.07% during the forecast period. A primary driver for this surge is the escalating global demand for healthier food and beverage options, propelled by increasing consumer awareness of the adverse health effects associated with excessive sugar consumption, such as obesity, diabetes, and cardiovascular diseases. The food and beverage industry's proactive adoption of these substitutes to reformulate products, offering low-calorie and sugar-free alternatives, is a key catalyst. Furthermore, advancements in production technologies and the development of novel sugar substitutes with improved taste profiles and functionalities are contributing to their wider acceptance. The market is also benefiting from supportive government initiatives and regulations encouraging the reduction of sugar content in processed foods.
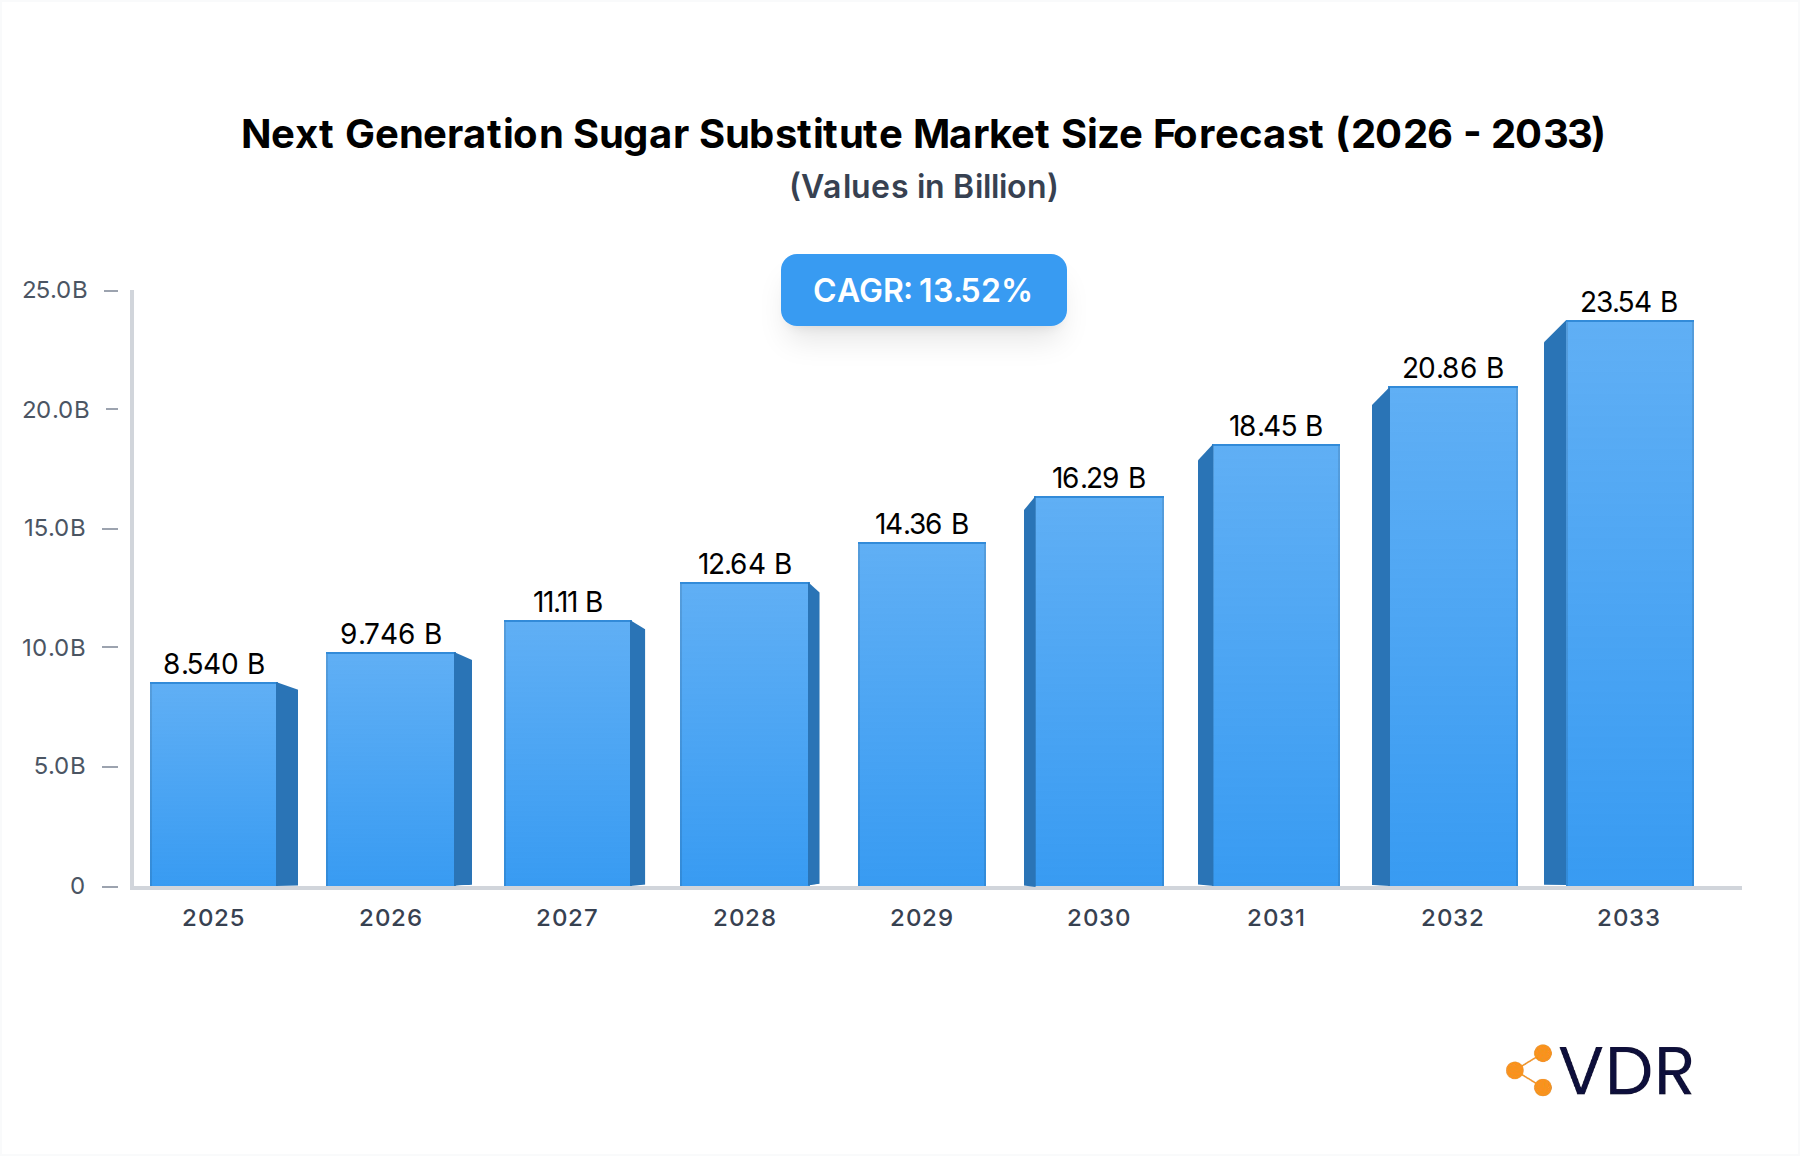
Next Generation Sugar Substitute Market Size (In Billion)
The market's trajectory is further shaped by emerging trends like the growing popularity of naturally derived sweeteners and the innovative use of these substitutes in diverse applications beyond traditional food and beverages, including pharmaceuticals and personal care products. However, challenges such as the relatively higher cost of production for some next-generation sugar substitutes compared to conventional sugar and artificial sweeteners, along with consumer perceptions regarding taste and safety, present potential restraints. Despite these hurdles, the increasing investments in research and development by key players like Tate & Lyle, Cargill, and Ingredion, coupled with expanding distribution networks, are expected to fuel market penetration and adoption across all major regions, with Asia Pacific anticipated to be a significant growth engine due to its large population and rising disposable incomes.

Next Generation Sugar Substitute Company Market Share
This comprehensive report provides an in-depth analysis of the global Next Generation Sugar Substitute market, a rapidly expanding sector driven by escalating health consciousness and the demand for reduced sugar content in food and beverage products. Covering the study period from 2019 to 2033, with a base year of 2025, this report offers critical insights into market dynamics, growth trends, regional dominance, product innovation, and the competitive landscape. We explore the intricate interplay between parent and child markets, uncovering opportunities and challenges that will shape the future of this sugar alternative industry. Discover how low-calorie sweeteners, natural sweeteners, and sugar replacers are revolutionizing the food and beverage industry.
Next Generation Sugar Substitute Market Dynamics & Structure
The next generation sugar substitute market exhibits moderate to high market concentration, with key players like Tate & Lyle, Cargill, Matsutani Chemical, and Ingredion holding significant shares. Technological innovation is a primary driver, with continuous research and development focused on taste profiles, functionality, and cost-effectiveness of sweeteners such as Allulose and Tagatose. Regulatory frameworks, particularly concerning food safety and labeling, play a crucial role in market entry and product acceptance. Competitive product substitutes, including traditional artificial sweeteners and other novel ingredients, present ongoing challenges. End-user demographics are increasingly health-conscious, favoring products with reduced sugar and natural ingredients. Mergers and acquisitions (M&A) are anticipated to increase as companies seek to expand their product portfolios and market reach, further consolidating the industry.
- Market Concentration: Dominated by a few large players, but with increasing fragmentation in niche segments.
- Technological Innovation: Focus on improving taste, texture, and cost-effectiveness of sugar substitutes.
- Regulatory Frameworks: Stringent approval processes and evolving labeling requirements.
- Competitive Substitutes: Impact of existing artificial sweeteners and emerging natural alternatives.
- End-User Demographics: Growing demand from health-conscious consumers and specific dietary groups.
- M&A Trends: Strategic acquisitions for portfolio expansion and market share growth.
Next Generation Sugar Substitute Growth Trends & Insights
The global next generation sugar substitute market is projected for robust growth, driven by a paradigm shift in consumer preferences and an intensified focus on health and wellness. The market size is expected to witness substantial expansion from an estimated $15.2 billion in 2025 to $30.1 billion by 2033, reflecting a Compound Annual Growth Rate (CAGR) of approximately 8.9%. Adoption rates for novel sweeteners like Allulose and Tagatose are accelerating as manufacturers actively reformulate their products to meet consumer demand for reduced sugar content without compromising taste or texture. Technological disruptions, including advancements in fermentation processes for natural sweeteners and the development of synergistic sweetener blends, are further fueling market penetration. Consumer behavior shifts are evident in the increasing preference for ingredients perceived as natural and healthy, leading to a decline in the consumption of traditional sugars and artificial sweeteners. This evolving landscape presents a significant opportunity for innovative sugar alternatives to capture market share. The increasing awareness of the detrimental health effects of excessive sugar consumption, such as obesity, diabetes, and cardiovascular diseases, is a primary catalyst for this market's expansion. Food and beverage manufacturers are responding by actively seeking out and incorporating next-generation sugar substitutes into their product lines, from beverages and baked goods to confectionery and dairy products. The sugar replacer market is therefore experiencing an unprecedented surge.
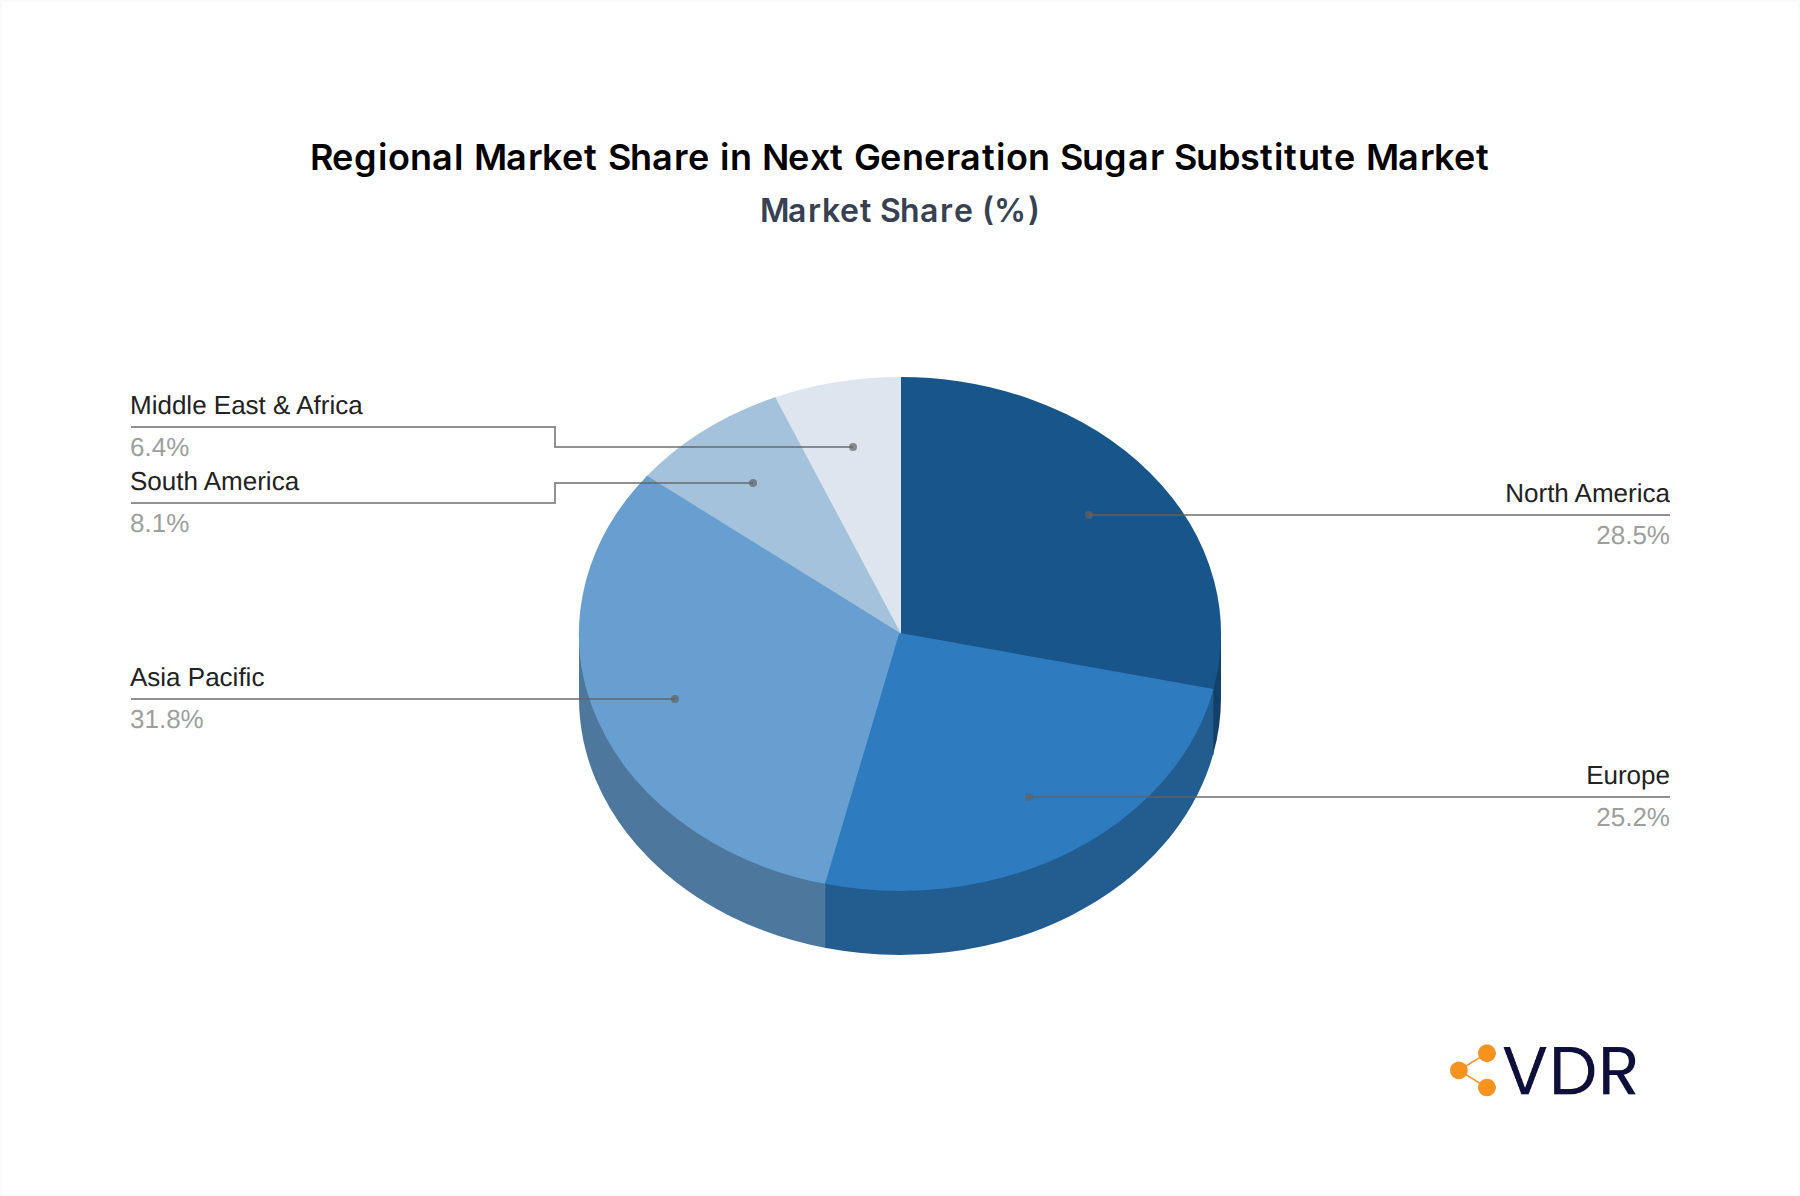
Dominant Regions, Countries, or Segments in Next Generation Sugar Substitute
The next generation sugar substitute market is witnessing significant growth across various regions, with North America and Europe currently leading in adoption and innovation. However, the Asia Pacific region, particularly China and India, is emerging as a high-growth frontier due to a burgeoning middle class, increasing disposable income, and a growing awareness of health and wellness trends. Within the Application segment, Beverages consistently represent the largest and fastest-growing application, driven by the demand for low-sugar soft drinks, juices, and functional beverages. Baked Goods and Dairy Products also represent substantial application areas, with manufacturers reformulating to meet consumer preferences for healthier options. In terms of Type, Stevia continues to hold a significant market share due to its natural origin and widespread consumer acceptance. However, Allulose is experiencing remarkable growth, driven by its sugar-like taste, texture, and low-calorie profile, along with its potential health benefits. The increasing availability of high-purity allulose and its broader regulatory approvals are further propelling its adoption. The Fiber Sweetener segment is also gaining traction, offering dual benefits of sweetness and dietary fiber.
- Leading Region: North America, driven by high consumer awareness and strong regulatory support for health-focused food products.
- Emerging Growth Market: Asia Pacific, fueled by rising health consciousness and a growing middle class.
- Dominant Application: Beverages, accounting for the largest share due to extensive reformulation efforts in soft drinks and functional drinks.
- Key Segment Driver (Type): Allulose, exhibiting rapid growth due to its favorable taste and health profile, challenging established sweeteners.
- Growth Potential: Significant opportunities in emerging economies for all types of sugar substitutes as dietary patterns evolve.
Next Generation Sugar Substitute Product Landscape
The next generation sugar substitute product landscape is characterized by continuous innovation aimed at enhancing taste, texture, and functionality to mimic natural sugar. Companies are developing novel sweeteners, including rare sugars like Allulose and Tagatose, as well as highly purified Stevia extracts and advanced Fiber Sweeteners. These products offer unique selling propositions such as low glycemic impact, prebiotic properties, and enhanced solubility. Technological advancements in extraction, purification, and blending techniques are enabling the creation of synergistic formulations that deliver a superior sensory experience and improved performance in various food matrices, from dairy products to confectionery. The focus is on creating clean-label, natural, and health-promoting ingredients that meet the evolving demands of consumers.
Key Drivers, Barriers & Challenges in Next Generation Sugar Substitute
Key Drivers:
- Rising Global Health Consciousness: Increasing consumer awareness of sugar's adverse health effects fuels demand for sugar-free and low-sugar alternatives.
- Government Initiatives & Regulations: Policies promoting reduced sugar intake and supporting healthier food options.
- Technological Advancements: Innovations in production, purification, and formulation of sweeteners like allulose and tagatose.
- Growing Food & Beverage Industry: Expansion of the food and beverage sector, particularly in emerging markets, drives demand for diverse sweetening solutions.
- Demand for Natural Sweeteners: Preference for ingredients derived from natural sources, such as stevia and fiber sweeteners.
Barriers & Challenges:
- Cost of Production: Higher manufacturing costs compared to traditional sugar can limit widespread adoption.
- Taste and Aftertaste Issues: Some sugar substitutes still struggle to perfectly replicate the taste and mouthfeel of sugar, leading to aftertaste concerns.
- Regulatory Hurdles: Stringent approval processes and varying regulations across different regions can delay market entry.
- Consumer Perception and Education: Misconceptions and lack of awareness regarding novel sweeteners can impede acceptance.
- Supply Chain Volatility: Potential disruptions in the sourcing of raw materials for certain natural sweeteners.
Emerging Opportunities in Next Generation Sugar Substitute
Emerging opportunities within the next generation sugar substitute market lie in the development of novel, multifunctional sweeteners that offer additional health benefits beyond just sweetness. Untapped markets in developing economies, where chronic diseases linked to sugar consumption are on the rise, present significant growth potential. Innovative applications in diverse product categories, such as savory snacks, sauces, and pharmaceutical formulations, offer new avenues for expansion. Evolving consumer preferences for clean-label, plant-based, and non-GMO ingredients will continue to drive demand for specific types of sugar alternatives. Furthermore, advancements in biotechnology and fermentation processes are opening doors for cost-effective and sustainable production of existing and new sugar substitutes. The parent market of broader food ingredients also presents an opportunity for synergistic product development.
Growth Accelerators in the Next Generation Sugar Substitute Industry
The next generation sugar substitute industry is propelled by a convergence of accelerating factors. Technological breakthroughs in precision fermentation and enzymatic synthesis are enabling more efficient and cost-effective production of rare sugars and other novel sweeteners. Strategic partnerships between ingredient suppliers and major food and beverage manufacturers are critical for driving product innovation and market penetration, allowing for faster reformulation and market introduction. Expansion into emerging economies, where demand for healthier food options is rapidly increasing, represents a significant growth accelerator. Furthermore, the continued focus on developing sweeteners with improved sensory profiles and functional benefits will broaden their applicability across an ever-wider range of food and beverage products.
Key Players Shaping the Next Generation Sugar Substitute Market
- Tate & Lyle
- Cargill
- Matsutani Chemical
- Ingredion
- Arla Foods
- ADM
- CJ CheilJedang
- NuNaturals
- Howtian
- Samyang
- Damhert
- Spherix
- Beneo
- Bailong Chuangyuan
- Shandong Shengxiangyuan
Notable Milestones in Next Generation Sugar Substitute Sector
- 2019: Increased regulatory approvals and market launches for Allulose in various regions, signaling growing acceptance.
- 2020: Significant R&D investment by major players in developing novel natural sweeteners with enhanced taste profiles.
- 2021: Expansion of stevia-based sweetener applications into a wider array of confectionery and dairy products.
- 2022: Growing trend of partnerships between ingredient manufacturers and beverage companies for sugar reduction initiatives.
- 2023: Rise in consumer demand for fiber sweeteners as an option offering both sweetness and digestive health benefits.
- 2024: Introduction of new synergistic sweetener blends designed to mimic sugar's taste and texture more closely.
In-Depth Next Generation Sugar Substitute Market Outlook
The next generation sugar substitute market is poised for sustained and accelerated growth, driven by an unyielding global commitment to health and wellness. Future market potential is significant, with an anticipated surge in demand for innovative, clean-label sugar alternatives. Strategic opportunities abound for companies that can leverage advancements in biotechnology for cost-effective production and develop sweeteners with superior sensory attributes and additional health benefits, such as gut health or prebiotic effects. Collaboration between ingredient innovators and major food and beverage manufacturers will be paramount in driving wider adoption and introducing novel products to consumers. The evolving regulatory landscape and increasing consumer education will further shape the market, creating a dynamic and promising future for this essential segment of the food industry.
Next Generation Sugar Substitute Segmentation
-
1. Application
- 1.1. Beverages
- 1.2. Baked Goods
- 1.3. Candy
- 1.4. Dairy Product
- 1.5. Others
-
2. Type
- 2.1. Allulose
- 2.2. Tagatose
- 2.3. Fiber Sweetener
- 2.4. Stevia
- 2.5. Others
Next Generation Sugar Substitute Segmentation By Geography
-
1. North America
- 1.1. United States
- 1.2. Canada
- 1.3. Mexico
-
2. South America
- 2.1. Brazil
- 2.2. Argentina
- 2.3. Rest of South America
-
3. Europe
- 3.1. United Kingdom
- 3.2. Germany
- 3.3. France
- 3.4. Italy
- 3.5. Spain
- 3.6. Russia
- 3.7. Benelux
- 3.8. Nordics
- 3.9. Rest of Europe
-
4. Middle East & Africa
- 4.1. Turkey
- 4.2. Israel
- 4.3. GCC
- 4.4. North Africa
- 4.5. South Africa
- 4.6. Rest of Middle East & Africa
-
5. Asia Pacific
- 5.1. China
- 5.2. India
- 5.3. Japan
- 5.4. South Korea
- 5.5. ASEAN
- 5.6. Oceania
- 5.7. Rest of Asia Pacific
Next Generation Sugar Substitute Regional Market Share
Geographic Coverage of Next Generation Sugar Substitute
Next Generation Sugar Substitute REPORT HIGHLIGHTS
| Aspects | Details |
|---|---|
| Study Period | 2020-2034 |
| Base Year | 2025 |
| Estimated Year | 2026 |
| Forecast Period | 2026-2034 |
| Historical Period | 2020-2025 |
| Growth Rate | CAGR of 6.6% from 2020-2034 |
| Segmentation |
|
Table of Contents
- 1. Introduction
- 1.1. Research Scope
- 1.2. Market Segmentation
- 1.3. Research Methodology
- 1.4. Definitions and Assumptions
- 2. Executive Summary
- 2.1. Introduction
- 3. Market Dynamics
- 3.1. Introduction
- 3.2. Market Drivers
- 3.3. Market Restrains
- 3.4. Market Trends
- 4. Market Factor Analysis
- 4.1. Porters Five Forces
- 4.2. Supply/Value Chain
- 4.3. PESTEL analysis
- 4.4. Market Entropy
- 4.5. Patent/Trademark Analysis
- 5. Global Next Generation Sugar Substitute Analysis, Insights and Forecast, 2020-2032
- 5.1. Market Analysis, Insights and Forecast - by Application
- 5.1.1. Beverages
- 5.1.2. Baked Goods
- 5.1.3. Candy
- 5.1.4. Dairy Product
- 5.1.5. Others
- 5.2. Market Analysis, Insights and Forecast - by Type
- 5.2.1. Allulose
- 5.2.2. Tagatose
- 5.2.3. Fiber Sweetener
- 5.2.4. Stevia
- 5.2.5. Others
- 5.3. Market Analysis, Insights and Forecast - by Region
- 5.3.1. North America
- 5.3.2. South America
- 5.3.3. Europe
- 5.3.4. Middle East & Africa
- 5.3.5. Asia Pacific
- 5.1. Market Analysis, Insights and Forecast - by Application
- 6. North America Next Generation Sugar Substitute Analysis, Insights and Forecast, 2020-2032
- 6.1. Market Analysis, Insights and Forecast - by Application
- 6.1.1. Beverages
- 6.1.2. Baked Goods
- 6.1.3. Candy
- 6.1.4. Dairy Product
- 6.1.5. Others
- 6.2. Market Analysis, Insights and Forecast - by Type
- 6.2.1. Allulose
- 6.2.2. Tagatose
- 6.2.3. Fiber Sweetener
- 6.2.4. Stevia
- 6.2.5. Others
- 6.1. Market Analysis, Insights and Forecast - by Application
- 7. South America Next Generation Sugar Substitute Analysis, Insights and Forecast, 2020-2032
- 7.1. Market Analysis, Insights and Forecast - by Application
- 7.1.1. Beverages
- 7.1.2. Baked Goods
- 7.1.3. Candy
- 7.1.4. Dairy Product
- 7.1.5. Others
- 7.2. Market Analysis, Insights and Forecast - by Type
- 7.2.1. Allulose
- 7.2.2. Tagatose
- 7.2.3. Fiber Sweetener
- 7.2.4. Stevia
- 7.2.5. Others
- 7.1. Market Analysis, Insights and Forecast - by Application
- 8. Europe Next Generation Sugar Substitute Analysis, Insights and Forecast, 2020-2032
- 8.1. Market Analysis, Insights and Forecast - by Application
- 8.1.1. Beverages
- 8.1.2. Baked Goods
- 8.1.3. Candy
- 8.1.4. Dairy Product
- 8.1.5. Others
- 8.2. Market Analysis, Insights and Forecast - by Type
- 8.2.1. Allulose
- 8.2.2. Tagatose
- 8.2.3. Fiber Sweetener
- 8.2.4. Stevia
- 8.2.5. Others
- 8.1. Market Analysis, Insights and Forecast - by Application
- 9. Middle East & Africa Next Generation Sugar Substitute Analysis, Insights and Forecast, 2020-2032
- 9.1. Market Analysis, Insights and Forecast - by Application
- 9.1.1. Beverages
- 9.1.2. Baked Goods
- 9.1.3. Candy
- 9.1.4. Dairy Product
- 9.1.5. Others
- 9.2. Market Analysis, Insights and Forecast - by Type
- 9.2.1. Allulose
- 9.2.2. Tagatose
- 9.2.3. Fiber Sweetener
- 9.2.4. Stevia
- 9.2.5. Others
- 9.1. Market Analysis, Insights and Forecast - by Application
- 10. Asia Pacific Next Generation Sugar Substitute Analysis, Insights and Forecast, 2020-2032
- 10.1. Market Analysis, Insights and Forecast - by Application
- 10.1.1. Beverages
- 10.1.2. Baked Goods
- 10.1.3. Candy
- 10.1.4. Dairy Product
- 10.1.5. Others
- 10.2. Market Analysis, Insights and Forecast - by Type
- 10.2.1. Allulose
- 10.2.2. Tagatose
- 10.2.3. Fiber Sweetener
- 10.2.4. Stevia
- 10.2.5. Others
- 10.1. Market Analysis, Insights and Forecast - by Application
- 11. Competitive Analysis
- 11.1. Global Market Share Analysis 2025
- 11.2. Company Profiles
- 11.2.1 Tate & Lyle
- 11.2.1.1. Overview
- 11.2.1.2. Products
- 11.2.1.3. SWOT Analysis
- 11.2.1.4. Recent Developments
- 11.2.1.5. Financials (Based on Availability)
- 11.2.2 Cargill
- 11.2.2.1. Overview
- 11.2.2.2. Products
- 11.2.2.3. SWOT Analysis
- 11.2.2.4. Recent Developments
- 11.2.2.5. Financials (Based on Availability)
- 11.2.3 Matsutani Chemical
- 11.2.3.1. Overview
- 11.2.3.2. Products
- 11.2.3.3. SWOT Analysis
- 11.2.3.4. Recent Developments
- 11.2.3.5. Financials (Based on Availability)
- 11.2.4 Ingredion
- 11.2.4.1. Overview
- 11.2.4.2. Products
- 11.2.4.3. SWOT Analysis
- 11.2.4.4. Recent Developments
- 11.2.4.5. Financials (Based on Availability)
- 11.2.5 Arla Foods
- 11.2.5.1. Overview
- 11.2.5.2. Products
- 11.2.5.3. SWOT Analysis
- 11.2.5.4. Recent Developments
- 11.2.5.5. Financials (Based on Availability)
- 11.2.6 ADM
- 11.2.6.1. Overview
- 11.2.6.2. Products
- 11.2.6.3. SWOT Analysis
- 11.2.6.4. Recent Developments
- 11.2.6.5. Financials (Based on Availability)
- 11.2.7 CJ CheilJedang
- 11.2.7.1. Overview
- 11.2.7.2. Products
- 11.2.7.3. SWOT Analysis
- 11.2.7.4. Recent Developments
- 11.2.7.5. Financials (Based on Availability)
- 11.2.8 NuNaturals
- 11.2.8.1. Overview
- 11.2.8.2. Products
- 11.2.8.3. SWOT Analysis
- 11.2.8.4. Recent Developments
- 11.2.8.5. Financials (Based on Availability)
- 11.2.9 Howtian
- 11.2.9.1. Overview
- 11.2.9.2. Products
- 11.2.9.3. SWOT Analysis
- 11.2.9.4. Recent Developments
- 11.2.9.5. Financials (Based on Availability)
- 11.2.10 Samyang
- 11.2.10.1. Overview
- 11.2.10.2. Products
- 11.2.10.3. SWOT Analysis
- 11.2.10.4. Recent Developments
- 11.2.10.5. Financials (Based on Availability)
- 11.2.11 Damhert
- 11.2.11.1. Overview
- 11.2.11.2. Products
- 11.2.11.3. SWOT Analysis
- 11.2.11.4. Recent Developments
- 11.2.11.5. Financials (Based on Availability)
- 11.2.12 Spherix
- 11.2.12.1. Overview
- 11.2.12.2. Products
- 11.2.12.3. SWOT Analysis
- 11.2.12.4. Recent Developments
- 11.2.12.5. Financials (Based on Availability)
- 11.2.13 Beneo
- 11.2.13.1. Overview
- 11.2.13.2. Products
- 11.2.13.3. SWOT Analysis
- 11.2.13.4. Recent Developments
- 11.2.13.5. Financials (Based on Availability)
- 11.2.14 Bailong Chuangyuan
- 11.2.14.1. Overview
- 11.2.14.2. Products
- 11.2.14.3. SWOT Analysis
- 11.2.14.4. Recent Developments
- 11.2.14.5. Financials (Based on Availability)
- 11.2.15 Shandong Shengxiangyuan
- 11.2.15.1. Overview
- 11.2.15.2. Products
- 11.2.15.3. SWOT Analysis
- 11.2.15.4. Recent Developments
- 11.2.15.5. Financials (Based on Availability)
- 11.2.1 Tate & Lyle
List of Figures
- Figure 1: Global Next Generation Sugar Substitute Revenue Breakdown (undefined, %) by Region 2025 & 2033
- Figure 2: Global Next Generation Sugar Substitute Volume Breakdown (K, %) by Region 2025 & 2033
- Figure 3: North America Next Generation Sugar Substitute Revenue (undefined), by Application 2025 & 2033
- Figure 4: North America Next Generation Sugar Substitute Volume (K), by Application 2025 & 2033
- Figure 5: North America Next Generation Sugar Substitute Revenue Share (%), by Application 2025 & 2033
- Figure 6: North America Next Generation Sugar Substitute Volume Share (%), by Application 2025 & 2033
- Figure 7: North America Next Generation Sugar Substitute Revenue (undefined), by Type 2025 & 2033
- Figure 8: North America Next Generation Sugar Substitute Volume (K), by Type 2025 & 2033
- Figure 9: North America Next Generation Sugar Substitute Revenue Share (%), by Type 2025 & 2033
- Figure 10: North America Next Generation Sugar Substitute Volume Share (%), by Type 2025 & 2033
- Figure 11: North America Next Generation Sugar Substitute Revenue (undefined), by Country 2025 & 2033
- Figure 12: North America Next Generation Sugar Substitute Volume (K), by Country 2025 & 2033
- Figure 13: North America Next Generation Sugar Substitute Revenue Share (%), by Country 2025 & 2033
- Figure 14: North America Next Generation Sugar Substitute Volume Share (%), by Country 2025 & 2033
- Figure 15: South America Next Generation Sugar Substitute Revenue (undefined), by Application 2025 & 2033
- Figure 16: South America Next Generation Sugar Substitute Volume (K), by Application 2025 & 2033
- Figure 17: South America Next Generation Sugar Substitute Revenue Share (%), by Application 2025 & 2033
- Figure 18: South America Next Generation Sugar Substitute Volume Share (%), by Application 2025 & 2033
- Figure 19: South America Next Generation Sugar Substitute Revenue (undefined), by Type 2025 & 2033
- Figure 20: South America Next Generation Sugar Substitute Volume (K), by Type 2025 & 2033
- Figure 21: South America Next Generation Sugar Substitute Revenue Share (%), by Type 2025 & 2033
- Figure 22: South America Next Generation Sugar Substitute Volume Share (%), by Type 2025 & 2033
- Figure 23: South America Next Generation Sugar Substitute Revenue (undefined), by Country 2025 & 2033
- Figure 24: South America Next Generation Sugar Substitute Volume (K), by Country 2025 & 2033
- Figure 25: South America Next Generation Sugar Substitute Revenue Share (%), by Country 2025 & 2033
- Figure 26: South America Next Generation Sugar Substitute Volume Share (%), by Country 2025 & 2033
- Figure 27: Europe Next Generation Sugar Substitute Revenue (undefined), by Application 2025 & 2033
- Figure 28: Europe Next Generation Sugar Substitute Volume (K), by Application 2025 & 2033
- Figure 29: Europe Next Generation Sugar Substitute Revenue Share (%), by Application 2025 & 2033
- Figure 30: Europe Next Generation Sugar Substitute Volume Share (%), by Application 2025 & 2033
- Figure 31: Europe Next Generation Sugar Substitute Revenue (undefined), by Type 2025 & 2033
- Figure 32: Europe Next Generation Sugar Substitute Volume (K), by Type 2025 & 2033
- Figure 33: Europe Next Generation Sugar Substitute Revenue Share (%), by Type 2025 & 2033
- Figure 34: Europe Next Generation Sugar Substitute Volume Share (%), by Type 2025 & 2033
- Figure 35: Europe Next Generation Sugar Substitute Revenue (undefined), by Country 2025 & 2033
- Figure 36: Europe Next Generation Sugar Substitute Volume (K), by Country 2025 & 2033
- Figure 37: Europe Next Generation Sugar Substitute Revenue Share (%), by Country 2025 & 2033
- Figure 38: Europe Next Generation Sugar Substitute Volume Share (%), by Country 2025 & 2033
- Figure 39: Middle East & Africa Next Generation Sugar Substitute Revenue (undefined), by Application 2025 & 2033
- Figure 40: Middle East & Africa Next Generation Sugar Substitute Volume (K), by Application 2025 & 2033
- Figure 41: Middle East & Africa Next Generation Sugar Substitute Revenue Share (%), by Application 2025 & 2033
- Figure 42: Middle East & Africa Next Generation Sugar Substitute Volume Share (%), by Application 2025 & 2033
- Figure 43: Middle East & Africa Next Generation Sugar Substitute Revenue (undefined), by Type 2025 & 2033
- Figure 44: Middle East & Africa Next Generation Sugar Substitute Volume (K), by Type 2025 & 2033
- Figure 45: Middle East & Africa Next Generation Sugar Substitute Revenue Share (%), by Type 2025 & 2033
- Figure 46: Middle East & Africa Next Generation Sugar Substitute Volume Share (%), by Type 2025 & 2033
- Figure 47: Middle East & Africa Next Generation Sugar Substitute Revenue (undefined), by Country 2025 & 2033
- Figure 48: Middle East & Africa Next Generation Sugar Substitute Volume (K), by Country 2025 & 2033
- Figure 49: Middle East & Africa Next Generation Sugar Substitute Revenue Share (%), by Country 2025 & 2033
- Figure 50: Middle East & Africa Next Generation Sugar Substitute Volume Share (%), by Country 2025 & 2033
- Figure 51: Asia Pacific Next Generation Sugar Substitute Revenue (undefined), by Application 2025 & 2033
- Figure 52: Asia Pacific Next Generation Sugar Substitute Volume (K), by Application 2025 & 2033
- Figure 53: Asia Pacific Next Generation Sugar Substitute Revenue Share (%), by Application 2025 & 2033
- Figure 54: Asia Pacific Next Generation Sugar Substitute Volume Share (%), by Application 2025 & 2033
- Figure 55: Asia Pacific Next Generation Sugar Substitute Revenue (undefined), by Type 2025 & 2033
- Figure 56: Asia Pacific Next Generation Sugar Substitute Volume (K), by Type 2025 & 2033
- Figure 57: Asia Pacific Next Generation Sugar Substitute Revenue Share (%), by Type 2025 & 2033
- Figure 58: Asia Pacific Next Generation Sugar Substitute Volume Share (%), by Type 2025 & 2033
- Figure 59: Asia Pacific Next Generation Sugar Substitute Revenue (undefined), by Country 2025 & 2033
- Figure 60: Asia Pacific Next Generation Sugar Substitute Volume (K), by Country 2025 & 2033
- Figure 61: Asia Pacific Next Generation Sugar Substitute Revenue Share (%), by Country 2025 & 2033
- Figure 62: Asia Pacific Next Generation Sugar Substitute Volume Share (%), by Country 2025 & 2033
List of Tables
- Table 1: Global Next Generation Sugar Substitute Revenue undefined Forecast, by Application 2020 & 2033
- Table 2: Global Next Generation Sugar Substitute Volume K Forecast, by Application 2020 & 2033
- Table 3: Global Next Generation Sugar Substitute Revenue undefined Forecast, by Type 2020 & 2033
- Table 4: Global Next Generation Sugar Substitute Volume K Forecast, by Type 2020 & 2033
- Table 5: Global Next Generation Sugar Substitute Revenue undefined Forecast, by Region 2020 & 2033
- Table 6: Global Next Generation Sugar Substitute Volume K Forecast, by Region 2020 & 2033
- Table 7: Global Next Generation Sugar Substitute Revenue undefined Forecast, by Application 2020 & 2033
- Table 8: Global Next Generation Sugar Substitute Volume K Forecast, by Application 2020 & 2033
- Table 9: Global Next Generation Sugar Substitute Revenue undefined Forecast, by Type 2020 & 2033
- Table 10: Global Next Generation Sugar Substitute Volume K Forecast, by Type 2020 & 2033
- Table 11: Global Next Generation Sugar Substitute Revenue undefined Forecast, by Country 2020 & 2033
- Table 12: Global Next Generation Sugar Substitute Volume K Forecast, by Country 2020 & 2033
- Table 13: United States Next Generation Sugar Substitute Revenue (undefined) Forecast, by Application 2020 & 2033
- Table 14: United States Next Generation Sugar Substitute Volume (K) Forecast, by Application 2020 & 2033
- Table 15: Canada Next Generation Sugar Substitute Revenue (undefined) Forecast, by Application 2020 & 2033
- Table 16: Canada Next Generation Sugar Substitute Volume (K) Forecast, by Application 2020 & 2033
- Table 17: Mexico Next Generation Sugar Substitute Revenue (undefined) Forecast, by Application 2020 & 2033
- Table 18: Mexico Next Generation Sugar Substitute Volume (K) Forecast, by Application 2020 & 2033
- Table 19: Global Next Generation Sugar Substitute Revenue undefined Forecast, by Application 2020 & 2033
- Table 20: Global Next Generation Sugar Substitute Volume K Forecast, by Application 2020 & 2033
- Table 21: Global Next Generation Sugar Substitute Revenue undefined Forecast, by Type 2020 & 2033
- Table 22: Global Next Generation Sugar Substitute Volume K Forecast, by Type 2020 & 2033
- Table 23: Global Next Generation Sugar Substitute Revenue undefined Forecast, by Country 2020 & 2033
- Table 24: Global Next Generation Sugar Substitute Volume K Forecast, by Country 2020 & 2033
- Table 25: Brazil Next Generation Sugar Substitute Revenue (undefined) Forecast, by Application 2020 & 2033
- Table 26: Brazil Next Generation Sugar Substitute Volume (K) Forecast, by Application 2020 & 2033
- Table 27: Argentina Next Generation Sugar Substitute Revenue (undefined) Forecast, by Application 2020 & 2033
- Table 28: Argentina Next Generation Sugar Substitute Volume (K) Forecast, by Application 2020 & 2033
- Table 29: Rest of South America Next Generation Sugar Substitute Revenue (undefined) Forecast, by Application 2020 & 2033
- Table 30: Rest of South America Next Generation Sugar Substitute Volume (K) Forecast, by Application 2020 & 2033
- Table 31: Global Next Generation Sugar Substitute Revenue undefined Forecast, by Application 2020 & 2033
- Table 32: Global Next Generation Sugar Substitute Volume K Forecast, by Application 2020 & 2033
- Table 33: Global Next Generation Sugar Substitute Revenue undefined Forecast, by Type 2020 & 2033
- Table 34: Global Next Generation Sugar Substitute Volume K Forecast, by Type 2020 & 2033
- Table 35: Global Next Generation Sugar Substitute Revenue undefined Forecast, by Country 2020 & 2033
- Table 36: Global Next Generation Sugar Substitute Volume K Forecast, by Country 2020 & 2033
- Table 37: United Kingdom Next Generation Sugar Substitute Revenue (undefined) Forecast, by Application 2020 & 2033
- Table 38: United Kingdom Next Generation Sugar Substitute Volume (K) Forecast, by Application 2020 & 2033
- Table 39: Germany Next Generation Sugar Substitute Revenue (undefined) Forecast, by Application 2020 & 2033
- Table 40: Germany Next Generation Sugar Substitute Volume (K) Forecast, by Application 2020 & 2033
- Table 41: France Next Generation Sugar Substitute Revenue (undefined) Forecast, by Application 2020 & 2033
- Table 42: France Next Generation Sugar Substitute Volume (K) Forecast, by Application 2020 & 2033
- Table 43: Italy Next Generation Sugar Substitute Revenue (undefined) Forecast, by Application 2020 & 2033
- Table 44: Italy Next Generation Sugar Substitute Volume (K) Forecast, by Application 2020 & 2033
- Table 45: Spain Next Generation Sugar Substitute Revenue (undefined) Forecast, by Application 2020 & 2033
- Table 46: Spain Next Generation Sugar Substitute Volume (K) Forecast, by Application 2020 & 2033
- Table 47: Russia Next Generation Sugar Substitute Revenue (undefined) Forecast, by Application 2020 & 2033
- Table 48: Russia Next Generation Sugar Substitute Volume (K) Forecast, by Application 2020 & 2033
- Table 49: Benelux Next Generation Sugar Substitute Revenue (undefined) Forecast, by Application 2020 & 2033
- Table 50: Benelux Next Generation Sugar Substitute Volume (K) Forecast, by Application 2020 & 2033
- Table 51: Nordics Next Generation Sugar Substitute Revenue (undefined) Forecast, by Application 2020 & 2033
- Table 52: Nordics Next Generation Sugar Substitute Volume (K) Forecast, by Application 2020 & 2033
- Table 53: Rest of Europe Next Generation Sugar Substitute Revenue (undefined) Forecast, by Application 2020 & 2033
- Table 54: Rest of Europe Next Generation Sugar Substitute Volume (K) Forecast, by Application 2020 & 2033
- Table 55: Global Next Generation Sugar Substitute Revenue undefined Forecast, by Application 2020 & 2033
- Table 56: Global Next Generation Sugar Substitute Volume K Forecast, by Application 2020 & 2033
- Table 57: Global Next Generation Sugar Substitute Revenue undefined Forecast, by Type 2020 & 2033
- Table 58: Global Next Generation Sugar Substitute Volume K Forecast, by Type 2020 & 2033
- Table 59: Global Next Generation Sugar Substitute Revenue undefined Forecast, by Country 2020 & 2033
- Table 60: Global Next Generation Sugar Substitute Volume K Forecast, by Country 2020 & 2033
- Table 61: Turkey Next Generation Sugar Substitute Revenue (undefined) Forecast, by Application 2020 & 2033
- Table 62: Turkey Next Generation Sugar Substitute Volume (K) Forecast, by Application 2020 & 2033
- Table 63: Israel Next Generation Sugar Substitute Revenue (undefined) Forecast, by Application 2020 & 2033
- Table 64: Israel Next Generation Sugar Substitute Volume (K) Forecast, by Application 2020 & 2033
- Table 65: GCC Next Generation Sugar Substitute Revenue (undefined) Forecast, by Application 2020 & 2033
- Table 66: GCC Next Generation Sugar Substitute Volume (K) Forecast, by Application 2020 & 2033
- Table 67: North Africa Next Generation Sugar Substitute Revenue (undefined) Forecast, by Application 2020 & 2033
- Table 68: North Africa Next Generation Sugar Substitute Volume (K) Forecast, by Application 2020 & 2033
- Table 69: South Africa Next Generation Sugar Substitute Revenue (undefined) Forecast, by Application 2020 & 2033
- Table 70: South Africa Next Generation Sugar Substitute Volume (K) Forecast, by Application 2020 & 2033
- Table 71: Rest of Middle East & Africa Next Generation Sugar Substitute Revenue (undefined) Forecast, by Application 2020 & 2033
- Table 72: Rest of Middle East & Africa Next Generation Sugar Substitute Volume (K) Forecast, by Application 2020 & 2033
- Table 73: Global Next Generation Sugar Substitute Revenue undefined Forecast, by Application 2020 & 2033
- Table 74: Global Next Generation Sugar Substitute Volume K Forecast, by Application 2020 & 2033
- Table 75: Global Next Generation Sugar Substitute Revenue undefined Forecast, by Type 2020 & 2033
- Table 76: Global Next Generation Sugar Substitute Volume K Forecast, by Type 2020 & 2033
- Table 77: Global Next Generation Sugar Substitute Revenue undefined Forecast, by Country 2020 & 2033
- Table 78: Global Next Generation Sugar Substitute Volume K Forecast, by Country 2020 & 2033
- Table 79: China Next Generation Sugar Substitute Revenue (undefined) Forecast, by Application 2020 & 2033
- Table 80: China Next Generation Sugar Substitute Volume (K) Forecast, by Application 2020 & 2033
- Table 81: India Next Generation Sugar Substitute Revenue (undefined) Forecast, by Application 2020 & 2033
- Table 82: India Next Generation Sugar Substitute Volume (K) Forecast, by Application 2020 & 2033
- Table 83: Japan Next Generation Sugar Substitute Revenue (undefined) Forecast, by Application 2020 & 2033
- Table 84: Japan Next Generation Sugar Substitute Volume (K) Forecast, by Application 2020 & 2033
- Table 85: South Korea Next Generation Sugar Substitute Revenue (undefined) Forecast, by Application 2020 & 2033
- Table 86: South Korea Next Generation Sugar Substitute Volume (K) Forecast, by Application 2020 & 2033
- Table 87: ASEAN Next Generation Sugar Substitute Revenue (undefined) Forecast, by Application 2020 & 2033
- Table 88: ASEAN Next Generation Sugar Substitute Volume (K) Forecast, by Application 2020 & 2033
- Table 89: Oceania Next Generation Sugar Substitute Revenue (undefined) Forecast, by Application 2020 & 2033
- Table 90: Oceania Next Generation Sugar Substitute Volume (K) Forecast, by Application 2020 & 2033
- Table 91: Rest of Asia Pacific Next Generation Sugar Substitute Revenue (undefined) Forecast, by Application 2020 & 2033
- Table 92: Rest of Asia Pacific Next Generation Sugar Substitute Volume (K) Forecast, by Application 2020 & 2033
Frequently Asked Questions
1. What is the projected Compound Annual Growth Rate (CAGR) of the Next Generation Sugar Substitute?
The projected CAGR is approximately 6.6%.
2. Which companies are prominent players in the Next Generation Sugar Substitute?
Key companies in the market include Tate & Lyle, Cargill, Matsutani Chemical, Ingredion, Arla Foods, ADM, CJ CheilJedang, NuNaturals, Howtian, Samyang, Damhert, Spherix, Beneo, Bailong Chuangyuan, Shandong Shengxiangyuan.
3. What are the main segments of the Next Generation Sugar Substitute?
The market segments include Application, Type.
4. Can you provide details about the market size?
The market size is estimated to be USD XXX N/A as of 2022.
5. What are some drivers contributing to market growth?
N/A
6. What are the notable trends driving market growth?
N/A
7. Are there any restraints impacting market growth?
N/A
8. Can you provide examples of recent developments in the market?
N/A
9. What pricing options are available for accessing the report?
Pricing options include single-user, multi-user, and enterprise licenses priced at USD 3950.00, USD 5925.00, and USD 7900.00 respectively.
10. Is the market size provided in terms of value or volume?
The market size is provided in terms of value, measured in N/A and volume, measured in K.
11. Are there any specific market keywords associated with the report?
Yes, the market keyword associated with the report is "Next Generation Sugar Substitute," which aids in identifying and referencing the specific market segment covered.
12. How do I determine which pricing option suits my needs best?
The pricing options vary based on user requirements and access needs. Individual users may opt for single-user licenses, while businesses requiring broader access may choose multi-user or enterprise licenses for cost-effective access to the report.
13. Are there any additional resources or data provided in the Next Generation Sugar Substitute report?
While the report offers comprehensive insights, it's advisable to review the specific contents or supplementary materials provided to ascertain if additional resources or data are available.
14. How can I stay updated on further developments or reports in the Next Generation Sugar Substitute?
To stay informed about further developments, trends, and reports in the Next Generation Sugar Substitute, consider subscribing to industry newsletters, following relevant companies and organizations, or regularly checking reputable industry news sources and publications.
Methodology
Step 1 - Identification of Relevant Samples Size from Population Database


Step 2 - Approaches for Defining Global Market Size (Value, Volume* & Price*)

Note*: In applicable scenarios
Step 3 - Data Sources
Primary Research
- Web Analytics
- Survey Reports
- Research Institute
- Latest Research Reports
- Opinion Leaders
Secondary Research
- Annual Reports
- White Paper
- Latest Press Release
- Industry Association
- Paid Database
- Investor Presentations

Step 4 - Data Triangulation
Involves using different sources of information in order to increase the validity of a study
These sources are likely to be stakeholders in a program - participants, other researchers, program staff, other community members, and so on.
Then we put all data in single framework & apply various statistical tools to find out the dynamic on the market.
During the analysis stage, feedback from the stakeholder groups would be compared to determine areas of agreement as well as areas of divergence