

Key Insights
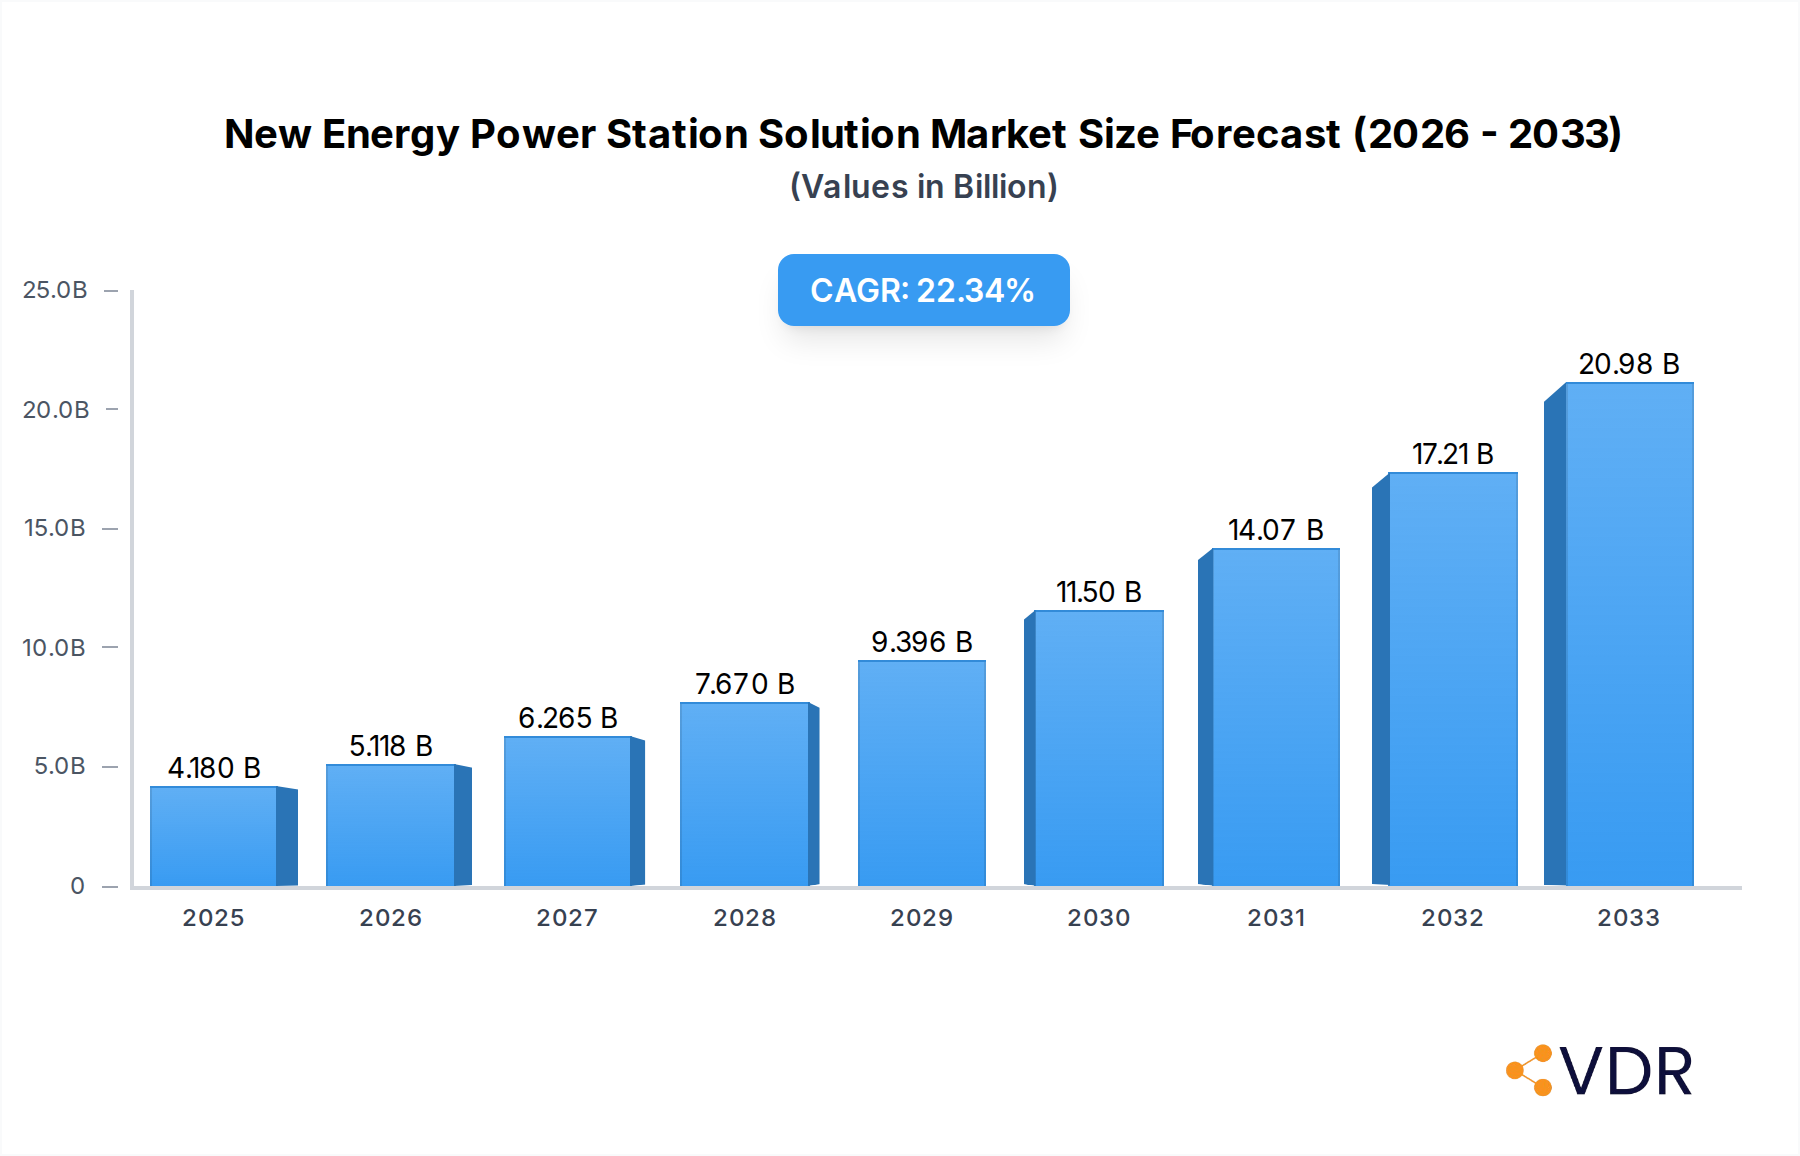
The New Energy Power Station Solution market is poised for remarkable expansion, projecting a market size of $4.18 billion in 2025, with an impressive CAGR of 22.4% anticipated through 2033. This robust growth is primarily fueled by a confluence of powerful drivers, including escalating global demand for sustainable energy, favorable government policies and incentives promoting renewable energy adoption, and significant technological advancements in areas like energy storage and smart grid integration. The urgent need to decarbonize energy infrastructure to combat climate change is a paramount catalyst, pushing investments towards cleaner and more efficient power generation solutions. Furthermore, the increasing affordability and efficiency of renewable energy technologies, particularly solar and wind, are making them increasingly competitive with traditional fossil fuel sources, driving widespread adoption across various sectors.

New Energy Power Station Solution Market Size (In Billion)
The market is characterized by dynamic trends that are shaping its trajectory. The burgeoning adoption of distributed photovoltaic power plants, alongside the continued development of large-scale centralized solar and wind farms, signifies a dual approach to energy generation. Key applications span agriculture, where renewable energy offers cost savings and independence; commercial enterprises seeking to reduce their carbon footprint and operational expenses; and industrial sectors looking for reliable and sustainable power sources. Leading companies are actively investing in research and development, strategic collaborations, and geographical expansion to capture market share. While the growth trajectory is exceptionally strong, potential restraints could emerge from grid integration challenges, the need for substantial upfront investment in infrastructure, and the intermittent nature of some renewable sources, though advancements in energy storage are steadily mitigating these concerns.
New Energy Power Station Solution Company Market Share
New Energy Power Station Solution: Comprehensive Market Report (2019–2033)
This in-depth report provides a comprehensive analysis of the New Energy Power Station Solution market, encompassing market dynamics, growth trends, regional dominance, product innovations, key drivers and barriers, emerging opportunities, growth accelerators, and a detailed outlook for the future. The study period covers 2019–2033, with a base year of 2025 and a forecast period from 2025–2033.
New Energy Power Station Solution Market Dynamics & Structure
The global New Energy Power Station Solution market is characterized by a dynamic interplay of technological advancements, evolving regulatory landscapes, and increasing investor interest. Market concentration is moderate, with a mix of large multinational corporations and emerging players vying for market share. Technological innovation is a primary driver, fueled by ongoing research and development in areas like solar panel efficiency, battery storage integration, and smart grid technologies. Regulatory frameworks play a crucial role, with government incentives, renewable energy targets, and grid interconnection policies significantly influencing market growth. Competitive product substitutes, primarily traditional fossil fuel-based power generation, are gradually being phased out as the economic viability and environmental benefits of new energy solutions become more pronounced. End-user demographics are diverse, spanning agriculture, commercial enterprises, industrial facilities, and other sectors, each with unique energy demands and adoption patterns. Mergers and acquisitions (M&A) are a notable trend, with larger companies acquiring smaller, innovative firms to expand their portfolios and market reach.
- Market Concentration: Moderate, with key players like General Electric, Siemens Energy, and ABB holding significant but not dominant market shares.
- Technological Innovation Drivers: Increased efficiency of solar PV modules (e.g., LONGi, Trina Solar), advanced battery storage solutions (e.g., Huawei, Sungrow Power), and smart grid integration technologies.
- Regulatory Frameworks: Government subsidies for renewable energy, carbon emission reduction targets, and favorable feed-in tariffs are critical enablers.
- Competitive Product Substitutes: Phasing out of coal and natural gas power plants, driving demand for cleaner alternatives.
- End-User Demographics: Growing adoption in industrial and commercial sectors seeking cost savings and sustainability.
- M&A Trends: Active consolidation, with an estimated XX billion in deal volume over the historical period, aimed at acquiring new technologies and market access.
New Energy Power Station Solution Growth Trends & Insights
The New Energy Power Station Solution market is poised for substantial growth, driven by the urgent need for sustainable energy sources and supportive governmental policies. Market size is projected to expand significantly, with a projected Compound Annual Growth Rate (CAGR) of XX% from 2025 to 2033. Adoption rates for new energy power stations are accelerating across various applications, reflecting increased environmental awareness and the declining cost of renewable energy technologies. Technological disruptions are at the forefront of this evolution, with advancements in energy storage, artificial intelligence for grid management, and the integration of distributed energy resources (DERs) transforming the power landscape. Consumer behavior shifts are also a key factor, with businesses and governments increasingly prioritizing energy independence, reduced carbon footprints, and long-term cost predictability offered by new energy solutions. The parent market for global energy infrastructure is estimated to be valued at over $XX trillion, with the new energy power station solution segment representing a rapidly growing sub-sector. The child market, specifically focusing on residential and small-scale commercial solar installations, is also witnessing robust expansion.
- Market Size Evolution: Expected to grow from an estimated $XX billion in 2025 to over $XX billion by 2033.
- Adoption Rates: Steadily increasing across industrial, commercial, and agricultural sectors due to economic and environmental benefits.
- Technological Disruptions: Advancements in perovskite solar cells, solid-state batteries, and advanced inverters (e.g., SMA Solar, GoodWe) are key disruptors.
- Consumer Behavior Shifts: Growing preference for green energy, energy security, and smart energy management systems.
- Market Penetration: Expected to reach XX% by 2033, indicating widespread adoption.
Dominant Regions, Countries, or Segments in New Energy Power Station Solution
The global New Energy Power Station Solution market is currently dominated by regions and countries with strong policy support, favorable renewable energy resources, and significant investments in infrastructure development. Asia-Pacific, particularly China, is a leading region due to its aggressive renewable energy targets, substantial manufacturing capacity for solar and wind components, and a rapidly growing industrial and commercial sector demanding clean energy. The Industrial segment, driven by its high energy consumption and the need for reliable, cost-effective, and sustainable power, is emerging as a dominant application. Within the Types of power stations, Centralized Photovoltaic Power Plant solutions are currently leading due to economies of scale and the ability to cater to large-scale energy demands, although distributed solutions are gaining traction.
- Dominant Region: Asia-Pacific, with a market share of XX% in 2025, driven by China's massive renewable energy deployment.
- Key Drivers in Asia-Pacific: Strong government mandates, declining renewable energy costs, and robust industrial growth.
- Market Share in Asia-Pacific: Expected to reach XX% by 2033.
- Leading Country: China, accounting for a significant portion of global solar PV and wind turbine installations.
- Economic Policies: Favorable tax incentives, subsidies, and feed-in tariffs.
- Infrastructure Development: Extensive investments in grid modernization and transmission lines to support renewable integration.
- Dominant Application Segment: Industrial applications, representing an estimated market share of XX% in 2025.
- Growth Potential in Industrial: Driven by corporate sustainability goals, energy cost optimization, and regulatory compliance.
- Key Industries: Manufacturing, data centers, and heavy industry are major adopters.
- Dominant Type Segment: Centralized Photovoltaic Power Plant, holding an estimated XX% of the market in 2025.
- Advantages: Economies of scale, efficient land utilization for large-scale projects, and simplified grid integration for bulk power supply.
- Growth Potential: Continued demand for utility-scale renewable energy projects globally.
New Energy Power Station Solution Product Landscape
The product landscape for New Energy Power Station Solutions is characterized by continuous innovation focused on enhancing efficiency, reliability, and cost-effectiveness. Key product advancements include high-efficiency solar photovoltaic (PV) modules with improved energy conversion rates, advanced inverters that optimize power output and grid interaction, and sophisticated battery energy storage systems (BESS) offering greater capacity and faster charging. Integrated solutions combining solar PV, wind turbines, and BESS are becoming increasingly common, providing a more stable and resilient power supply. Smart grid connectivity and digital monitoring solutions from companies like Yokogawa Electric Corporation and Huawei enable real-time performance optimization and predictive maintenance. Unique selling propositions revolve around delivering a complete, turn-key power station solution that minimizes downtime and maximizes energy yield, tailored to specific application needs in agriculture, commercial, and industrial settings.
Key Drivers, Barriers & Challenges in New Energy Power Station Solution
Key Drivers:
- Environmental Concerns & Climate Change Initiatives: Global pressure to reduce carbon emissions is a primary catalyst.
- Declining Renewable Energy Costs: Solar PV and wind technologies are becoming increasingly competitive with traditional energy sources.
- Government Policies & Incentives: Subsidies, tax credits, and renewable energy mandates accelerate adoption.
- Technological Advancements: Improved efficiency, storage capabilities, and grid integration solutions enhance performance.
- Energy Independence & Security: Desire to reduce reliance on fossil fuels and volatile global energy markets.
Barriers & Challenges:
- Intermittency of Renewable Sources: Reliance on solar and wind necessitates robust energy storage solutions.
- Grid Integration & Infrastructure: Upgrading existing grids to accommodate large-scale renewable energy input requires significant investment.
- High Upfront Capital Costs: While operational costs are low, initial investment can be substantial.
- Supply Chain Disruptions: Geopolitical factors and manufacturing bottlenecks can impact component availability and pricing.
- Regulatory & Permitting Hurdles: Complex and time-consuming approval processes can slow down project development.
- Competition from Established Energy Providers: Incumbent fossil fuel industries can pose significant market resistance.
Emerging Opportunities in New Energy Power Station Solution
Emerging opportunities in the New Energy Power Station Solution sector are abundant, driven by evolving energy demands and technological frontiers. The expansion into developing economies with nascent energy infrastructure presents a significant untapped market. Innovative applications in sectors like agriculture, such as solar-powered irrigation systems and vertical farming, offer substantial growth potential. The increasing demand for smart microgrids and off-grid solutions for remote communities and critical infrastructure (e.g., hospitals, data centers) is another key opportunity. Furthermore, the integration of artificial intelligence and machine learning for predictive maintenance, load forecasting, and energy trading within power station solutions is creating new avenues for value creation. The development of green hydrogen production powered by renewable energy is also poised to become a major growth area.
Growth Accelerators in the New Energy Power Station Industry
Long-term growth in the New Energy Power Station industry is being significantly accelerated by several key factors. Technological breakthroughs, such as advancements in next-generation solar cell technologies and more efficient battery chemistries, are continuously improving performance and reducing costs. Strategic partnerships between technology providers, project developers, and financial institutions are crucial for mobilizing capital and de-risking investments, enabling larger-scale deployments. Market expansion strategies, including entering new geographical regions and targeting underserved sectors, are broadening the reach of new energy solutions. The growing emphasis on a circular economy and sustainable manufacturing practices within the renewable energy sector also contributes to long-term viability and investor confidence.
Key Players Shaping the New Energy Power Station Market
General Electric Shell Siemens Energy ABB Hitachi ReNew Power Fortum Tata Power Statkraft ACWA Power Black & Veatch Mitsubishi Corporation Yokogawa Electric Corporation Sungrow Power GoodWe Trina Solar Chint New Energy SMA Solar JA Solar Huawei Risen Energy LONGi State Power Rixin Tech
Notable Milestones in New Energy Power Station Solution Sector
- 2019: Launch of advanced high-efficiency solar modules by LONGi Solar, setting new industry benchmarks.
- 2020: Significant increase in global investments in offshore wind power projects, driven by government targets and technological advancements.
- 2021: Major battery storage system deployments by Huawei in utility-scale solar power plants, enhancing grid stability.
- 2022: Siemens Energy's breakthrough in gas turbine technology for cleaner fossil fuel power generation, alongside significant investments in hydrogen fuel solutions.
- 2023: Shell's strategic acquisitions in renewable energy companies, expanding its portfolio beyond traditional oil and gas.
- 2024: Increased government commitments towards renewable energy targets in major economies, boosting project pipeline development.
In-Depth New Energy Power Station Solution Market Outlook
The future market outlook for New Energy Power Station Solutions is exceptionally strong, driven by a convergence of favorable market forces. Growth accelerators such as continuous technological innovation in solar PV efficiency (e.g., Sungrow Power, JA Solar), advanced battery storage (e.g., Risen Energy, Chint New Energy), and smart grid integration (e.g., ABB, State Power Rixin Tech) will continue to reduce costs and improve performance. Strategic partnerships between energy majors like Shell and dedicated renewable energy developers like ReNew Power will unlock significant capital for large-scale projects. Market expansion into emerging economies and the increasing adoption of decentralized energy systems are creating vast new opportunities. The global imperative to achieve net-zero emissions will ensure sustained policy support and investor interest, making the New Energy Power Station Solution market a cornerstone of the future global energy landscape.
New Energy Power Station Solution Segmentation
-
1. Application
- 1.1. Agriculture
- 1.2. Commercial
- 1.3. Industrial
- 1.4. Other
-
2. Types
- 2.1. Centralized Photovoltaic Power Plant
- 2.2. Distributed Photovoltaic Power Plant
- 2.3. Other
New Energy Power Station Solution Segmentation By Geography
-
1. North America
- 1.1. United States
- 1.2. Canada
- 1.3. Mexico
-
2. South America
- 2.1. Brazil
- 2.2. Argentina
- 2.3. Rest of South America
-
3. Europe
- 3.1. United Kingdom
- 3.2. Germany
- 3.3. France
- 3.4. Italy
- 3.5. Spain
- 3.6. Russia
- 3.7. Benelux
- 3.8. Nordics
- 3.9. Rest of Europe
-
4. Middle East & Africa
- 4.1. Turkey
- 4.2. Israel
- 4.3. GCC
- 4.4. North Africa
- 4.5. South Africa
- 4.6. Rest of Middle East & Africa
-
5. Asia Pacific
- 5.1. China
- 5.2. India
- 5.3. Japan
- 5.4. South Korea
- 5.5. ASEAN
- 5.6. Oceania
- 5.7. Rest of Asia Pacific
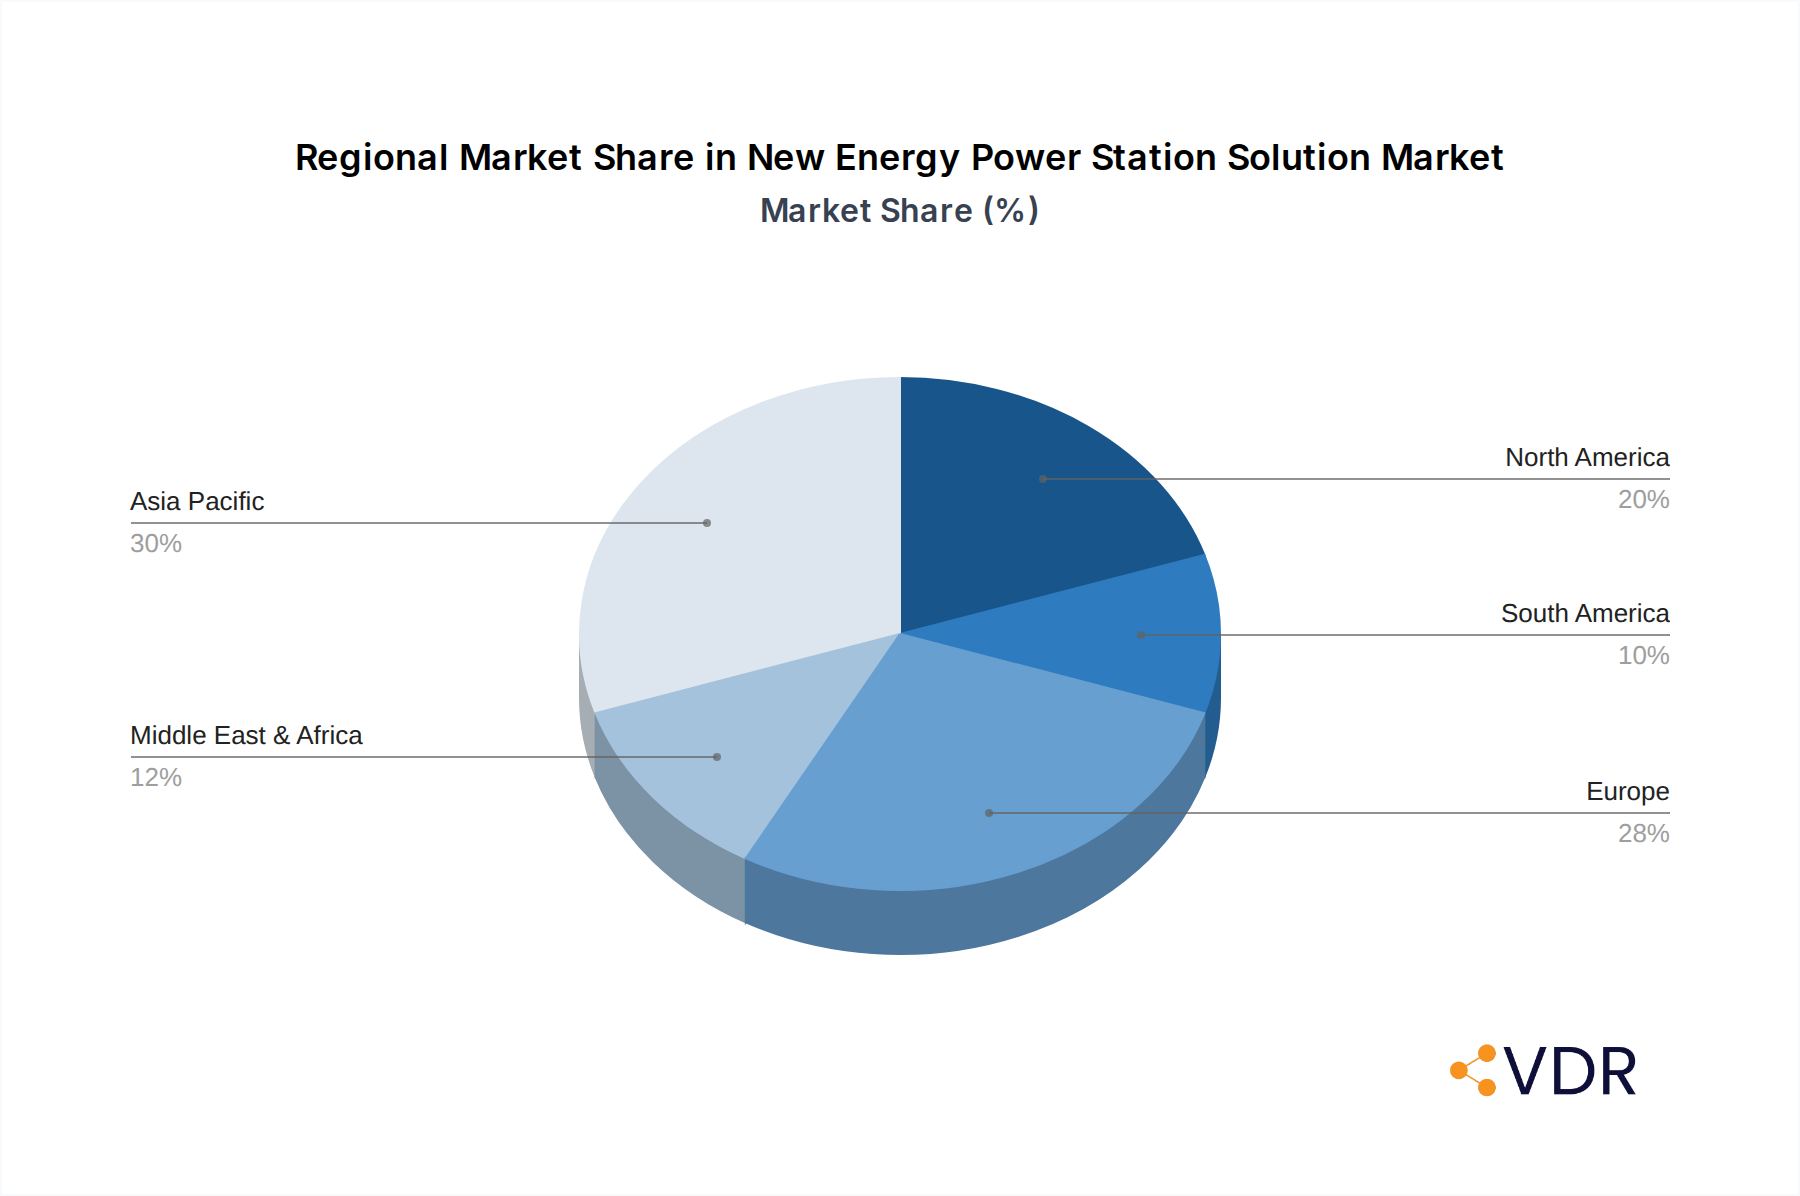
New Energy Power Station Solution Regional Market Share
Geographic Coverage of New Energy Power Station Solution
New Energy Power Station Solution REPORT HIGHLIGHTS
| Aspects | Details |
|---|---|
| Study Period | 2020-2034 |
| Base Year | 2025 |
| Estimated Year | 2026 |
| Forecast Period | 2026-2034 |
| Historical Period | 2020-2025 |
| Growth Rate | CAGR of 22.4% from 2020-2034 |
| Segmentation |
|
Table of Contents
- 1. Introduction
- 1.1. Research Scope
- 1.2. Market Segmentation
- 1.3. Research Methodology
- 1.4. Definitions and Assumptions
- 2. Executive Summary
- 2.1. Introduction
- 3. Market Dynamics
- 3.1. Introduction
- 3.2. Market Drivers
- 3.3. Market Restrains
- 3.4. Market Trends
- 4. Market Factor Analysis
- 4.1. Porters Five Forces
- 4.2. Supply/Value Chain
- 4.3. PESTEL analysis
- 4.4. Market Entropy
- 4.5. Patent/Trademark Analysis
- 5. Global New Energy Power Station Solution Analysis, Insights and Forecast, 2020-2032
- 5.1. Market Analysis, Insights and Forecast - by Application
- 5.1.1. Agriculture
- 5.1.2. Commercial
- 5.1.3. Industrial
- 5.1.4. Other
- 5.2. Market Analysis, Insights and Forecast - by Types
- 5.2.1. Centralized Photovoltaic Power Plant
- 5.2.2. Distributed Photovoltaic Power Plant
- 5.2.3. Other
- 5.3. Market Analysis, Insights and Forecast - by Region
- 5.3.1. North America
- 5.3.2. South America
- 5.3.3. Europe
- 5.3.4. Middle East & Africa
- 5.3.5. Asia Pacific
- 5.1. Market Analysis, Insights and Forecast - by Application
- 6. North America New Energy Power Station Solution Analysis, Insights and Forecast, 2020-2032
- 6.1. Market Analysis, Insights and Forecast - by Application
- 6.1.1. Agriculture
- 6.1.2. Commercial
- 6.1.3. Industrial
- 6.1.4. Other
- 6.2. Market Analysis, Insights and Forecast - by Types
- 6.2.1. Centralized Photovoltaic Power Plant
- 6.2.2. Distributed Photovoltaic Power Plant
- 6.2.3. Other
- 6.1. Market Analysis, Insights and Forecast - by Application
- 7. South America New Energy Power Station Solution Analysis, Insights and Forecast, 2020-2032
- 7.1. Market Analysis, Insights and Forecast - by Application
- 7.1.1. Agriculture
- 7.1.2. Commercial
- 7.1.3. Industrial
- 7.1.4. Other
- 7.2. Market Analysis, Insights and Forecast - by Types
- 7.2.1. Centralized Photovoltaic Power Plant
- 7.2.2. Distributed Photovoltaic Power Plant
- 7.2.3. Other
- 7.1. Market Analysis, Insights and Forecast - by Application
- 8. Europe New Energy Power Station Solution Analysis, Insights and Forecast, 2020-2032
- 8.1. Market Analysis, Insights and Forecast - by Application
- 8.1.1. Agriculture
- 8.1.2. Commercial
- 8.1.3. Industrial
- 8.1.4. Other
- 8.2. Market Analysis, Insights and Forecast - by Types
- 8.2.1. Centralized Photovoltaic Power Plant
- 8.2.2. Distributed Photovoltaic Power Plant
- 8.2.3. Other
- 8.1. Market Analysis, Insights and Forecast - by Application
- 9. Middle East & Africa New Energy Power Station Solution Analysis, Insights and Forecast, 2020-2032
- 9.1. Market Analysis, Insights and Forecast - by Application
- 9.1.1. Agriculture
- 9.1.2. Commercial
- 9.1.3. Industrial
- 9.1.4. Other
- 9.2. Market Analysis, Insights and Forecast - by Types
- 9.2.1. Centralized Photovoltaic Power Plant
- 9.2.2. Distributed Photovoltaic Power Plant
- 9.2.3. Other
- 9.1. Market Analysis, Insights and Forecast - by Application
- 10. Asia Pacific New Energy Power Station Solution Analysis, Insights and Forecast, 2020-2032
- 10.1. Market Analysis, Insights and Forecast - by Application
- 10.1.1. Agriculture
- 10.1.2. Commercial
- 10.1.3. Industrial
- 10.1.4. Other
- 10.2. Market Analysis, Insights and Forecast - by Types
- 10.2.1. Centralized Photovoltaic Power Plant
- 10.2.2. Distributed Photovoltaic Power Plant
- 10.2.3. Other
- 10.1. Market Analysis, Insights and Forecast - by Application
- 11. Competitive Analysis
- 11.1. Global Market Share Analysis 2025
- 11.2. Company Profiles
- 11.2.1 General Electric
- 11.2.1.1. Overview
- 11.2.1.2. Products
- 11.2.1.3. SWOT Analysis
- 11.2.1.4. Recent Developments
- 11.2.1.5. Financials (Based on Availability)
- 11.2.2 Shell
- 11.2.2.1. Overview
- 11.2.2.2. Products
- 11.2.2.3. SWOT Analysis
- 11.2.2.4. Recent Developments
- 11.2.2.5. Financials (Based on Availability)
- 11.2.3 Siemens Energy
- 11.2.3.1. Overview
- 11.2.3.2. Products
- 11.2.3.3. SWOT Analysis
- 11.2.3.4. Recent Developments
- 11.2.3.5. Financials (Based on Availability)
- 11.2.4 ABB
- 11.2.4.1. Overview
- 11.2.4.2. Products
- 11.2.4.3. SWOT Analysis
- 11.2.4.4. Recent Developments
- 11.2.4.5. Financials (Based on Availability)
- 11.2.5 Hitachi
- 11.2.5.1. Overview
- 11.2.5.2. Products
- 11.2.5.3. SWOT Analysis
- 11.2.5.4. Recent Developments
- 11.2.5.5. Financials (Based on Availability)
- 11.2.6 ReNew Power
- 11.2.6.1. Overview
- 11.2.6.2. Products
- 11.2.6.3. SWOT Analysis
- 11.2.6.4. Recent Developments
- 11.2.6.5. Financials (Based on Availability)
- 11.2.7 Fortum
- 11.2.7.1. Overview
- 11.2.7.2. Products
- 11.2.7.3. SWOT Analysis
- 11.2.7.4. Recent Developments
- 11.2.7.5. Financials (Based on Availability)
- 11.2.8 Tata Power
- 11.2.8.1. Overview
- 11.2.8.2. Products
- 11.2.8.3. SWOT Analysis
- 11.2.8.4. Recent Developments
- 11.2.8.5. Financials (Based on Availability)
- 11.2.9 Statkraft
- 11.2.9.1. Overview
- 11.2.9.2. Products
- 11.2.9.3. SWOT Analysis
- 11.2.9.4. Recent Developments
- 11.2.9.5. Financials (Based on Availability)
- 11.2.10 ACWA Power
- 11.2.10.1. Overview
- 11.2.10.2. Products
- 11.2.10.3. SWOT Analysis
- 11.2.10.4. Recent Developments
- 11.2.10.5. Financials (Based on Availability)
- 11.2.11 Black & Veatch
- 11.2.11.1. Overview
- 11.2.11.2. Products
- 11.2.11.3. SWOT Analysis
- 11.2.11.4. Recent Developments
- 11.2.11.5. Financials (Based on Availability)
- 11.2.12 Mitsubishi Corporation
- 11.2.12.1. Overview
- 11.2.12.2. Products
- 11.2.12.3. SWOT Analysis
- 11.2.12.4. Recent Developments
- 11.2.12.5. Financials (Based on Availability)
- 11.2.13 Yokogawa Electric Corporation
- 11.2.13.1. Overview
- 11.2.13.2. Products
- 11.2.13.3. SWOT Analysis
- 11.2.13.4. Recent Developments
- 11.2.13.5. Financials (Based on Availability)
- 11.2.14 Sungrow Power
- 11.2.14.1. Overview
- 11.2.14.2. Products
- 11.2.14.3. SWOT Analysis
- 11.2.14.4. Recent Developments
- 11.2.14.5. Financials (Based on Availability)
- 11.2.15 GoodWe
- 11.2.15.1. Overview
- 11.2.15.2. Products
- 11.2.15.3. SWOT Analysis
- 11.2.15.4. Recent Developments
- 11.2.15.5. Financials (Based on Availability)
- 11.2.16 Trina Solar
- 11.2.16.1. Overview
- 11.2.16.2. Products
- 11.2.16.3. SWOT Analysis
- 11.2.16.4. Recent Developments
- 11.2.16.5. Financials (Based on Availability)
- 11.2.17 Chint New Energy
- 11.2.17.1. Overview
- 11.2.17.2. Products
- 11.2.17.3. SWOT Analysis
- 11.2.17.4. Recent Developments
- 11.2.17.5. Financials (Based on Availability)
- 11.2.18 SMA Solar
- 11.2.18.1. Overview
- 11.2.18.2. Products
- 11.2.18.3. SWOT Analysis
- 11.2.18.4. Recent Developments
- 11.2.18.5. Financials (Based on Availability)
- 11.2.19 JA Solar
- 11.2.19.1. Overview
- 11.2.19.2. Products
- 11.2.19.3. SWOT Analysis
- 11.2.19.4. Recent Developments
- 11.2.19.5. Financials (Based on Availability)
- 11.2.20 Huawei
- 11.2.20.1. Overview
- 11.2.20.2. Products
- 11.2.20.3. SWOT Analysis
- 11.2.20.4. Recent Developments
- 11.2.20.5. Financials (Based on Availability)
- 11.2.21 Risen Energy
- 11.2.21.1. Overview
- 11.2.21.2. Products
- 11.2.21.3. SWOT Analysis
- 11.2.21.4. Recent Developments
- 11.2.21.5. Financials (Based on Availability)
- 11.2.22 LONGi
- 11.2.22.1. Overview
- 11.2.22.2. Products
- 11.2.22.3. SWOT Analysis
- 11.2.22.4. Recent Developments
- 11.2.22.5. Financials (Based on Availability)
- 11.2.23 State Power Rixin Tech
- 11.2.23.1. Overview
- 11.2.23.2. Products
- 11.2.23.3. SWOT Analysis
- 11.2.23.4. Recent Developments
- 11.2.23.5. Financials (Based on Availability)
- 11.2.1 General Electric
List of Figures
- Figure 1: Global New Energy Power Station Solution Revenue Breakdown (undefined, %) by Region 2025 & 2033
- Figure 2: North America New Energy Power Station Solution Revenue (undefined), by Application 2025 & 2033
- Figure 3: North America New Energy Power Station Solution Revenue Share (%), by Application 2025 & 2033
- Figure 4: North America New Energy Power Station Solution Revenue (undefined), by Types 2025 & 2033
- Figure 5: North America New Energy Power Station Solution Revenue Share (%), by Types 2025 & 2033
- Figure 6: North America New Energy Power Station Solution Revenue (undefined), by Country 2025 & 2033
- Figure 7: North America New Energy Power Station Solution Revenue Share (%), by Country 2025 & 2033
- Figure 8: South America New Energy Power Station Solution Revenue (undefined), by Application 2025 & 2033
- Figure 9: South America New Energy Power Station Solution Revenue Share (%), by Application 2025 & 2033
- Figure 10: South America New Energy Power Station Solution Revenue (undefined), by Types 2025 & 2033
- Figure 11: South America New Energy Power Station Solution Revenue Share (%), by Types 2025 & 2033
- Figure 12: South America New Energy Power Station Solution Revenue (undefined), by Country 2025 & 2033
- Figure 13: South America New Energy Power Station Solution Revenue Share (%), by Country 2025 & 2033
- Figure 14: Europe New Energy Power Station Solution Revenue (undefined), by Application 2025 & 2033
- Figure 15: Europe New Energy Power Station Solution Revenue Share (%), by Application 2025 & 2033
- Figure 16: Europe New Energy Power Station Solution Revenue (undefined), by Types 2025 & 2033
- Figure 17: Europe New Energy Power Station Solution Revenue Share (%), by Types 2025 & 2033
- Figure 18: Europe New Energy Power Station Solution Revenue (undefined), by Country 2025 & 2033
- Figure 19: Europe New Energy Power Station Solution Revenue Share (%), by Country 2025 & 2033
- Figure 20: Middle East & Africa New Energy Power Station Solution Revenue (undefined), by Application 2025 & 2033
- Figure 21: Middle East & Africa New Energy Power Station Solution Revenue Share (%), by Application 2025 & 2033
- Figure 22: Middle East & Africa New Energy Power Station Solution Revenue (undefined), by Types 2025 & 2033
- Figure 23: Middle East & Africa New Energy Power Station Solution Revenue Share (%), by Types 2025 & 2033
- Figure 24: Middle East & Africa New Energy Power Station Solution Revenue (undefined), by Country 2025 & 2033
- Figure 25: Middle East & Africa New Energy Power Station Solution Revenue Share (%), by Country 2025 & 2033
- Figure 26: Asia Pacific New Energy Power Station Solution Revenue (undefined), by Application 2025 & 2033
- Figure 27: Asia Pacific New Energy Power Station Solution Revenue Share (%), by Application 2025 & 2033
- Figure 28: Asia Pacific New Energy Power Station Solution Revenue (undefined), by Types 2025 & 2033
- Figure 29: Asia Pacific New Energy Power Station Solution Revenue Share (%), by Types 2025 & 2033
- Figure 30: Asia Pacific New Energy Power Station Solution Revenue (undefined), by Country 2025 & 2033
- Figure 31: Asia Pacific New Energy Power Station Solution Revenue Share (%), by Country 2025 & 2033
List of Tables
- Table 1: Global New Energy Power Station Solution Revenue undefined Forecast, by Application 2020 & 2033
- Table 2: Global New Energy Power Station Solution Revenue undefined Forecast, by Types 2020 & 2033
- Table 3: Global New Energy Power Station Solution Revenue undefined Forecast, by Region 2020 & 2033
- Table 4: Global New Energy Power Station Solution Revenue undefined Forecast, by Application 2020 & 2033
- Table 5: Global New Energy Power Station Solution Revenue undefined Forecast, by Types 2020 & 2033
- Table 6: Global New Energy Power Station Solution Revenue undefined Forecast, by Country 2020 & 2033
- Table 7: United States New Energy Power Station Solution Revenue (undefined) Forecast, by Application 2020 & 2033
- Table 8: Canada New Energy Power Station Solution Revenue (undefined) Forecast, by Application 2020 & 2033
- Table 9: Mexico New Energy Power Station Solution Revenue (undefined) Forecast, by Application 2020 & 2033
- Table 10: Global New Energy Power Station Solution Revenue undefined Forecast, by Application 2020 & 2033
- Table 11: Global New Energy Power Station Solution Revenue undefined Forecast, by Types 2020 & 2033
- Table 12: Global New Energy Power Station Solution Revenue undefined Forecast, by Country 2020 & 2033
- Table 13: Brazil New Energy Power Station Solution Revenue (undefined) Forecast, by Application 2020 & 2033
- Table 14: Argentina New Energy Power Station Solution Revenue (undefined) Forecast, by Application 2020 & 2033
- Table 15: Rest of South America New Energy Power Station Solution Revenue (undefined) Forecast, by Application 2020 & 2033
- Table 16: Global New Energy Power Station Solution Revenue undefined Forecast, by Application 2020 & 2033
- Table 17: Global New Energy Power Station Solution Revenue undefined Forecast, by Types 2020 & 2033
- Table 18: Global New Energy Power Station Solution Revenue undefined Forecast, by Country 2020 & 2033
- Table 19: United Kingdom New Energy Power Station Solution Revenue (undefined) Forecast, by Application 2020 & 2033
- Table 20: Germany New Energy Power Station Solution Revenue (undefined) Forecast, by Application 2020 & 2033
- Table 21: France New Energy Power Station Solution Revenue (undefined) Forecast, by Application 2020 & 2033
- Table 22: Italy New Energy Power Station Solution Revenue (undefined) Forecast, by Application 2020 & 2033
- Table 23: Spain New Energy Power Station Solution Revenue (undefined) Forecast, by Application 2020 & 2033
- Table 24: Russia New Energy Power Station Solution Revenue (undefined) Forecast, by Application 2020 & 2033
- Table 25: Benelux New Energy Power Station Solution Revenue (undefined) Forecast, by Application 2020 & 2033
- Table 26: Nordics New Energy Power Station Solution Revenue (undefined) Forecast, by Application 2020 & 2033
- Table 27: Rest of Europe New Energy Power Station Solution Revenue (undefined) Forecast, by Application 2020 & 2033
- Table 28: Global New Energy Power Station Solution Revenue undefined Forecast, by Application 2020 & 2033
- Table 29: Global New Energy Power Station Solution Revenue undefined Forecast, by Types 2020 & 2033
- Table 30: Global New Energy Power Station Solution Revenue undefined Forecast, by Country 2020 & 2033
- Table 31: Turkey New Energy Power Station Solution Revenue (undefined) Forecast, by Application 2020 & 2033
- Table 32: Israel New Energy Power Station Solution Revenue (undefined) Forecast, by Application 2020 & 2033
- Table 33: GCC New Energy Power Station Solution Revenue (undefined) Forecast, by Application 2020 & 2033
- Table 34: North Africa New Energy Power Station Solution Revenue (undefined) Forecast, by Application 2020 & 2033
- Table 35: South Africa New Energy Power Station Solution Revenue (undefined) Forecast, by Application 2020 & 2033
- Table 36: Rest of Middle East & Africa New Energy Power Station Solution Revenue (undefined) Forecast, by Application 2020 & 2033
- Table 37: Global New Energy Power Station Solution Revenue undefined Forecast, by Application 2020 & 2033
- Table 38: Global New Energy Power Station Solution Revenue undefined Forecast, by Types 2020 & 2033
- Table 39: Global New Energy Power Station Solution Revenue undefined Forecast, by Country 2020 & 2033
- Table 40: China New Energy Power Station Solution Revenue (undefined) Forecast, by Application 2020 & 2033
- Table 41: India New Energy Power Station Solution Revenue (undefined) Forecast, by Application 2020 & 2033
- Table 42: Japan New Energy Power Station Solution Revenue (undefined) Forecast, by Application 2020 & 2033
- Table 43: South Korea New Energy Power Station Solution Revenue (undefined) Forecast, by Application 2020 & 2033
- Table 44: ASEAN New Energy Power Station Solution Revenue (undefined) Forecast, by Application 2020 & 2033
- Table 45: Oceania New Energy Power Station Solution Revenue (undefined) Forecast, by Application 2020 & 2033
- Table 46: Rest of Asia Pacific New Energy Power Station Solution Revenue (undefined) Forecast, by Application 2020 & 2033
Frequently Asked Questions
1. What is the projected Compound Annual Growth Rate (CAGR) of the New Energy Power Station Solution?
The projected CAGR is approximately 22.4%.
2. Which companies are prominent players in the New Energy Power Station Solution?
Key companies in the market include General Electric, Shell, Siemens Energy, ABB, Hitachi, ReNew Power, Fortum, Tata Power, Statkraft, ACWA Power, Black & Veatch, Mitsubishi Corporation, Yokogawa Electric Corporation, Sungrow Power, GoodWe, Trina Solar, Chint New Energy, SMA Solar, JA Solar, Huawei, Risen Energy, LONGi, State Power Rixin Tech.
3. What are the main segments of the New Energy Power Station Solution?
The market segments include Application, Types.
4. Can you provide details about the market size?
The market size is estimated to be USD XXX N/A as of 2022.
5. What are some drivers contributing to market growth?
N/A
6. What are the notable trends driving market growth?
N/A
7. Are there any restraints impacting market growth?
N/A
8. Can you provide examples of recent developments in the market?
N/A
9. What pricing options are available for accessing the report?
Pricing options include single-user, multi-user, and enterprise licenses priced at USD 3350.00, USD 5025.00, and USD 6700.00 respectively.
10. Is the market size provided in terms of value or volume?
The market size is provided in terms of value, measured in N/A.
11. Are there any specific market keywords associated with the report?
Yes, the market keyword associated with the report is "New Energy Power Station Solution," which aids in identifying and referencing the specific market segment covered.
12. How do I determine which pricing option suits my needs best?
The pricing options vary based on user requirements and access needs. Individual users may opt for single-user licenses, while businesses requiring broader access may choose multi-user or enterprise licenses for cost-effective access to the report.
13. Are there any additional resources or data provided in the New Energy Power Station Solution report?
While the report offers comprehensive insights, it's advisable to review the specific contents or supplementary materials provided to ascertain if additional resources or data are available.
14. How can I stay updated on further developments or reports in the New Energy Power Station Solution?
To stay informed about further developments, trends, and reports in the New Energy Power Station Solution, consider subscribing to industry newsletters, following relevant companies and organizations, or regularly checking reputable industry news sources and publications.
Methodology
Step 1 - Identification of Relevant Samples Size from Population Database


Step 2 - Approaches for Defining Global Market Size (Value, Volume* & Price*)

Note*: In applicable scenarios
Step 3 - Data Sources
Primary Research
- Web Analytics
- Survey Reports
- Research Institute
- Latest Research Reports
- Opinion Leaders
Secondary Research
- Annual Reports
- White Paper
- Latest Press Release
- Industry Association
- Paid Database
- Investor Presentations

Step 4 - Data Triangulation
Involves using different sources of information in order to increase the validity of a study
These sources are likely to be stakeholders in a program - participants, other researchers, program staff, other community members, and so on.
Then we put all data in single framework & apply various statistical tools to find out the dynamic on the market.
During the analysis stage, feedback from the stakeholder groups would be compared to determine areas of agreement as well as areas of divergence