
Key Insights
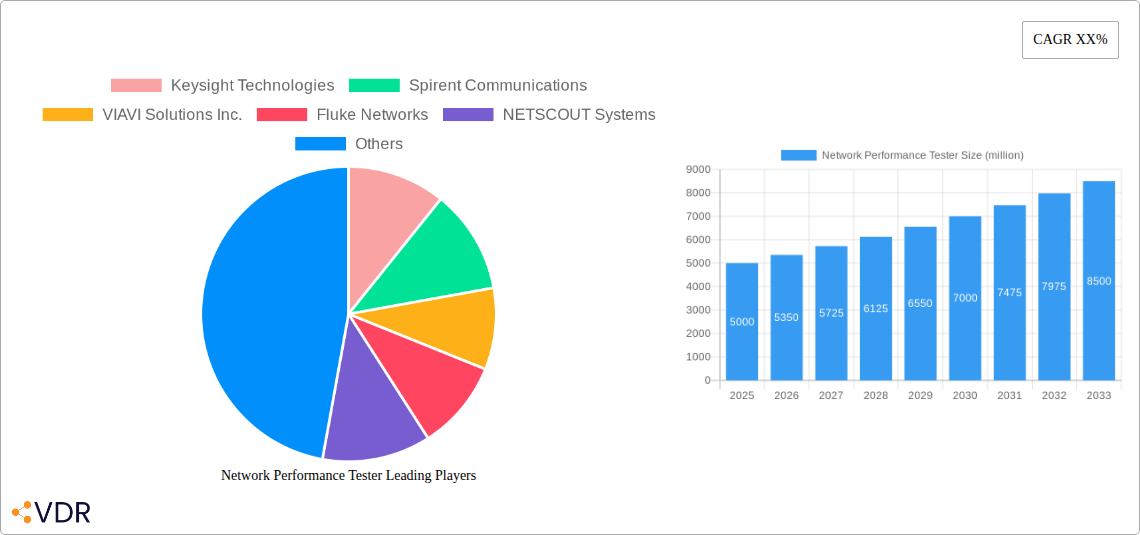
The Network Performance Tester market is experiencing robust growth, driven by the increasing demand for high-speed, reliable network infrastructure across various sectors. The expanding adoption of 5G, cloud computing, and the Internet of Things (IoT) are key catalysts, pushing organizations to rigorously test network performance and ensure optimal functionality. This necessitates sophisticated testing solutions capable of handling complex network topologies and diverse traffic patterns, fueling demand for advanced network performance testers. Furthermore, the rising prevalence of cybersecurity threats emphasizes the need for proactive network monitoring and security testing, further bolstering market growth. We project a Compound Annual Growth Rate (CAGR) of 7% for the period 2025-2033, resulting in a substantial market expansion. Leading vendors like Keysight Technologies, Spirent Communications, and VIAVI Solutions are strategically investing in research and development to enhance their product offerings and maintain their market positions. Competition remains intense, with companies focusing on innovation and providing comprehensive solutions that integrate various testing capabilities.
The market segmentation reveals a strong preference for software-based solutions due to their flexibility, scalability, and cost-effectiveness. However, hardware-based solutions continue to maintain a significant share, particularly in applications requiring high-performance and specialized testing capabilities. Geographically, North America and Europe currently hold the largest market shares, attributed to early adoption of advanced technologies and a strong presence of key players. However, Asia-Pacific is witnessing significant growth due to rapid technological advancements and increasing infrastructure investments. Despite the positive outlook, regulatory challenges and high initial investment costs pose potential restraints to market expansion. To overcome this, vendors are focusing on developing more affordable and user-friendly solutions to cater to a wider range of users.
Network Performance Tester Market Report: 2019-2033
This comprehensive report provides an in-depth analysis of the global Network Performance Tester market, offering invaluable insights for industry professionals, investors, and strategic decision-makers. The study covers the period from 2019 to 2033, with a focus on the forecast period of 2025-2033 and a base year of 2025. The report meticulously examines market dynamics, growth trends, regional dominance, product landscapes, and key players, providing a holistic view of this vital sector of the telecommunications and networking industries. The market is segmented by various technologies, applications, and end-users; detailed segmentation is provided within the full report. The total market size in 2025 is estimated at $XX billion.
Network Performance Tester Market Dynamics & Structure
The Network Performance Tester market is moderately concentrated, with key players such as Keysight Technologies, Spirent Communications, and VIAVI Solutions Inc. holding significant market share. The market's structure is characterized by intense competition, driven by continuous technological innovation and the growing demand for high-performance networking solutions. Regulatory frameworks, particularly concerning network security and data privacy, significantly impact market dynamics. The emergence of software-defined networking (SDN) and network function virtualization (NFV) has created both opportunities and challenges for existing players. Substitutes, such as cloud-based testing solutions, are also impacting the market.
- Market Concentration: The top 5 players account for approximately XX% of the market share in 2025.
- Technological Innovation: 5G deployment, SDN, and NFV are major drivers of innovation, leading to increased demand for advanced testing solutions.
- Regulatory Landscape: Compliance with data privacy regulations (like GDPR) and cybersecurity standards influence product development and adoption.
- M&A Activity: An estimated XX M&A deals related to network testing were recorded between 2019 and 2024. Consolidation is expected to continue.
- End-User Demographics: Telecommunication service providers, enterprise networks, and government agencies are the primary end-users.
Network Performance Tester Growth Trends & Insights
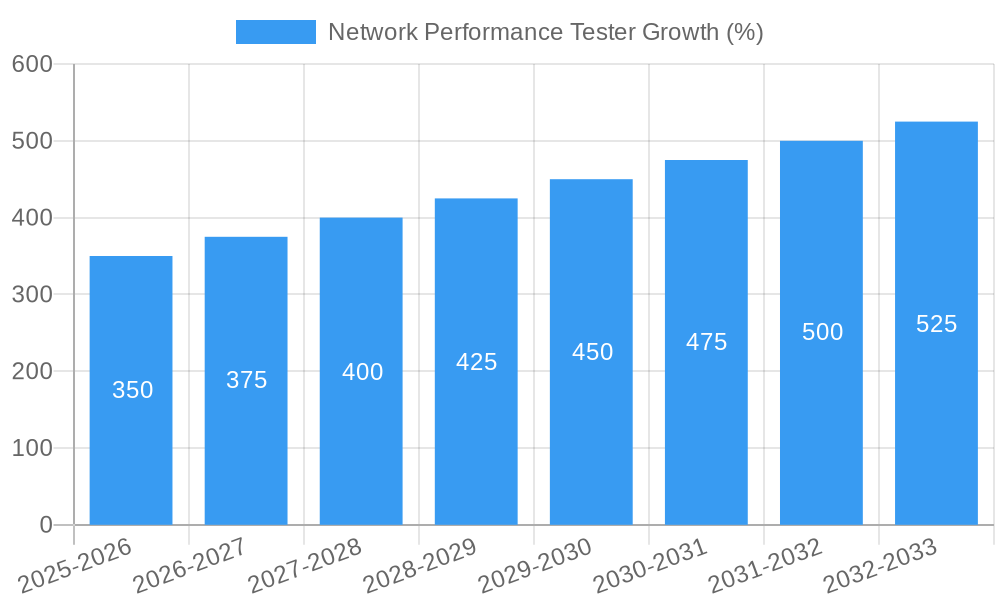
The global Network Performance Tester market experienced substantial growth during the historical period (2019-2024), with a CAGR of XX%. This growth is primarily attributed to the increasing adoption of advanced networking technologies like 5G and the expanding global internet infrastructure. The market is expected to continue its upward trajectory throughout the forecast period (2025-2033), driven by factors such as the escalating demand for high-bandwidth applications, the rising number of connected devices, and the expanding scope of cloud computing. Technological disruptions, such as the introduction of AI-powered testing tools, are further accelerating market expansion. Consumer behavior is shifting towards cloud-based testing solutions, influencing market segmentation. Market penetration is projected to reach XX% by 2033. The estimated market size in 2033 is projected at $XX billion.
Dominant Regions, Countries, or Segments in Network Performance Tester
North America currently holds the largest market share in the Network Performance Tester market, followed by Europe and Asia Pacific. This dominance is driven by factors such as robust technological infrastructure, a high concentration of telecom operators, and significant investments in 5G deployment. However, the Asia-Pacific region is poised for significant growth due to rapid economic expansion, increasing digitalization, and substantial infrastructure investments.
- North America: High adoption rates of advanced technologies, strong regulatory frameworks, and a large number of telecom operators contribute to market leadership.
- Europe: Significant investments in 5G infrastructure and a growing emphasis on cybersecurity drive market growth.
- Asia Pacific: Rapid economic growth, rising digitalization, and expanding internet penetration fuel market expansion. China and India are key growth drivers.
Network Performance Tester Product Landscape
Network performance testers encompass a wide range of products, including hardware-based solutions, software-based platforms, and cloud-based services. These products offer various functionalities, from basic throughput testing to advanced protocol analysis and emulation. Technological advancements are focused on enhancing accuracy, speed, and automation, integrating AI for smarter analysis, and improving scalability for handling increasingly complex networks. Unique selling propositions include ease-of-use, comprehensive reporting features, and integration with other network management tools.
Key Drivers, Barriers & Challenges in Network Performance Tester
Key Drivers:
- The widespread adoption of 5G and other advanced networking technologies is a primary driver.
- The increasing demand for high-bandwidth applications (e.g., video streaming, cloud computing) fuels market growth.
- Stricter regulatory compliance requirements necessitate robust testing solutions.
Challenges & Restraints:
- High initial investment costs for advanced testing equipment can be a barrier to entry for smaller companies.
- Maintaining software and hardware compatibility across various network environments poses a challenge.
- Intense competition among established players limits profit margins.
Emerging Opportunities in Network Performance Tester
The market presents several promising opportunities, including:
- The rising demand for secure and reliable network infrastructure creates opportunities for enhanced security testing solutions.
- The expansion of IoT (Internet of Things) networks demands robust testing capabilities to ensure seamless connectivity.
- The growth of edge computing necessitates performance testing solutions specifically designed for edge environments.
Growth Accelerators in the Network Performance Tester Industry
Strategic partnerships between network equipment vendors and testing solution providers are crucial for market expansion. Technological advancements, particularly in AI and machine learning for automated testing, will further accelerate market growth. Expanding into emerging markets, particularly in developing economies, offers considerable potential.
Key Players Shaping the Network Performance Tester Market
- Keysight Technologies
- Spirent Communications
- VIAVI Solutions Inc.
- Fluke Networks
- NETSCOUT Systems, Inc.
- EXFO Inc.
- Anritsu Corporation
- Rohde & Schwarz
- Tektronix, Inc.
- Cisco Systems, Inc.
Notable Milestones in Network Performance Tester Sector
- 2020: Keysight Technologies launched its 5G network emulation solution.
- 2021: Spirent Communications acquired a smaller network testing company, expanding its product portfolio.
- 2022: VIAVI Solutions Inc. released a new software platform for automated network testing.
- 2023: Several key players announced new partnerships to integrate their testing solutions with cloud platforms.
- 2024: Increased focus on AI-powered network testing solutions across many vendors.
In-Depth Network Performance Tester Market Outlook
The Network Performance Tester market is projected to experience robust growth over the forecast period, driven by technological advancements, increasing network complexity, and the rising demand for reliable and high-performing networks. Strategic investments in R&D, expansion into new markets, and strategic partnerships will play a crucial role in shaping the future of this dynamic sector. Opportunities abound for companies that can effectively leverage emerging technologies and adapt to the evolving needs of network operators and enterprises.
Network Performance Tester Segmentation
-
1. Application
- 1.1. Residential
- 1.2. Business
- 1.3. Other
-
2. Types
- 2.1. Bandwidth Tester
- 2.2. Network Security Testers
- 2.3. Other
Network Performance Tester Segmentation By Geography
-
1. North America
- 1.1. United States
- 1.2. Canada
- 1.3. Mexico
-
2. South America
- 2.1. Brazil
- 2.2. Argentina
- 2.3. Rest of South America
-
3. Europe
- 3.1. United Kingdom
- 3.2. Germany
- 3.3. France
- 3.4. Italy
- 3.5. Spain
- 3.6. Russia
- 3.7. Benelux
- 3.8. Nordics
- 3.9. Rest of Europe
-
4. Middle East & Africa
- 4.1. Turkey
- 4.2. Israel
- 4.3. GCC
- 4.4. North Africa
- 4.5. South Africa
- 4.6. Rest of Middle East & Africa
-
5. Asia Pacific
- 5.1. China
- 5.2. India
- 5.3. Japan
- 5.4. South Korea
- 5.5. ASEAN
- 5.6. Oceania
- 5.7. Rest of Asia Pacific

Network Performance Tester REPORT HIGHLIGHTS
| Aspects | Details |
|---|---|
| Study Period | 2019-2033 |
| Base Year | 2024 |
| Estimated Year | 2025 |
| Forecast Period | 2025-2033 |
| Historical Period | 2019-2024 |
| Growth Rate | CAGR of XX% from 2019-2033 |
| Segmentation |
|
Table of Contents
- 1. Introduction
- 1.1. Research Scope
- 1.2. Market Segmentation
- 1.3. Research Methodology
- 1.4. Definitions and Assumptions
- 2. Executive Summary
- 2.1. Introduction
- 3. Market Dynamics
- 3.1. Introduction
- 3.2. Market Drivers
- 3.3. Market Restrains
- 3.4. Market Trends
- 4. Market Factor Analysis
- 4.1. Porters Five Forces
- 4.2. Supply/Value Chain
- 4.3. PESTEL analysis
- 4.4. Market Entropy
- 4.5. Patent/Trademark Analysis
- 5. Global Network Performance Tester Analysis, Insights and Forecast, 2019-2031
- 5.1. Market Analysis, Insights and Forecast - by Application
- 5.1.1. Residential
- 5.1.2. Business
- 5.1.3. Other
- 5.2. Market Analysis, Insights and Forecast - by Types
- 5.2.1. Bandwidth Tester
- 5.2.2. Network Security Testers
- 5.2.3. Other
- 5.3. Market Analysis, Insights and Forecast - by Region
- 5.3.1. North America
- 5.3.2. South America
- 5.3.3. Europe
- 5.3.4. Middle East & Africa
- 5.3.5. Asia Pacific
- 5.1. Market Analysis, Insights and Forecast - by Application
- 6. North America Network Performance Tester Analysis, Insights and Forecast, 2019-2031
- 6.1. Market Analysis, Insights and Forecast - by Application
- 6.1.1. Residential
- 6.1.2. Business
- 6.1.3. Other
- 6.2. Market Analysis, Insights and Forecast - by Types
- 6.2.1. Bandwidth Tester
- 6.2.2. Network Security Testers
- 6.2.3. Other
- 6.1. Market Analysis, Insights and Forecast - by Application
- 7. South America Network Performance Tester Analysis, Insights and Forecast, 2019-2031
- 7.1. Market Analysis, Insights and Forecast - by Application
- 7.1.1. Residential
- 7.1.2. Business
- 7.1.3. Other
- 7.2. Market Analysis, Insights and Forecast - by Types
- 7.2.1. Bandwidth Tester
- 7.2.2. Network Security Testers
- 7.2.3. Other
- 7.1. Market Analysis, Insights and Forecast - by Application
- 8. Europe Network Performance Tester Analysis, Insights and Forecast, 2019-2031
- 8.1. Market Analysis, Insights and Forecast - by Application
- 8.1.1. Residential
- 8.1.2. Business
- 8.1.3. Other
- 8.2. Market Analysis, Insights and Forecast - by Types
- 8.2.1. Bandwidth Tester
- 8.2.2. Network Security Testers
- 8.2.3. Other
- 8.1. Market Analysis, Insights and Forecast - by Application
- 9. Middle East & Africa Network Performance Tester Analysis, Insights and Forecast, 2019-2031
- 9.1. Market Analysis, Insights and Forecast - by Application
- 9.1.1. Residential
- 9.1.2. Business
- 9.1.3. Other
- 9.2. Market Analysis, Insights and Forecast - by Types
- 9.2.1. Bandwidth Tester
- 9.2.2. Network Security Testers
- 9.2.3. Other
- 9.1. Market Analysis, Insights and Forecast - by Application
- 10. Asia Pacific Network Performance Tester Analysis, Insights and Forecast, 2019-2031
- 10.1. Market Analysis, Insights and Forecast - by Application
- 10.1.1. Residential
- 10.1.2. Business
- 10.1.3. Other
- 10.2. Market Analysis, Insights and Forecast - by Types
- 10.2.1. Bandwidth Tester
- 10.2.2. Network Security Testers
- 10.2.3. Other
- 10.1. Market Analysis, Insights and Forecast - by Application
- 11. Competitive Analysis
- 11.1. Global Market Share Analysis 2024
- 11.2. Company Profiles
- 11.2.1 Keysight Technologies
- 11.2.1.1. Overview
- 11.2.1.2. Products
- 11.2.1.3. SWOT Analysis
- 11.2.1.4. Recent Developments
- 11.2.1.5. Financials (Based on Availability)
- 11.2.2 Spirent Communications
- 11.2.2.1. Overview
- 11.2.2.2. Products
- 11.2.2.3. SWOT Analysis
- 11.2.2.4. Recent Developments
- 11.2.2.5. Financials (Based on Availability)
- 11.2.3 VIAVI Solutions Inc.
- 11.2.3.1. Overview
- 11.2.3.2. Products
- 11.2.3.3. SWOT Analysis
- 11.2.3.4. Recent Developments
- 11.2.3.5. Financials (Based on Availability)
- 11.2.4 Fluke Networks
- 11.2.4.1. Overview
- 11.2.4.2. Products
- 11.2.4.3. SWOT Analysis
- 11.2.4.4. Recent Developments
- 11.2.4.5. Financials (Based on Availability)
- 11.2.5 NETSCOUT Systems
- 11.2.5.1. Overview
- 11.2.5.2. Products
- 11.2.5.3. SWOT Analysis
- 11.2.5.4. Recent Developments
- 11.2.5.5. Financials (Based on Availability)
- 11.2.6 Inc.
- 11.2.6.1. Overview
- 11.2.6.2. Products
- 11.2.6.3. SWOT Analysis
- 11.2.6.4. Recent Developments
- 11.2.6.5. Financials (Based on Availability)
- 11.2.7 EXFO Inc.
- 11.2.7.1. Overview
- 11.2.7.2. Products
- 11.2.7.3. SWOT Analysis
- 11.2.7.4. Recent Developments
- 11.2.7.5. Financials (Based on Availability)
- 11.2.8 Anritsu Corporation
- 11.2.8.1. Overview
- 11.2.8.2. Products
- 11.2.8.3. SWOT Analysis
- 11.2.8.4. Recent Developments
- 11.2.8.5. Financials (Based on Availability)
- 11.2.9 Rohde & Schwarz
- 11.2.9.1. Overview
- 11.2.9.2. Products
- 11.2.9.3. SWOT Analysis
- 11.2.9.4. Recent Developments
- 11.2.9.5. Financials (Based on Availability)
- 11.2.10 Tektronix
- 11.2.10.1. Overview
- 11.2.10.2. Products
- 11.2.10.3. SWOT Analysis
- 11.2.10.4. Recent Developments
- 11.2.10.5. Financials (Based on Availability)
- 11.2.11 Inc.
- 11.2.11.1. Overview
- 11.2.11.2. Products
- 11.2.11.3. SWOT Analysis
- 11.2.11.4. Recent Developments
- 11.2.11.5. Financials (Based on Availability)
- 11.2.12 Cisco Systems
- 11.2.12.1. Overview
- 11.2.12.2. Products
- 11.2.12.3. SWOT Analysis
- 11.2.12.4. Recent Developments
- 11.2.12.5. Financials (Based on Availability)
- 11.2.13 Inc.
- 11.2.13.1. Overview
- 11.2.13.2. Products
- 11.2.13.3. SWOT Analysis
- 11.2.13.4. Recent Developments
- 11.2.13.5. Financials (Based on Availability)
- 11.2.1 Keysight Technologies
List of Figures
- Figure 1: Global Network Performance Tester Revenue Breakdown (million, %) by Region 2024 & 2032
- Figure 2: Global Network Performance Tester Volume Breakdown (K, %) by Region 2024 & 2032
- Figure 3: North America Network Performance Tester Revenue (million), by Application 2024 & 2032
- Figure 4: North America Network Performance Tester Volume (K), by Application 2024 & 2032
- Figure 5: North America Network Performance Tester Revenue Share (%), by Application 2024 & 2032
- Figure 6: North America Network Performance Tester Volume Share (%), by Application 2024 & 2032
- Figure 7: North America Network Performance Tester Revenue (million), by Types 2024 & 2032
- Figure 8: North America Network Performance Tester Volume (K), by Types 2024 & 2032
- Figure 9: North America Network Performance Tester Revenue Share (%), by Types 2024 & 2032
- Figure 10: North America Network Performance Tester Volume Share (%), by Types 2024 & 2032
- Figure 11: North America Network Performance Tester Revenue (million), by Country 2024 & 2032
- Figure 12: North America Network Performance Tester Volume (K), by Country 2024 & 2032
- Figure 13: North America Network Performance Tester Revenue Share (%), by Country 2024 & 2032
- Figure 14: North America Network Performance Tester Volume Share (%), by Country 2024 & 2032
- Figure 15: South America Network Performance Tester Revenue (million), by Application 2024 & 2032
- Figure 16: South America Network Performance Tester Volume (K), by Application 2024 & 2032
- Figure 17: South America Network Performance Tester Revenue Share (%), by Application 2024 & 2032
- Figure 18: South America Network Performance Tester Volume Share (%), by Application 2024 & 2032
- Figure 19: South America Network Performance Tester Revenue (million), by Types 2024 & 2032
- Figure 20: South America Network Performance Tester Volume (K), by Types 2024 & 2032
- Figure 21: South America Network Performance Tester Revenue Share (%), by Types 2024 & 2032
- Figure 22: South America Network Performance Tester Volume Share (%), by Types 2024 & 2032
- Figure 23: South America Network Performance Tester Revenue (million), by Country 2024 & 2032
- Figure 24: South America Network Performance Tester Volume (K), by Country 2024 & 2032
- Figure 25: South America Network Performance Tester Revenue Share (%), by Country 2024 & 2032
- Figure 26: South America Network Performance Tester Volume Share (%), by Country 2024 & 2032
- Figure 27: Europe Network Performance Tester Revenue (million), by Application 2024 & 2032
- Figure 28: Europe Network Performance Tester Volume (K), by Application 2024 & 2032
- Figure 29: Europe Network Performance Tester Revenue Share (%), by Application 2024 & 2032
- Figure 30: Europe Network Performance Tester Volume Share (%), by Application 2024 & 2032
- Figure 31: Europe Network Performance Tester Revenue (million), by Types 2024 & 2032
- Figure 32: Europe Network Performance Tester Volume (K), by Types 2024 & 2032
- Figure 33: Europe Network Performance Tester Revenue Share (%), by Types 2024 & 2032
- Figure 34: Europe Network Performance Tester Volume Share (%), by Types 2024 & 2032
- Figure 35: Europe Network Performance Tester Revenue (million), by Country 2024 & 2032
- Figure 36: Europe Network Performance Tester Volume (K), by Country 2024 & 2032
- Figure 37: Europe Network Performance Tester Revenue Share (%), by Country 2024 & 2032
- Figure 38: Europe Network Performance Tester Volume Share (%), by Country 2024 & 2032
- Figure 39: Middle East & Africa Network Performance Tester Revenue (million), by Application 2024 & 2032
- Figure 40: Middle East & Africa Network Performance Tester Volume (K), by Application 2024 & 2032
- Figure 41: Middle East & Africa Network Performance Tester Revenue Share (%), by Application 2024 & 2032
- Figure 42: Middle East & Africa Network Performance Tester Volume Share (%), by Application 2024 & 2032
- Figure 43: Middle East & Africa Network Performance Tester Revenue (million), by Types 2024 & 2032
- Figure 44: Middle East & Africa Network Performance Tester Volume (K), by Types 2024 & 2032
- Figure 45: Middle East & Africa Network Performance Tester Revenue Share (%), by Types 2024 & 2032
- Figure 46: Middle East & Africa Network Performance Tester Volume Share (%), by Types 2024 & 2032
- Figure 47: Middle East & Africa Network Performance Tester Revenue (million), by Country 2024 & 2032
- Figure 48: Middle East & Africa Network Performance Tester Volume (K), by Country 2024 & 2032
- Figure 49: Middle East & Africa Network Performance Tester Revenue Share (%), by Country 2024 & 2032
- Figure 50: Middle East & Africa Network Performance Tester Volume Share (%), by Country 2024 & 2032
- Figure 51: Asia Pacific Network Performance Tester Revenue (million), by Application 2024 & 2032
- Figure 52: Asia Pacific Network Performance Tester Volume (K), by Application 2024 & 2032
- Figure 53: Asia Pacific Network Performance Tester Revenue Share (%), by Application 2024 & 2032
- Figure 54: Asia Pacific Network Performance Tester Volume Share (%), by Application 2024 & 2032
- Figure 55: Asia Pacific Network Performance Tester Revenue (million), by Types 2024 & 2032
- Figure 56: Asia Pacific Network Performance Tester Volume (K), by Types 2024 & 2032
- Figure 57: Asia Pacific Network Performance Tester Revenue Share (%), by Types 2024 & 2032
- Figure 58: Asia Pacific Network Performance Tester Volume Share (%), by Types 2024 & 2032
- Figure 59: Asia Pacific Network Performance Tester Revenue (million), by Country 2024 & 2032
- Figure 60: Asia Pacific Network Performance Tester Volume (K), by Country 2024 & 2032
- Figure 61: Asia Pacific Network Performance Tester Revenue Share (%), by Country 2024 & 2032
- Figure 62: Asia Pacific Network Performance Tester Volume Share (%), by Country 2024 & 2032
List of Tables
- Table 1: Global Network Performance Tester Revenue million Forecast, by Region 2019 & 2032
- Table 2: Global Network Performance Tester Volume K Forecast, by Region 2019 & 2032
- Table 3: Global Network Performance Tester Revenue million Forecast, by Application 2019 & 2032
- Table 4: Global Network Performance Tester Volume K Forecast, by Application 2019 & 2032
- Table 5: Global Network Performance Tester Revenue million Forecast, by Types 2019 & 2032
- Table 6: Global Network Performance Tester Volume K Forecast, by Types 2019 & 2032
- Table 7: Global Network Performance Tester Revenue million Forecast, by Region 2019 & 2032
- Table 8: Global Network Performance Tester Volume K Forecast, by Region 2019 & 2032
- Table 9: Global Network Performance Tester Revenue million Forecast, by Application 2019 & 2032
- Table 10: Global Network Performance Tester Volume K Forecast, by Application 2019 & 2032
- Table 11: Global Network Performance Tester Revenue million Forecast, by Types 2019 & 2032
- Table 12: Global Network Performance Tester Volume K Forecast, by Types 2019 & 2032
- Table 13: Global Network Performance Tester Revenue million Forecast, by Country 2019 & 2032
- Table 14: Global Network Performance Tester Volume K Forecast, by Country 2019 & 2032
- Table 15: United States Network Performance Tester Revenue (million) Forecast, by Application 2019 & 2032
- Table 16: United States Network Performance Tester Volume (K) Forecast, by Application 2019 & 2032
- Table 17: Canada Network Performance Tester Revenue (million) Forecast, by Application 2019 & 2032
- Table 18: Canada Network Performance Tester Volume (K) Forecast, by Application 2019 & 2032
- Table 19: Mexico Network Performance Tester Revenue (million) Forecast, by Application 2019 & 2032
- Table 20: Mexico Network Performance Tester Volume (K) Forecast, by Application 2019 & 2032
- Table 21: Global Network Performance Tester Revenue million Forecast, by Application 2019 & 2032
- Table 22: Global Network Performance Tester Volume K Forecast, by Application 2019 & 2032
- Table 23: Global Network Performance Tester Revenue million Forecast, by Types 2019 & 2032
- Table 24: Global Network Performance Tester Volume K Forecast, by Types 2019 & 2032
- Table 25: Global Network Performance Tester Revenue million Forecast, by Country 2019 & 2032
- Table 26: Global Network Performance Tester Volume K Forecast, by Country 2019 & 2032
- Table 27: Brazil Network Performance Tester Revenue (million) Forecast, by Application 2019 & 2032
- Table 28: Brazil Network Performance Tester Volume (K) Forecast, by Application 2019 & 2032
- Table 29: Argentina Network Performance Tester Revenue (million) Forecast, by Application 2019 & 2032
- Table 30: Argentina Network Performance Tester Volume (K) Forecast, by Application 2019 & 2032
- Table 31: Rest of South America Network Performance Tester Revenue (million) Forecast, by Application 2019 & 2032
- Table 32: Rest of South America Network Performance Tester Volume (K) Forecast, by Application 2019 & 2032
- Table 33: Global Network Performance Tester Revenue million Forecast, by Application 2019 & 2032
- Table 34: Global Network Performance Tester Volume K Forecast, by Application 2019 & 2032
- Table 35: Global Network Performance Tester Revenue million Forecast, by Types 2019 & 2032
- Table 36: Global Network Performance Tester Volume K Forecast, by Types 2019 & 2032
- Table 37: Global Network Performance Tester Revenue million Forecast, by Country 2019 & 2032
- Table 38: Global Network Performance Tester Volume K Forecast, by Country 2019 & 2032
- Table 39: United Kingdom Network Performance Tester Revenue (million) Forecast, by Application 2019 & 2032
- Table 40: United Kingdom Network Performance Tester Volume (K) Forecast, by Application 2019 & 2032
- Table 41: Germany Network Performance Tester Revenue (million) Forecast, by Application 2019 & 2032
- Table 42: Germany Network Performance Tester Volume (K) Forecast, by Application 2019 & 2032
- Table 43: France Network Performance Tester Revenue (million) Forecast, by Application 2019 & 2032
- Table 44: France Network Performance Tester Volume (K) Forecast, by Application 2019 & 2032
- Table 45: Italy Network Performance Tester Revenue (million) Forecast, by Application 2019 & 2032
- Table 46: Italy Network Performance Tester Volume (K) Forecast, by Application 2019 & 2032
- Table 47: Spain Network Performance Tester Revenue (million) Forecast, by Application 2019 & 2032
- Table 48: Spain Network Performance Tester Volume (K) Forecast, by Application 2019 & 2032
- Table 49: Russia Network Performance Tester Revenue (million) Forecast, by Application 2019 & 2032
- Table 50: Russia Network Performance Tester Volume (K) Forecast, by Application 2019 & 2032
- Table 51: Benelux Network Performance Tester Revenue (million) Forecast, by Application 2019 & 2032
- Table 52: Benelux Network Performance Tester Volume (K) Forecast, by Application 2019 & 2032
- Table 53: Nordics Network Performance Tester Revenue (million) Forecast, by Application 2019 & 2032
- Table 54: Nordics Network Performance Tester Volume (K) Forecast, by Application 2019 & 2032
- Table 55: Rest of Europe Network Performance Tester Revenue (million) Forecast, by Application 2019 & 2032
- Table 56: Rest of Europe Network Performance Tester Volume (K) Forecast, by Application 2019 & 2032
- Table 57: Global Network Performance Tester Revenue million Forecast, by Application 2019 & 2032
- Table 58: Global Network Performance Tester Volume K Forecast, by Application 2019 & 2032
- Table 59: Global Network Performance Tester Revenue million Forecast, by Types 2019 & 2032
- Table 60: Global Network Performance Tester Volume K Forecast, by Types 2019 & 2032
- Table 61: Global Network Performance Tester Revenue million Forecast, by Country 2019 & 2032
- Table 62: Global Network Performance Tester Volume K Forecast, by Country 2019 & 2032
- Table 63: Turkey Network Performance Tester Revenue (million) Forecast, by Application 2019 & 2032
- Table 64: Turkey Network Performance Tester Volume (K) Forecast, by Application 2019 & 2032
- Table 65: Israel Network Performance Tester Revenue (million) Forecast, by Application 2019 & 2032
- Table 66: Israel Network Performance Tester Volume (K) Forecast, by Application 2019 & 2032
- Table 67: GCC Network Performance Tester Revenue (million) Forecast, by Application 2019 & 2032
- Table 68: GCC Network Performance Tester Volume (K) Forecast, by Application 2019 & 2032
- Table 69: North Africa Network Performance Tester Revenue (million) Forecast, by Application 2019 & 2032
- Table 70: North Africa Network Performance Tester Volume (K) Forecast, by Application 2019 & 2032
- Table 71: South Africa Network Performance Tester Revenue (million) Forecast, by Application 2019 & 2032
- Table 72: South Africa Network Performance Tester Volume (K) Forecast, by Application 2019 & 2032
- Table 73: Rest of Middle East & Africa Network Performance Tester Revenue (million) Forecast, by Application 2019 & 2032
- Table 74: Rest of Middle East & Africa Network Performance Tester Volume (K) Forecast, by Application 2019 & 2032
- Table 75: Global Network Performance Tester Revenue million Forecast, by Application 2019 & 2032
- Table 76: Global Network Performance Tester Volume K Forecast, by Application 2019 & 2032
- Table 77: Global Network Performance Tester Revenue million Forecast, by Types 2019 & 2032
- Table 78: Global Network Performance Tester Volume K Forecast, by Types 2019 & 2032
- Table 79: Global Network Performance Tester Revenue million Forecast, by Country 2019 & 2032
- Table 80: Global Network Performance Tester Volume K Forecast, by Country 2019 & 2032
- Table 81: China Network Performance Tester Revenue (million) Forecast, by Application 2019 & 2032
- Table 82: China Network Performance Tester Volume (K) Forecast, by Application 2019 & 2032
- Table 83: India Network Performance Tester Revenue (million) Forecast, by Application 2019 & 2032
- Table 84: India Network Performance Tester Volume (K) Forecast, by Application 2019 & 2032
- Table 85: Japan Network Performance Tester Revenue (million) Forecast, by Application 2019 & 2032
- Table 86: Japan Network Performance Tester Volume (K) Forecast, by Application 2019 & 2032
- Table 87: South Korea Network Performance Tester Revenue (million) Forecast, by Application 2019 & 2032
- Table 88: South Korea Network Performance Tester Volume (K) Forecast, by Application 2019 & 2032
- Table 89: ASEAN Network Performance Tester Revenue (million) Forecast, by Application 2019 & 2032
- Table 90: ASEAN Network Performance Tester Volume (K) Forecast, by Application 2019 & 2032
- Table 91: Oceania Network Performance Tester Revenue (million) Forecast, by Application 2019 & 2032
- Table 92: Oceania Network Performance Tester Volume (K) Forecast, by Application 2019 & 2032
- Table 93: Rest of Asia Pacific Network Performance Tester Revenue (million) Forecast, by Application 2019 & 2032
- Table 94: Rest of Asia Pacific Network Performance Tester Volume (K) Forecast, by Application 2019 & 2032
Frequently Asked Questions
1. What is the projected Compound Annual Growth Rate (CAGR) of the Network Performance Tester?
The projected CAGR is approximately XX%.
2. Which companies are prominent players in the Network Performance Tester?
Key companies in the market include Keysight Technologies, Spirent Communications, VIAVI Solutions Inc., Fluke Networks, NETSCOUT Systems, Inc., EXFO Inc., Anritsu Corporation, Rohde & Schwarz, Tektronix, Inc., Cisco Systems, Inc..
3. What are the main segments of the Network Performance Tester?
The market segments include Application, Types.
4. Can you provide details about the market size?
The market size is estimated to be USD XXX million as of 2022.
5. What are some drivers contributing to market growth?
N/A
6. What are the notable trends driving market growth?
N/A
7. Are there any restraints impacting market growth?
N/A
8. Can you provide examples of recent developments in the market?
N/A
9. What pricing options are available for accessing the report?
Pricing options include single-user, multi-user, and enterprise licenses priced at USD 3950.00, USD 5925.00, and USD 7900.00 respectively.
10. Is the market size provided in terms of value or volume?
The market size is provided in terms of value, measured in million and volume, measured in K.
11. Are there any specific market keywords associated with the report?
Yes, the market keyword associated with the report is "Network Performance Tester," which aids in identifying and referencing the specific market segment covered.
12. How do I determine which pricing option suits my needs best?
The pricing options vary based on user requirements and access needs. Individual users may opt for single-user licenses, while businesses requiring broader access may choose multi-user or enterprise licenses for cost-effective access to the report.
13. Are there any additional resources or data provided in the Network Performance Tester report?
While the report offers comprehensive insights, it's advisable to review the specific contents or supplementary materials provided to ascertain if additional resources or data are available.
14. How can I stay updated on further developments or reports in the Network Performance Tester?
To stay informed about further developments, trends, and reports in the Network Performance Tester, consider subscribing to industry newsletters, following relevant companies and organizations, or regularly checking reputable industry news sources and publications.
Methodology
Step 1 - Identification of Relevant Samples Size from Population Database


Step 2 - Approaches for Defining Global Market Size (Value, Volume* & Price*)

Note*: In applicable scenarios
Step 3 - Data Sources
Primary Research
- Web Analytics
- Survey Reports
- Research Institute
- Latest Research Reports
- Opinion Leaders
Secondary Research
- Annual Reports
- White Paper
- Latest Press Release
- Industry Association
- Paid Database
- Investor Presentations

Step 4 - Data Triangulation
Involves using different sources of information in order to increase the validity of a study
These sources are likely to be stakeholders in a program - participants, other researchers, program staff, other community members, and so on.
Then we put all data in single framework & apply various statistical tools to find out the dynamic on the market.
During the analysis stage, feedback from the stakeholder groups would be compared to determine areas of agreement as well as areas of divergence


