

Key Insights
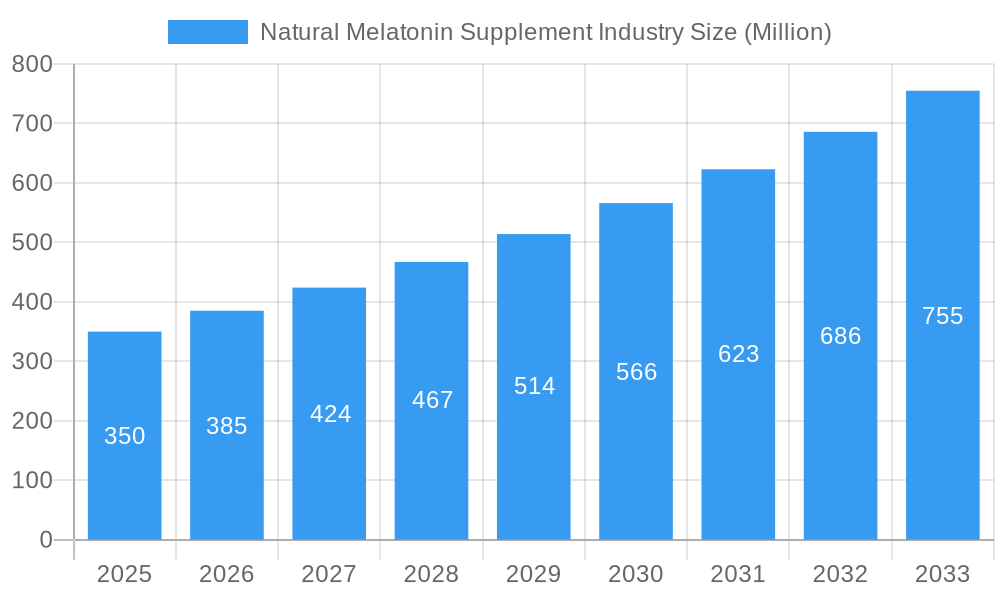
The global natural melatonin supplement market is projected for substantial expansion, driven by rising consumer demand for sleep health solutions and overall wellness. This market is anticipated to grow at a Compound Annual Growth Rate (CAGR) of 10%. Key growth drivers include the increasing prevalence of sleep disorders, elevated stress levels, and a growing preference for natural health products. The rising adoption of dietary supplements, alongside the perceived safety and efficacy of natural melatonin, further fuels market demand. The market size was valued at 529.86 million in the base year of 2025. North America and Europe are expected to lead market revenue, with the Asia-Pacific region showing significant growth potential due to its large population and increasing disposable incomes.
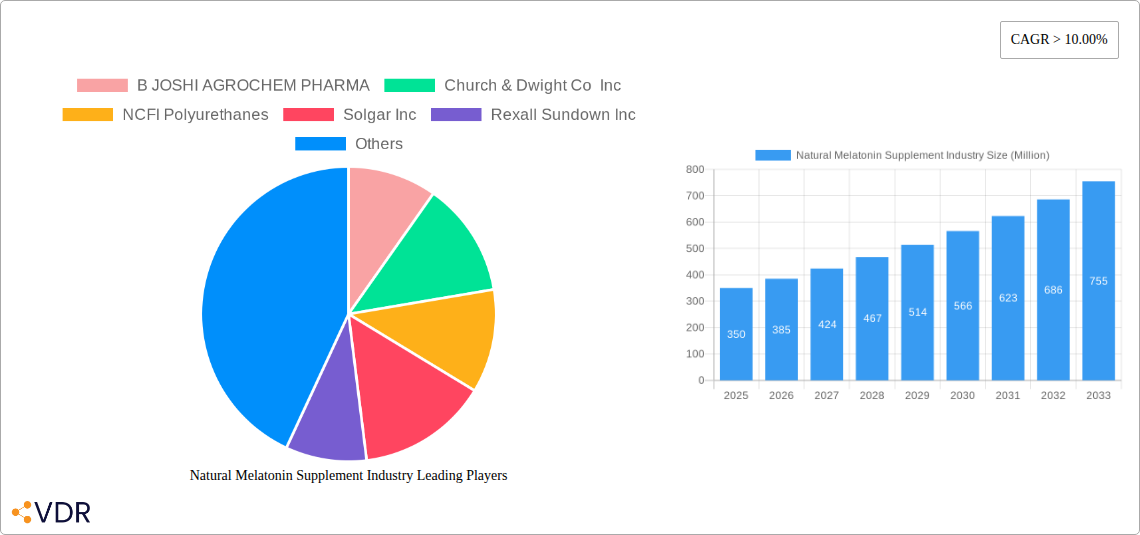
Natural Melatonin Supplement Industry Market Size (In Million)
Within applications, the dietary supplement segment significantly outweighs the medical segment, reflecting the widespread use of natural melatonin for sleep support. Consumer preference for natural ingredients and a perception of fewer side effects contribute to the dominance of natural melatonin over synthetic alternatives. The competitive landscape features both large multinational corporations and specialized players, offering diverse opportunities for market participants. Future growth will be influenced by regulatory developments, ongoing scientific validation, and effective consumer marketing. Addressing product purity and standardization remains a key consideration for market stakeholders.
Natural Melatonin Supplement Industry Company Market Share
Natural Melatonin Supplement Market Report: 2019-2033
This comprehensive report provides a detailed analysis of the Natural Melatonin Supplement industry, encompassing market dynamics, growth trends, competitive landscape, and future outlook. With a focus on both the parent market (sleep aids and dietary supplements) and the child market (natural melatonin supplements), this report offers invaluable insights for industry professionals, investors, and stakeholders. The report covers the period from 2019 to 2033, with a base year of 2025. Market values are presented in million units.
Natural Melatonin Supplement Industry Market Dynamics & Structure
This section analyzes the market's structure, exploring factors influencing its growth and evolution. We examine market concentration, identifying key players and their market share percentages. Technological innovation, including advancements in extraction and formulation, is assessed alongside regulatory frameworks and their impact on market access. The report also examines competitive substitutes, such as other sleep aids and herbal remedies, and analyzes end-user demographics, focusing on age groups and health conditions. Finally, we delve into M&A activity within the industry, quantifying deal volumes and exploring their strategic implications.
- Market Concentration: The market is characterized by [xx]% market concentration with the top 5 players holding [xx]% market share (2024).
- Technological Innovation: Focus on improved extraction methods, novel delivery systems (e.g., gummies, sublingual formulations), and enhanced bioavailability.
- Regulatory Landscape: Analysis of FDA guidelines and international regulations impacting melatonin supplement production and marketing.
- Competitive Substitutes: Examination of competing sleep aids (e.g., pharmaceuticals, herbal remedies) and their impact on market share.
- End-User Demographics: Detailed breakdown of consumer demographics based on age, health concerns, and purchasing behavior.
- M&A Trends: Analysis of merger and acquisition activity in the period 2019-2024, with estimated deal volumes of [xx] transactions.
Natural Melatonin Supplement Industry Growth Trends & Insights
This section provides a comprehensive analysis of the natural melatonin supplement market’s growth trajectory. Leveraging extensive market research data, we detail the market size evolution from 2019 to 2024, and project its growth through 2033. The analysis encompasses adoption rates across different demographics, pinpointing key growth drivers and exploring technological disruptions impacting market dynamics. We also examine consumer behavior shifts, including evolving preferences for natural products and increased awareness of sleep health. Key metrics like Compound Annual Growth Rate (CAGR) and market penetration are utilized to provide a precise understanding of past and future market performance.
[Insert 600-word analysis of market size evolution, adoption rates, technological disruptions, and consumer behavior shifts, including CAGR and market penetration data. Include supporting data and visualizations where applicable.]
Dominant Regions, Countries, or Segments in Natural Melatonin Supplement Industry
This section identifies the leading regions, countries, and market segments within the natural melatonin supplement industry. We examine growth drivers for the dominant segments (Natural Melatonin vs. Synthetic Melatonin; Medical vs. Dietary Supplement applications) and regions, analyzing factors contributing to their success. This analysis includes detailed market share breakdowns and projections for future growth potential.
- Dominant Segment (by Type): [Specify either Natural Melatonin or Synthetic Melatonin and justify based on market share and growth]
- Dominant Segment (by Application): [Specify either Medical or Dietary Supplement and justify based on market share and growth]
- Dominant Region: [Specify the region and justify dominance based on factors like consumer demand, regulatory landscape, and market access]
- Key Drivers: Bullet points highlighting specific economic policies, infrastructure developments, and consumer trends that fuel market growth in the dominant segments and regions.
- Dominance Factors: In-depth discussion of factors driving dominance, including market size, growth rate, consumer preference, and regulatory environments.
[Insert 600-word analysis, incorporating bullet points and paragraphs to analyze regional and segment dominance factors.]
Natural Melatonin Supplement Industry Product Landscape
This section describes the current product landscape, focusing on key product innovations, applications, and performance metrics. We highlight unique selling propositions (USPs) of different products and examine the technological advancements driving product development. This includes exploring different formulations, delivery systems, and added functionalities to enhance efficacy and consumer appeal.
[Insert 100-150 word paragraph describing product innovations, applications, and performance metrics. Highlight USPs and technological advancements.]
Key Drivers, Barriers & Challenges in Natural Melatonin Supplement Industry
This section outlines the primary factors propelling market growth and the key challenges hindering its expansion.
Key Drivers:
- Increasing awareness of sleep disorders and their impact on overall health.
- Growing preference for natural and herbal sleep aids over pharmaceuticals.
- Expanding e-commerce and online retail channels for supplement sales.
- Favorable regulatory environment in some regions promoting the supplement industry.
[Insert 150 words on key drivers. Include technological, economic, and policy-driven factors.]
Key Challenges and Restraints:
- Fluctuations in raw material prices impacting production costs.
- Stringent regulatory hurdles and varying standards across different countries.
- Intense competition from established players and emerging brands.
- Concerns over product quality and inconsistent standardization.
[Insert 150 words outlining challenges, including supply chain issues, regulatory hurdles, and competitive pressures.]
Emerging Opportunities in Natural Melatonin Supplement Industry
This section highlights promising trends and opportunities for future growth.
- Untapped markets in developing economies.
- Innovation in delivery systems (e.g., personalized formulations, smart supplements).
- Growing interest in functional foods incorporating melatonin.
- Strategic partnerships and collaborations among industry players.
[Insert 150 words on emerging trends and opportunities.]
Growth Accelerators in the Natural Melatonin Supplement Industry Industry
This section identifies key factors that will propel long-term market growth. Technological breakthroughs, like improved extraction techniques or targeted delivery systems, are significant growth drivers. Strategic partnerships, such as collaborations between supplement manufacturers and healthcare providers, can expand market reach and enhance product credibility. Finally, aggressive market expansion strategies focusing on new geographical territories or untapped demographic segments can significantly boost sales.
[Insert 150-word paragraph discussing growth catalysts.]
Key Players Shaping the Natural Melatonin Supplement Market
- B JOSHI AGROCHEM PHARMA
- Church & Dwight Co Inc
- NCFI Polyurethanes
- Solgar Inc
- Rexall Sundown Inc
- Nature's Bounty
- Aurobindo Pharma
- Aspen Holdings
- Biotics Research Corporation
- Pharmavite
- Jameison
- Natrol LLC
- Pfizer Inc
Notable Milestones in Natural Melatonin Supplement Industry Sector
- November 2022: Natrol released MelatoninMax, a single-gummy sleep aid with 10mg of melatonin.
- January 2023: Pfizer Inc. expanded its "Agreement for a Healthier World" initiative, offering its medicine and vaccine portfolio on a not-for-profit basis to low-income countries.
In-Depth Natural Melatonin Supplement Industry Market Outlook
The natural melatonin supplement market exhibits significant growth potential. Continued advancements in product formulations, coupled with growing awareness of sleep health and the rising popularity of natural remedies, will fuel demand. Strategic partnerships, market expansion into new regions, and increased investment in research and development will further accelerate growth. Companies with strong brands, innovative products, and effective marketing strategies are poised to capitalize on this expanding market opportunity.
[Insert 150-word paragraph summarizing growth accelerators and future market potential.]
Natural Melatonin Supplement Industry Segmentation
-
1. Type
- 1.1. Natural Melatonin
- 1.2. Synthetic Melatonin
-
2. Application
- 2.1. Medical
- 2.2. Dietary Supplement
Natural Melatonin Supplement Industry Segmentation By Geography
-
1. Asia Pacific
- 1.1. China
- 1.2. India
- 1.3. Japan
- 1.4. South Korea
- 1.5. Rest of Asia Pacific
-
2. North America
- 2.1. United States
- 2.2. Canada
- 2.3. Mexico
-
3. Europe
- 3.1. Germany
- 3.2. United Kingdom
- 3.3. France
- 3.4. Italy
- 3.5. Rest of Europe
-
4. South America
- 4.1. Brazil
- 4.2. Argentina
- 4.3. Rest of South America
-
5. Middle East and Africa
- 5.1. Saudi Arabia
- 5.2. South Africa
- 5.3. UAE
- 5.4. Rest of Middle East and Africa
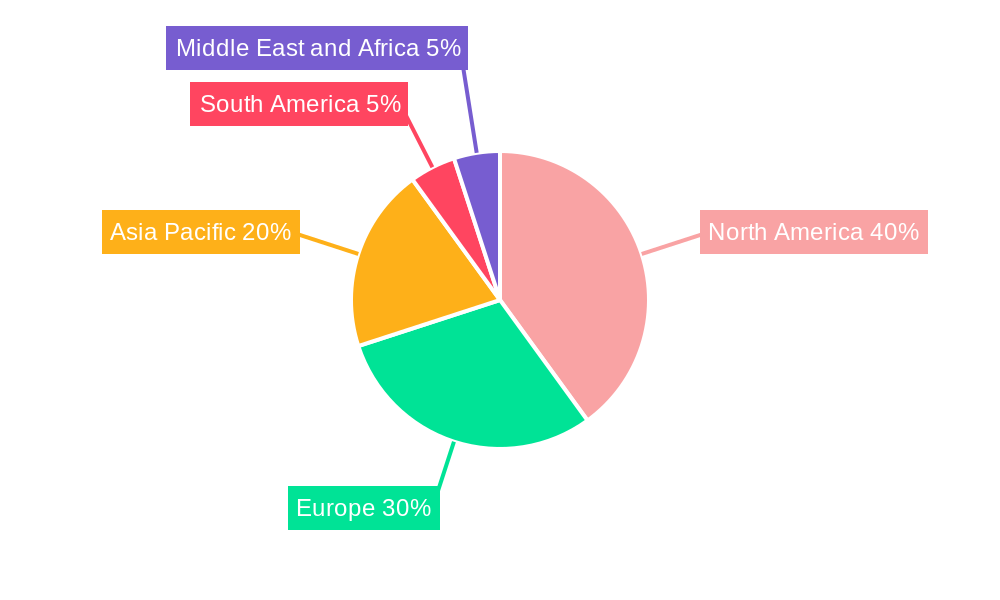
Natural Melatonin Supplement Industry Regional Market Share
Geographic Coverage of Natural Melatonin Supplement Industry
Natural Melatonin Supplement Industry REPORT HIGHLIGHTS
| Aspects | Details |
|---|---|
| Study Period | 2020-2034 |
| Base Year | 2025 |
| Estimated Year | 2026 |
| Forecast Period | 2026-2034 |
| Historical Period | 2020-2025 |
| Growth Rate | CAGR of 10% from 2020-2034 |
| Segmentation |
|
Table of Contents
- 1. Introduction
- 1.1. Research Scope
- 1.2. Market Segmentation
- 1.3. Research Objective
- 1.4. Definitions and Assumptions
- 2. Executive Summary
- 2.1. Market Snapshot
- 3. Market Dynamics
- 3.1. Market Drivers
- 3.2. Market Restrains
- 3.3. Market Trends
- 3.4. Market Opportunities
- 4. Market Factor Analysis
- 4.1. Porters Five Forces
- 4.1.1. Bargaining Power of Suppliers
- 4.1.2. Bargaining Power of Buyers
- 4.1.3. Threat of New Entrants
- 4.1.4. Threat of Substitutes
- 4.1.5. Competitive Rivalry
- 4.2. PESTEL analysis
- 4.3. BCG Analysis
- 4.3.1. Stars (High Growth, High Market Share)
- 4.3.2. Cash Cows (Low Growth, High Market Share)
- 4.3.3. Question Mark (High Growth, Low Market Share)
- 4.3.4. Dogs (Low Growth, Low Market Share)
- 4.4. Ansoff Matrix Analysis
- 4.5. Supply Chain Analysis
- 4.6. Regulatory Landscape
- 4.7. Current Market Potential and Opportunity Assessment (TAM–SAM–SOM Framework)
- 4.8. VDR Analyst Note
- 4.1. Porters Five Forces
- 5. Market Analysis, Insights and Forecast 2021-2033
- 5.1. Market Analysis, Insights and Forecast - by Type
- 5.1.1. Natural Melatonin
- 5.1.2. Synthetic Melatonin
- 5.2. Market Analysis, Insights and Forecast - by Application
- 5.2.1. Medical
- 5.2.2. Dietary Supplement
- 5.3. Market Analysis, Insights and Forecast - by Region
- 5.3.1. Asia Pacific
- 5.3.2. North America
- 5.3.3. Europe
- 5.3.4. South America
- 5.3.5. Middle East and Africa
- 5.1. Market Analysis, Insights and Forecast - by Type
- 6. Global Natural Melatonin Supplement Industry Analysis, Insights and Forecast, 2021-2033
- 6.1. Market Analysis, Insights and Forecast - by Type
- 6.1.1. Natural Melatonin
- 6.1.2. Synthetic Melatonin
- 6.2. Market Analysis, Insights and Forecast - by Application
- 6.2.1. Medical
- 6.2.2. Dietary Supplement
- 6.1. Market Analysis, Insights and Forecast - by Type
- 7. Asia Pacific Natural Melatonin Supplement Industry Analysis, Insights and Forecast, 2021-2033
- 7.1. Market Analysis, Insights and Forecast - by Type
- 7.1.1. Natural Melatonin
- 7.1.2. Synthetic Melatonin
- 7.2. Market Analysis, Insights and Forecast - by Application
- 7.2.1. Medical
- 7.2.2. Dietary Supplement
- 7.1. Market Analysis, Insights and Forecast - by Type
- 8. North America Natural Melatonin Supplement Industry Analysis, Insights and Forecast, 2021-2033
- 8.1. Market Analysis, Insights and Forecast - by Type
- 8.1.1. Natural Melatonin
- 8.1.2. Synthetic Melatonin
- 8.2. Market Analysis, Insights and Forecast - by Application
- 8.2.1. Medical
- 8.2.2. Dietary Supplement
- 8.1. Market Analysis, Insights and Forecast - by Type
- 9. Europe Natural Melatonin Supplement Industry Analysis, Insights and Forecast, 2021-2033
- 9.1. Market Analysis, Insights and Forecast - by Type
- 9.1.1. Natural Melatonin
- 9.1.2. Synthetic Melatonin
- 9.2. Market Analysis, Insights and Forecast - by Application
- 9.2.1. Medical
- 9.2.2. Dietary Supplement
- 9.1. Market Analysis, Insights and Forecast - by Type
- 10. South America Natural Melatonin Supplement Industry Analysis, Insights and Forecast, 2021-2033
- 10.1. Market Analysis, Insights and Forecast - by Type
- 10.1.1. Natural Melatonin
- 10.1.2. Synthetic Melatonin
- 10.2. Market Analysis, Insights and Forecast - by Application
- 10.2.1. Medical
- 10.2.2. Dietary Supplement
- 10.1. Market Analysis, Insights and Forecast - by Type
- 11. Middle East and Africa Natural Melatonin Supplement Industry Analysis, Insights and Forecast, 2021-2033
- 11.1. Market Analysis, Insights and Forecast - by Type
- 11.1.1. Natural Melatonin
- 11.1.2. Synthetic Melatonin
- 11.2. Market Analysis, Insights and Forecast - by Application
- 11.2.1. Medical
- 11.2.2. Dietary Supplement
- 11.1. Market Analysis, Insights and Forecast - by Type
- 12. Competitive Analysis
- 12.1. Company Profiles
- 12.1.1 B JOSHI AGROCHEM PHARMA
- 12.1.1.1. Company Overview
- 12.1.1.2. Products
- 12.1.1.3. Company Financials
- 12.1.1.4. SWOT Analysis
- 12.1.2 Church & Dwight Co Inc
- 12.1.2.1. Company Overview
- 12.1.2.2. Products
- 12.1.2.3. Company Financials
- 12.1.2.4. SWOT Analysis
- 12.1.3 NCFI Polyurethanes
- 12.1.3.1. Company Overview
- 12.1.3.2. Products
- 12.1.3.3. Company Financials
- 12.1.3.4. SWOT Analysis
- 12.1.4 Solgar Inc
- 12.1.4.1. Company Overview
- 12.1.4.2. Products
- 12.1.4.3. Company Financials
- 12.1.4.4. SWOT Analysis
- 12.1.5 Rexall Sundown Inc
- 12.1.5.1. Company Overview
- 12.1.5.2. Products
- 12.1.5.3. Company Financials
- 12.1.5.4. SWOT Analysis
- 12.1.6 Nature's Bounty
- 12.1.6.1. Company Overview
- 12.1.6.2. Products
- 12.1.6.3. Company Financials
- 12.1.6.4. SWOT Analysis
- 12.1.7 Aurobindo Pharma
- 12.1.7.1. Company Overview
- 12.1.7.2. Products
- 12.1.7.3. Company Financials
- 12.1.7.4. SWOT Analysis
- 12.1.8 Aspen Holdings
- 12.1.8.1. Company Overview
- 12.1.8.2. Products
- 12.1.8.3. Company Financials
- 12.1.8.4. SWOT Analysis
- 12.1.9 Biotics Research Corporation
- 12.1.9.1. Company Overview
- 12.1.9.2. Products
- 12.1.9.3. Company Financials
- 12.1.9.4. SWOT Analysis
- 12.1.10 Pharmavite
- 12.1.10.1. Company Overview
- 12.1.10.2. Products
- 12.1.10.3. Company Financials
- 12.1.10.4. SWOT Analysis
- 12.1.11 Jameison
- 12.1.11.1. Company Overview
- 12.1.11.2. Products
- 12.1.11.3. Company Financials
- 12.1.11.4. SWOT Analysis
- 12.1.12 Natrol LLC
- 12.1.12.1. Company Overview
- 12.1.12.2. Products
- 12.1.12.3. Company Financials
- 12.1.12.4. SWOT Analysis
- 12.1.13 Pfizer Inc
- 12.1.13.1. Company Overview
- 12.1.13.2. Products
- 12.1.13.3. Company Financials
- 12.1.13.4. SWOT Analysis
- 12.1.1 B JOSHI AGROCHEM PHARMA
- 12.2. Market Entropy
- 12.2.1 Company's Key Areas Served
- 12.2.2 Recent Developments
- 12.3. Company Market Share Analysis 2025
- 12.3.1 Top 5 Companies Market Share Analysis
- 12.3.2 Top 3 Companies Market Share Analysis
- 12.4. List of Potential Customers
- 13. Research Methodology
List of Figures
- Figure 1: Global Natural Melatonin Supplement Industry Revenue Breakdown (million, %) by Region 2025 & 2033
- Figure 2: Global Natural Melatonin Supplement Industry Volume Breakdown (K Tons, %) by Region 2025 & 2033
- Figure 3: Asia Pacific Natural Melatonin Supplement Industry Revenue (million), by Type 2025 & 2033
- Figure 4: Asia Pacific Natural Melatonin Supplement Industry Volume (K Tons), by Type 2025 & 2033
- Figure 5: Asia Pacific Natural Melatonin Supplement Industry Revenue Share (%), by Type 2025 & 2033
- Figure 6: Asia Pacific Natural Melatonin Supplement Industry Volume Share (%), by Type 2025 & 2033
- Figure 7: Asia Pacific Natural Melatonin Supplement Industry Revenue (million), by Application 2025 & 2033
- Figure 8: Asia Pacific Natural Melatonin Supplement Industry Volume (K Tons), by Application 2025 & 2033
- Figure 9: Asia Pacific Natural Melatonin Supplement Industry Revenue Share (%), by Application 2025 & 2033
- Figure 10: Asia Pacific Natural Melatonin Supplement Industry Volume Share (%), by Application 2025 & 2033
- Figure 11: Asia Pacific Natural Melatonin Supplement Industry Revenue (million), by Country 2025 & 2033
- Figure 12: Asia Pacific Natural Melatonin Supplement Industry Volume (K Tons), by Country 2025 & 2033
- Figure 13: Asia Pacific Natural Melatonin Supplement Industry Revenue Share (%), by Country 2025 & 2033
- Figure 14: Asia Pacific Natural Melatonin Supplement Industry Volume Share (%), by Country 2025 & 2033
- Figure 15: North America Natural Melatonin Supplement Industry Revenue (million), by Type 2025 & 2033
- Figure 16: North America Natural Melatonin Supplement Industry Volume (K Tons), by Type 2025 & 2033
- Figure 17: North America Natural Melatonin Supplement Industry Revenue Share (%), by Type 2025 & 2033
- Figure 18: North America Natural Melatonin Supplement Industry Volume Share (%), by Type 2025 & 2033
- Figure 19: North America Natural Melatonin Supplement Industry Revenue (million), by Application 2025 & 2033
- Figure 20: North America Natural Melatonin Supplement Industry Volume (K Tons), by Application 2025 & 2033
- Figure 21: North America Natural Melatonin Supplement Industry Revenue Share (%), by Application 2025 & 2033
- Figure 22: North America Natural Melatonin Supplement Industry Volume Share (%), by Application 2025 & 2033
- Figure 23: North America Natural Melatonin Supplement Industry Revenue (million), by Country 2025 & 2033
- Figure 24: North America Natural Melatonin Supplement Industry Volume (K Tons), by Country 2025 & 2033
- Figure 25: North America Natural Melatonin Supplement Industry Revenue Share (%), by Country 2025 & 2033
- Figure 26: North America Natural Melatonin Supplement Industry Volume Share (%), by Country 2025 & 2033
- Figure 27: Europe Natural Melatonin Supplement Industry Revenue (million), by Type 2025 & 2033
- Figure 28: Europe Natural Melatonin Supplement Industry Volume (K Tons), by Type 2025 & 2033
- Figure 29: Europe Natural Melatonin Supplement Industry Revenue Share (%), by Type 2025 & 2033
- Figure 30: Europe Natural Melatonin Supplement Industry Volume Share (%), by Type 2025 & 2033
- Figure 31: Europe Natural Melatonin Supplement Industry Revenue (million), by Application 2025 & 2033
- Figure 32: Europe Natural Melatonin Supplement Industry Volume (K Tons), by Application 2025 & 2033
- Figure 33: Europe Natural Melatonin Supplement Industry Revenue Share (%), by Application 2025 & 2033
- Figure 34: Europe Natural Melatonin Supplement Industry Volume Share (%), by Application 2025 & 2033
- Figure 35: Europe Natural Melatonin Supplement Industry Revenue (million), by Country 2025 & 2033
- Figure 36: Europe Natural Melatonin Supplement Industry Volume (K Tons), by Country 2025 & 2033
- Figure 37: Europe Natural Melatonin Supplement Industry Revenue Share (%), by Country 2025 & 2033
- Figure 38: Europe Natural Melatonin Supplement Industry Volume Share (%), by Country 2025 & 2033
- Figure 39: South America Natural Melatonin Supplement Industry Revenue (million), by Type 2025 & 2033
- Figure 40: South America Natural Melatonin Supplement Industry Volume (K Tons), by Type 2025 & 2033
- Figure 41: South America Natural Melatonin Supplement Industry Revenue Share (%), by Type 2025 & 2033
- Figure 42: South America Natural Melatonin Supplement Industry Volume Share (%), by Type 2025 & 2033
- Figure 43: South America Natural Melatonin Supplement Industry Revenue (million), by Application 2025 & 2033
- Figure 44: South America Natural Melatonin Supplement Industry Volume (K Tons), by Application 2025 & 2033
- Figure 45: South America Natural Melatonin Supplement Industry Revenue Share (%), by Application 2025 & 2033
- Figure 46: South America Natural Melatonin Supplement Industry Volume Share (%), by Application 2025 & 2033
- Figure 47: South America Natural Melatonin Supplement Industry Revenue (million), by Country 2025 & 2033
- Figure 48: South America Natural Melatonin Supplement Industry Volume (K Tons), by Country 2025 & 2033
- Figure 49: South America Natural Melatonin Supplement Industry Revenue Share (%), by Country 2025 & 2033
- Figure 50: South America Natural Melatonin Supplement Industry Volume Share (%), by Country 2025 & 2033
- Figure 51: Middle East and Africa Natural Melatonin Supplement Industry Revenue (million), by Type 2025 & 2033
- Figure 52: Middle East and Africa Natural Melatonin Supplement Industry Volume (K Tons), by Type 2025 & 2033
- Figure 53: Middle East and Africa Natural Melatonin Supplement Industry Revenue Share (%), by Type 2025 & 2033
- Figure 54: Middle East and Africa Natural Melatonin Supplement Industry Volume Share (%), by Type 2025 & 2033
- Figure 55: Middle East and Africa Natural Melatonin Supplement Industry Revenue (million), by Application 2025 & 2033
- Figure 56: Middle East and Africa Natural Melatonin Supplement Industry Volume (K Tons), by Application 2025 & 2033
- Figure 57: Middle East and Africa Natural Melatonin Supplement Industry Revenue Share (%), by Application 2025 & 2033
- Figure 58: Middle East and Africa Natural Melatonin Supplement Industry Volume Share (%), by Application 2025 & 2033
- Figure 59: Middle East and Africa Natural Melatonin Supplement Industry Revenue (million), by Country 2025 & 2033
- Figure 60: Middle East and Africa Natural Melatonin Supplement Industry Volume (K Tons), by Country 2025 & 2033
- Figure 61: Middle East and Africa Natural Melatonin Supplement Industry Revenue Share (%), by Country 2025 & 2033
- Figure 62: Middle East and Africa Natural Melatonin Supplement Industry Volume Share (%), by Country 2025 & 2033
List of Tables
- Table 1: Global Natural Melatonin Supplement Industry Revenue million Forecast, by Type 2020 & 2033
- Table 2: Global Natural Melatonin Supplement Industry Volume K Tons Forecast, by Type 2020 & 2033
- Table 3: Global Natural Melatonin Supplement Industry Revenue million Forecast, by Application 2020 & 2033
- Table 4: Global Natural Melatonin Supplement Industry Volume K Tons Forecast, by Application 2020 & 2033
- Table 5: Global Natural Melatonin Supplement Industry Revenue million Forecast, by Region 2020 & 2033
- Table 6: Global Natural Melatonin Supplement Industry Volume K Tons Forecast, by Region 2020 & 2033
- Table 7: Global Natural Melatonin Supplement Industry Revenue million Forecast, by Type 2020 & 2033
- Table 8: Global Natural Melatonin Supplement Industry Volume K Tons Forecast, by Type 2020 & 2033
- Table 9: Global Natural Melatonin Supplement Industry Revenue million Forecast, by Application 2020 & 2033
- Table 10: Global Natural Melatonin Supplement Industry Volume K Tons Forecast, by Application 2020 & 2033
- Table 11: Global Natural Melatonin Supplement Industry Revenue million Forecast, by Country 2020 & 2033
- Table 12: Global Natural Melatonin Supplement Industry Volume K Tons Forecast, by Country 2020 & 2033
- Table 13: China Natural Melatonin Supplement Industry Revenue (million) Forecast, by Application 2020 & 2033
- Table 14: China Natural Melatonin Supplement Industry Volume (K Tons) Forecast, by Application 2020 & 2033
- Table 15: India Natural Melatonin Supplement Industry Revenue (million) Forecast, by Application 2020 & 2033
- Table 16: India Natural Melatonin Supplement Industry Volume (K Tons) Forecast, by Application 2020 & 2033
- Table 17: Japan Natural Melatonin Supplement Industry Revenue (million) Forecast, by Application 2020 & 2033
- Table 18: Japan Natural Melatonin Supplement Industry Volume (K Tons) Forecast, by Application 2020 & 2033
- Table 19: South Korea Natural Melatonin Supplement Industry Revenue (million) Forecast, by Application 2020 & 2033
- Table 20: South Korea Natural Melatonin Supplement Industry Volume (K Tons) Forecast, by Application 2020 & 2033
- Table 21: Rest of Asia Pacific Natural Melatonin Supplement Industry Revenue (million) Forecast, by Application 2020 & 2033
- Table 22: Rest of Asia Pacific Natural Melatonin Supplement Industry Volume (K Tons) Forecast, by Application 2020 & 2033
- Table 23: Global Natural Melatonin Supplement Industry Revenue million Forecast, by Type 2020 & 2033
- Table 24: Global Natural Melatonin Supplement Industry Volume K Tons Forecast, by Type 2020 & 2033
- Table 25: Global Natural Melatonin Supplement Industry Revenue million Forecast, by Application 2020 & 2033
- Table 26: Global Natural Melatonin Supplement Industry Volume K Tons Forecast, by Application 2020 & 2033
- Table 27: Global Natural Melatonin Supplement Industry Revenue million Forecast, by Country 2020 & 2033
- Table 28: Global Natural Melatonin Supplement Industry Volume K Tons Forecast, by Country 2020 & 2033
- Table 29: United States Natural Melatonin Supplement Industry Revenue (million) Forecast, by Application 2020 & 2033
- Table 30: United States Natural Melatonin Supplement Industry Volume (K Tons) Forecast, by Application 2020 & 2033
- Table 31: Canada Natural Melatonin Supplement Industry Revenue (million) Forecast, by Application 2020 & 2033
- Table 32: Canada Natural Melatonin Supplement Industry Volume (K Tons) Forecast, by Application 2020 & 2033
- Table 33: Mexico Natural Melatonin Supplement Industry Revenue (million) Forecast, by Application 2020 & 2033
- Table 34: Mexico Natural Melatonin Supplement Industry Volume (K Tons) Forecast, by Application 2020 & 2033
- Table 35: Global Natural Melatonin Supplement Industry Revenue million Forecast, by Type 2020 & 2033
- Table 36: Global Natural Melatonin Supplement Industry Volume K Tons Forecast, by Type 2020 & 2033
- Table 37: Global Natural Melatonin Supplement Industry Revenue million Forecast, by Application 2020 & 2033
- Table 38: Global Natural Melatonin Supplement Industry Volume K Tons Forecast, by Application 2020 & 2033
- Table 39: Global Natural Melatonin Supplement Industry Revenue million Forecast, by Country 2020 & 2033
- Table 40: Global Natural Melatonin Supplement Industry Volume K Tons Forecast, by Country 2020 & 2033
- Table 41: Germany Natural Melatonin Supplement Industry Revenue (million) Forecast, by Application 2020 & 2033
- Table 42: Germany Natural Melatonin Supplement Industry Volume (K Tons) Forecast, by Application 2020 & 2033
- Table 43: United Kingdom Natural Melatonin Supplement Industry Revenue (million) Forecast, by Application 2020 & 2033
- Table 44: United Kingdom Natural Melatonin Supplement Industry Volume (K Tons) Forecast, by Application 2020 & 2033
- Table 45: France Natural Melatonin Supplement Industry Revenue (million) Forecast, by Application 2020 & 2033
- Table 46: France Natural Melatonin Supplement Industry Volume (K Tons) Forecast, by Application 2020 & 2033
- Table 47: Italy Natural Melatonin Supplement Industry Revenue (million) Forecast, by Application 2020 & 2033
- Table 48: Italy Natural Melatonin Supplement Industry Volume (K Tons) Forecast, by Application 2020 & 2033
- Table 49: Rest of Europe Natural Melatonin Supplement Industry Revenue (million) Forecast, by Application 2020 & 2033
- Table 50: Rest of Europe Natural Melatonin Supplement Industry Volume (K Tons) Forecast, by Application 2020 & 2033
- Table 51: Global Natural Melatonin Supplement Industry Revenue million Forecast, by Type 2020 & 2033
- Table 52: Global Natural Melatonin Supplement Industry Volume K Tons Forecast, by Type 2020 & 2033
- Table 53: Global Natural Melatonin Supplement Industry Revenue million Forecast, by Application 2020 & 2033
- Table 54: Global Natural Melatonin Supplement Industry Volume K Tons Forecast, by Application 2020 & 2033
- Table 55: Global Natural Melatonin Supplement Industry Revenue million Forecast, by Country 2020 & 2033
- Table 56: Global Natural Melatonin Supplement Industry Volume K Tons Forecast, by Country 2020 & 2033
- Table 57: Brazil Natural Melatonin Supplement Industry Revenue (million) Forecast, by Application 2020 & 2033
- Table 58: Brazil Natural Melatonin Supplement Industry Volume (K Tons) Forecast, by Application 2020 & 2033
- Table 59: Argentina Natural Melatonin Supplement Industry Revenue (million) Forecast, by Application 2020 & 2033
- Table 60: Argentina Natural Melatonin Supplement Industry Volume (K Tons) Forecast, by Application 2020 & 2033
- Table 61: Rest of South America Natural Melatonin Supplement Industry Revenue (million) Forecast, by Application 2020 & 2033
- Table 62: Rest of South America Natural Melatonin Supplement Industry Volume (K Tons) Forecast, by Application 2020 & 2033
- Table 63: Global Natural Melatonin Supplement Industry Revenue million Forecast, by Type 2020 & 2033
- Table 64: Global Natural Melatonin Supplement Industry Volume K Tons Forecast, by Type 2020 & 2033
- Table 65: Global Natural Melatonin Supplement Industry Revenue million Forecast, by Application 2020 & 2033
- Table 66: Global Natural Melatonin Supplement Industry Volume K Tons Forecast, by Application 2020 & 2033
- Table 67: Global Natural Melatonin Supplement Industry Revenue million Forecast, by Country 2020 & 2033
- Table 68: Global Natural Melatonin Supplement Industry Volume K Tons Forecast, by Country 2020 & 2033
- Table 69: Saudi Arabia Natural Melatonin Supplement Industry Revenue (million) Forecast, by Application 2020 & 2033
- Table 70: Saudi Arabia Natural Melatonin Supplement Industry Volume (K Tons) Forecast, by Application 2020 & 2033
- Table 71: South Africa Natural Melatonin Supplement Industry Revenue (million) Forecast, by Application 2020 & 2033
- Table 72: South Africa Natural Melatonin Supplement Industry Volume (K Tons) Forecast, by Application 2020 & 2033
- Table 73: UAE Natural Melatonin Supplement Industry Revenue (million) Forecast, by Application 2020 & 2033
- Table 74: UAE Natural Melatonin Supplement Industry Volume (K Tons) Forecast, by Application 2020 & 2033
- Table 75: Rest of Middle East and Africa Natural Melatonin Supplement Industry Revenue (million) Forecast, by Application 2020 & 2033
- Table 76: Rest of Middle East and Africa Natural Melatonin Supplement Industry Volume (K Tons) Forecast, by Application 2020 & 2033
Frequently Asked Questions
1. What is the projected Compound Annual Growth Rate (CAGR) of the Natural Melatonin Supplement Industry?
The projected CAGR is approximately 10%.
2. Which companies are prominent players in the Natural Melatonin Supplement Industry?
Key companies in the market include B JOSHI AGROCHEM PHARMA, Church & Dwight Co Inc, NCFI Polyurethanes, Solgar Inc, Rexall Sundown Inc, Nature's Bounty, Aurobindo Pharma, Aspen Holdings, Biotics Research Corporation, Pharmavite, Jameison, Natrol LLC, Pfizer Inc.
3. What are the main segments of the Natural Melatonin Supplement Industry?
The market segments include Type, Application.
4. Can you provide details about the market size?
The market size is estimated to be USD 529.86 million as of 2022.
5. What are some drivers contributing to market growth?
Increasing Demand for Melatonin from the Medical Sector; Other Drivers.
6. What are the notable trends driving market growth?
Increasing Demand for Melatonin from the Medical Industry.
7. Are there any restraints impacting market growth?
Government Regulations on the Use of Melatonin in Insomnia Medicine; Other Restraints.
8. Can you provide examples of recent developments in the market?
January 2023: Pfizer Inc. announced that it has significantly increased its commitment to the "Agreement for a Healthier World" by offering the entire portfolio of medicines and vaccines for which it has global rights on a not-for-profit basis in order to improve the health of 1.2 billion people in 45 low-income countries.
9. What pricing options are available for accessing the report?
Pricing options include single-user, multi-user, and enterprise licenses priced at USD 4750, USD 5250, and USD 8750 respectively.
10. Is the market size provided in terms of value or volume?
The market size is provided in terms of value, measured in million and volume, measured in K Tons.
11. Are there any specific market keywords associated with the report?
Yes, the market keyword associated with the report is "Natural Melatonin Supplement Industry," which aids in identifying and referencing the specific market segment covered.
12. How do I determine which pricing option suits my needs best?
The pricing options vary based on user requirements and access needs. Individual users may opt for single-user licenses, while businesses requiring broader access may choose multi-user or enterprise licenses for cost-effective access to the report.
13. Are there any additional resources or data provided in the Natural Melatonin Supplement Industry report?
While the report offers comprehensive insights, it's advisable to review the specific contents or supplementary materials provided to ascertain if additional resources or data are available.
14. How can I stay updated on further developments or reports in the Natural Melatonin Supplement Industry?
To stay informed about further developments, trends, and reports in the Natural Melatonin Supplement Industry, consider subscribing to industry newsletters, following relevant companies and organizations, or regularly checking reputable industry news sources and publications.
Methodology
Step 1 - Identification of Relevant Samples Size from Population Database


Step 2 - Approaches for Defining Global Market Size (Value, Volume* & Price*)

Note*: In applicable scenarios
Step 3 - Data Sources
Primary Research
- Web Analytics
- Survey Reports
- Research Institute
- Latest Research Reports
- Opinion Leaders
Secondary Research
- Annual Reports
- White Paper
- Latest Press Release
- Industry Association
- Paid Database
- Investor Presentations

Step 4 - Data Triangulation
Involves using different sources of information in order to increase the validity of a study
These sources are likely to be stakeholders in a program - participants, other researchers, program staff, other community members, and so on.
Then we put all data in single framework & apply various statistical tools to find out the dynamic on the market.
During the analysis stage, feedback from the stakeholder groups would be compared to determine areas of agreement as well as areas of divergence