

Key Insights
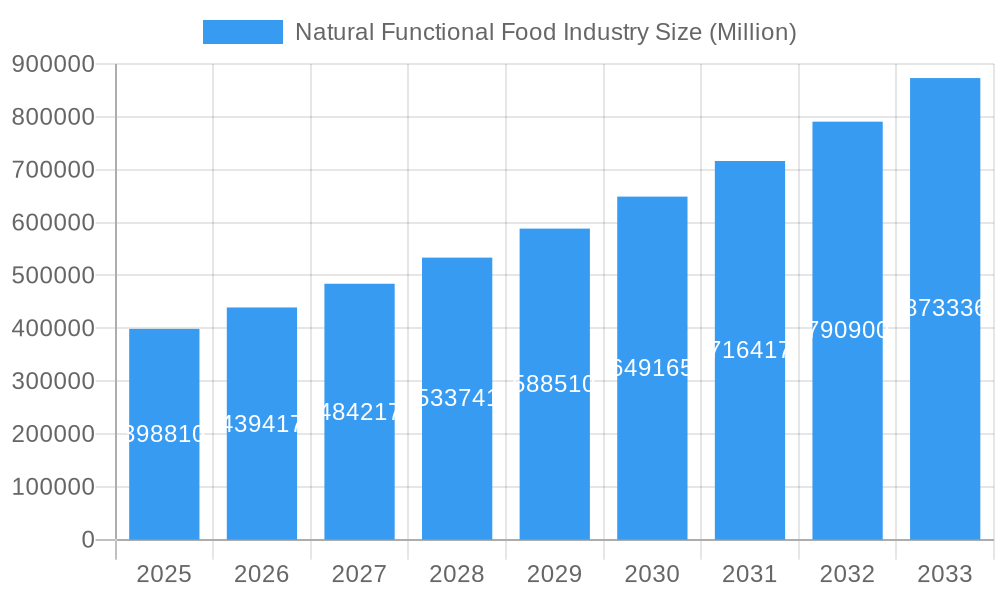
The Natural Functional Food Industry is poised for significant expansion, projected to reach a robust $398.81 billion by 2025. This impressive growth is underpinned by a CAGR of 10.33%, indicating a sustained upward trajectory throughout the forecast period (2025-2033). This surge is primarily driven by an increasing consumer demand for products that offer health benefits beyond basic nutrition, fueled by a growing awareness of preventative healthcare and a desire for natural, ingredient-driven wellness solutions. Key trends shaping the market include the rising popularity of plant-based functional ingredients, personalized nutrition solutions, and a focus on immunity-boosting and gut health products. The industry is witnessing innovation across various product categories, with consumers actively seeking functional foods that align with their lifestyle choices and specific health goals.
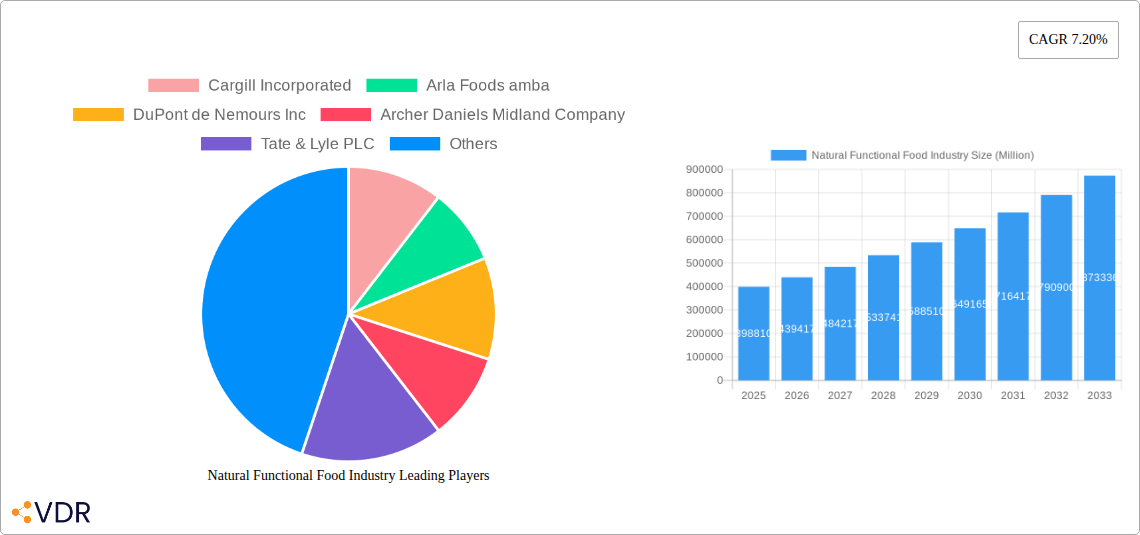
Natural Functional Food Industry Market Size (In Billion)
The market's expansion is also influenced by a favorable regulatory landscape in many regions, encouraging the development and marketing of functional food products. However, certain restraints exist, including the cost of sourcing high-quality natural ingredients and potential consumer skepticism regarding the efficacy of some functional claims, necessitating rigorous scientific backing and transparent labeling. The industry is segmented into diverse types of functional ingredients, with Vitamins, Minerals, and Probiotics emerging as dominant categories due to their well-established health benefits and widespread consumer recognition. Applications span across major food sectors, with Bakery & Cereals and Dairy & Dairy Alternative Products leading the adoption of functional ingredients. Leading companies like Cargill Incorporated, Arla Foods amba, and DuPont de Nemours Inc. are actively investing in research and development, strategic partnerships, and product innovation to capitalize on these growth opportunities, further solidifying the industry's positive outlook.
Natural Functional Food Industry Company Market Share
Natural Functional Food Industry Report: Unlocking Health & Wellness Market Growth
Gain critical insights into the burgeoning Natural Functional Food Industry with this comprehensive market analysis. This report delves into market dynamics, growth trajectories, regional dominance, product innovations, key drivers, emerging opportunities, and the strategic landscape shaped by industry leaders. Designed for market professionals, ingredient manufacturers, food developers, and investors, this analysis provides an unparalleled understanding of the global functional food ingredients market.
Study Period: 2019–2033 | Base Year: 2025 | Estimated Year: 2025 | Forecast Period: 2025–2033 | Historical Period: 2019–2024
Natural Functional Food Industry Market Dynamics & Structure
The natural functional food industry exhibits a moderately concentrated market structure, with a blend of large multinational corporations and specialized ingredient suppliers vying for market share. Technological innovation remains a paramount driver, fueled by advancements in biotechnology, fermentation techniques, and ingredient processing. Regulatory frameworks, while evolving to ensure consumer safety and product efficacy, also present both opportunities for product differentiation and barriers to entry. Competitive product substitutes, ranging from traditional supplements to fortified foods, necessitate continuous innovation and value proposition enhancement. End-user demographics are increasingly health-conscious and seeking preventative health solutions, driving demand for products with scientifically validated benefits. Mergers and acquisitions (M&A) are a significant trend, as companies seek to expand their product portfolios, enhance R&D capabilities, and gain access to new markets. For instance, the global functional food ingredients market is projected to reach $300 billion by 2025, with M&A activities contributing an estimated 15% to this growth through portfolio expansion and synergistic integrations. Innovation barriers include the high cost of clinical trials and the complexities of sourcing sustainable and natural ingredients.
- Market Concentration: Dominated by a few key players but with a significant presence of niche manufacturers.
- Technological Innovation: Driven by advancements in bioavailability, ingredient stability, and novel extraction methods.
- Regulatory Frameworks: Varying by region, impacting product claims and ingredient approvals.
- Competitive Landscape: Intense competition from both direct functional food products and traditional supplements.
- End-User Demographics: Growing demand from aging populations and health-conscious millennials.
- M&A Trends: Strategic acquisitions aimed at strengthening ingredient portfolios and market reach.
Natural Functional Food Industry Growth Trends & Insights
The natural functional food industry is poised for robust growth, driven by an escalating global demand for health-promoting food ingredients. This market is projected to witness a Compound Annual Growth Rate (CAGR) of approximately 7.5% between 2025 and 2033, with the global market size expected to reach an impressive $450 billion by the end of the forecast period. The increasing consumer awareness regarding the link between diet and health, coupled with a rising prevalence of lifestyle-related diseases, is acting as a significant catalyst. Technological disruptions, such as advancements in encapsulation technologies and precision fermentation, are enabling the development of more effective and bioavailable functional ingredients. Consumer behavior shifts are marked by a preference for natural, clean-label products and a willingness to pay a premium for functional benefits. The adoption rates for functional food ingredients in everyday food products are steadily increasing, indicating a market penetration that is moving beyond niche segments. For example, the probiotics segment alone is anticipated to grow at a CAGR of 8.2%, reflecting its widespread consumer appeal for digestive health. The focus on personalized nutrition and the growing interest in plant-based functional ingredients are also shaping the market's evolution, creating new avenues for innovation and product development.
Dominant Regions, Countries, or Segments in Natural Functional Food Industry
North America currently holds a dominant position in the natural functional food industry, driven by a highly health-conscious consumer base, robust research and development infrastructure, and supportive regulatory environments. The United States, in particular, accounts for a substantial portion of the global market share within this region, estimated at 35%, owing to strong consumer demand for vitamins, minerals, and omega-3 fatty acids in food and beverages. The 'Other Types' segment, encompassing a broad range of specialized natural compounds and botanicals, is experiencing rapid growth due to the rising popularity of adaptogens and nootropics.
- North America's Dominance: Characterized by high disposable incomes, advanced food processing technologies, and a proactive approach to health and wellness.
- United States Market Leadership: Fueled by extensive product innovation, widespread availability of functional ingredients, and aggressive marketing by major food corporations.
- Key Driver - Consumer Awareness: North American consumers are well-informed about the health benefits of functional ingredients and actively seek them out.
- Application Dominance in North America: Bakery & Cereals and Dairy & Dairy Alternative Products segments are leading application areas, incorporating functional ingredients to enhance nutritional profiles and consumer appeal. The dairy sector, for instance, has seen a significant influx of probiotic-enhanced yogurts and fortified milk alternatives, contributing an estimated $50 billion to the regional market in 2025.
- Emerging Markets: While North America leads, Asia-Pacific is emerging as a high-growth region due to increasing health awareness and rising disposable incomes, projected to exhibit a CAGR of 9.1% from 2025-2033.
Natural Functional Food Industry Product Landscape
The natural functional food industry is characterized by a dynamic product landscape brimming with innovative ingredient solutions and novel applications. Companies are focusing on developing ingredients with enhanced bioavailability and specific health benefits, such as gut health probiotics, cognitive-enhancing omega-3 fatty acids, and antioxidant-rich carotenoids. Product innovations are increasingly centered on clean labels and natural sourcing, appealing to the growing segment of consumers seeking transparency. Performance metrics for these ingredients are often measured by their efficacy in clinical studies and their ability to meet stringent regulatory standards for safety and labeling. Unique selling propositions include synergistic ingredient blends that offer multiple health benefits and the incorporation of traditional health ingredients into modern food formats. Technological advancements in extraction, purification, and stabilization are crucial for maintaining the potency and shelf-life of these natural functional ingredients.
Key Drivers, Barriers & Challenges in Natural Functional Food Industry
Key Drivers:
- Rising Health Consciousness: Growing global awareness of the link between diet and well-being fuels demand for functional ingredients.
- Aging Population: The expanding elderly demographic seeks products to manage age-related health concerns.
- Technological Advancements: Innovations in ingredient processing and bioavailability enhance product efficacy and appeal.
- Clean Label Trend: Consumer preference for natural, recognizable ingredients drives ingredient sourcing and formulation.
- Government Initiatives: Supportive policies and R&D funding in various countries promote functional food development.
Barriers & Challenges:
- Regulatory Hurdles: Stringent regulations regarding health claims and ingredient safety can slow product development and market entry.
- Supply Chain Volatility: Sourcing consistent, high-quality natural ingredients can be challenging due to environmental and geopolitical factors, impacting ingredient costs by an estimated 5-10%.
- Consumer Education: The need to educate consumers about the benefits and correct usage of functional ingredients.
- Cost of Production: Natural ingredient processing and R&D can be expensive, leading to higher product prices.
- Competition: Intense competition from both established functional food brands and traditional food manufacturers launching fortified products.
Emerging Opportunities in Natural Functional Food Industry
Emerging opportunities in the natural functional food industry lie in the burgeoning demand for personalized nutrition solutions, catering to individual dietary needs and health goals. The growing interest in plant-based and sustainable ingredients presents a significant avenue for innovation, with a focus on novel protein sources and functional botanicals. Untapped markets in developing economies, where health awareness is rapidly increasing, offer substantial growth potential. Furthermore, the development of functional ingredients for specific life stages, such as prenatal nutrition and senior health, represents a significant opportunity. The integration of smart packaging and digital platforms for ingredient traceability and consumer engagement also presents a forward-thinking opportunity.
Growth Accelerators in the Natural Functional Food Industry Industry
Technological breakthroughs in areas like precision fermentation and genetic engineering are accelerating the development of novel and highly effective functional ingredients, such as bio-engineered probiotics and specialized amino acids. Strategic partnerships between ingredient manufacturers, food producers, and research institutions are fostering collaborative innovation and market penetration. Market expansion strategies, including entry into emerging economies with growing middle classes and increasing disposable incomes, are significant growth catalysts. Furthermore, the development of functional ingredients with multi-benefit properties, addressing several health concerns simultaneously, is poised to drive significant long-term growth.
Key Players Shaping the Natural Functional Food Industry Market
- Cargill Incorporated
- Arla Foods amba
- DuPont de Nemours Inc
- Archer Daniels Midland Company
- Tate & Lyle PLC
- BASF SE
- Foodchem International Corporation
- Kerry Group
- Koninklijke DSM NV
- Ingredion Incorporated
Notable Milestones in Natural Functional Food Industry Sector
- October 2022: Teijin Limited launched the Teijin Meguro Institute Co., Ltd. to strengthen the company's development and manufacturing of probiotics for use in functional foods, providing functional food ingredients for probiotic products.
- April 2022: Life science company Bioberica launched new ingredients at Vitafoods Europe in Geneva, entering digestive health and skin & beauty markets. They also unveiled new functional food applications for their Collavant n2 native (undenatured) type II collagen ingredient for joint health.
- July 2021: Kerry Group acquired Biosearch Life for USD150 million, expanding its healthy ingredient portfolios, including probiotics and omega-3.
In-Depth Natural Functional Food Industry Market Outlook
The natural functional food industry's market outlook is exceptionally positive, driven by a convergence of powerful trends. Growth accelerators, including continuous innovation in bioactives, the increasing demand for preventative health solutions, and the expansion of distribution channels, will propel the market forward. Strategic investments in R&D and a focus on consumer-centric product development will solidify market leadership. Emerging opportunities in personalized nutrition and sustainable ingredient sourcing will pave the way for new market segments and revenue streams. The industry is projected to maintain a strong growth trajectory, making it a highly attractive sector for investors and stakeholders alike.
Natural Functional Food Industry Segmentation
-
1. Type
- 1.1. Vitamins
- 1.2. Minerals
- 1.3. Probiotics
- 1.4. Omega-3 & 6 Fatty Acids
- 1.5. Carotenoids
- 1.6. Proteins & Amino Acids
- 1.7. Other Types
-
2. Application
- 2.1. Bakery & Cereals
- 2.2. Dairy & Dairy Alternative Products
- 2.3. Meat & Seafood
- 2.4. Confectionery
- 2.5. Beverages
- 2.6. Other Applications
Natural Functional Food Industry Segmentation By Geography
-
1. North America
- 1.1. United States
- 1.2. Canada
- 1.3. Mexico
- 1.4. Rest of North America
-
2. Europe
- 2.1. Germany
- 2.2. United Kingdom
- 2.3. France
- 2.4. Russia
- 2.5. Italy
- 2.6. Spain
- 2.7. Rest of Europe
-
3. Asia Pacific
- 3.1. China
- 3.2. India
- 3.3. Japan
- 3.4. Australia
- 3.5. Rest of Asia Pacific
-
4. South America
- 4.1. Brazil
- 4.2. Argentina
- 4.3. Rest of South America
-
5. Middle East and Africa
- 5.1. United Arab Emirates
- 5.2. South Africa
- 5.3. Rest of Middle East and Africa
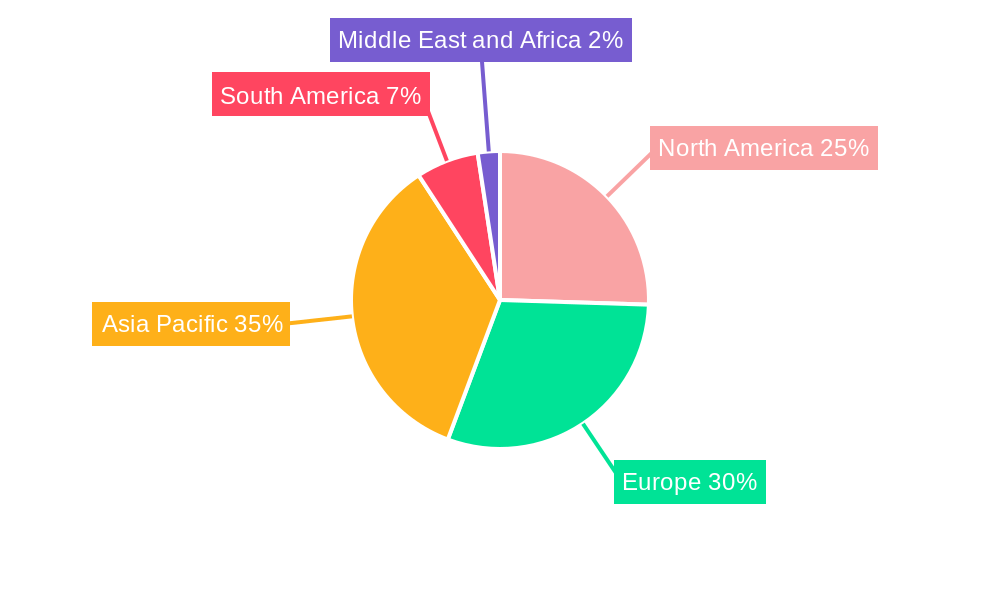
Natural Functional Food Industry Regional Market Share
Geographic Coverage of Natural Functional Food Industry
Natural Functional Food Industry REPORT HIGHLIGHTS
| Aspects | Details |
|---|---|
| Study Period | 2020-2034 |
| Base Year | 2025 |
| Estimated Year | 2026 |
| Forecast Period | 2026-2034 |
| Historical Period | 2020-2025 |
| Growth Rate | CAGR of 3.4% from 2020-2034 |
| Segmentation |
|
Table of Contents
- 1. Introduction
- 1.1. Research Scope
- 1.2. Market Segmentation
- 1.3. Research Objective
- 1.4. Definitions and Assumptions
- 2. Executive Summary
- 2.1. Market Snapshot
- 3. Market Dynamics
- 3.1. Market Drivers
- 3.2. Market Restrains
- 3.3. Market Trends
- 3.4. Market Opportunities
- 4. Market Factor Analysis
- 4.1. Porters Five Forces
- 4.1.1. Bargaining Power of Suppliers
- 4.1.2. Bargaining Power of Buyers
- 4.1.3. Threat of New Entrants
- 4.1.4. Threat of Substitutes
- 4.1.5. Competitive Rivalry
- 4.2. PESTEL analysis
- 4.3. BCG Analysis
- 4.3.1. Stars (High Growth, High Market Share)
- 4.3.2. Cash Cows (Low Growth, High Market Share)
- 4.3.3. Question Mark (High Growth, Low Market Share)
- 4.3.4. Dogs (Low Growth, Low Market Share)
- 4.4. Ansoff Matrix Analysis
- 4.5. Supply Chain Analysis
- 4.6. Regulatory Landscape
- 4.7. Current Market Potential and Opportunity Assessment (TAM–SAM–SOM Framework)
- 4.8. VDR Analyst Note
- 4.1. Porters Five Forces
- 5. Market Analysis, Insights and Forecast 2021-2033
- 5.1. Market Analysis, Insights and Forecast - by Type
- 5.1.1. Vitamins
- 5.1.2. Minerals
- 5.1.3. Probiotics
- 5.1.4. Omega-3 & 6 Fatty Acids
- 5.1.5. Carotenoids
- 5.1.6. Proteins & Amino Acids
- 5.1.7. Other Types
- 5.2. Market Analysis, Insights and Forecast - by Application
- 5.2.1. Bakery & Cereals
- 5.2.2. Dairy & Dairy Alternative Products
- 5.2.3. Meat & Seafood
- 5.2.4. Confectionery
- 5.2.5. Beverages
- 5.2.6. Other Applications
- 5.3. Market Analysis, Insights and Forecast - by Region
- 5.3.1. North America
- 5.3.2. Europe
- 5.3.3. Asia Pacific
- 5.3.4. South America
- 5.3.5. Middle East and Africa
- 5.1. Market Analysis, Insights and Forecast - by Type
- 6. Global Natural Functional Food Industry Analysis, Insights and Forecast, 2021-2033
- 6.1. Market Analysis, Insights and Forecast - by Type
- 6.1.1. Vitamins
- 6.1.2. Minerals
- 6.1.3. Probiotics
- 6.1.4. Omega-3 & 6 Fatty Acids
- 6.1.5. Carotenoids
- 6.1.6. Proteins & Amino Acids
- 6.1.7. Other Types
- 6.2. Market Analysis, Insights and Forecast - by Application
- 6.2.1. Bakery & Cereals
- 6.2.2. Dairy & Dairy Alternative Products
- 6.2.3. Meat & Seafood
- 6.2.4. Confectionery
- 6.2.5. Beverages
- 6.2.6. Other Applications
- 6.1. Market Analysis, Insights and Forecast - by Type
- 7. North America Natural Functional Food Industry Analysis, Insights and Forecast, 2021-2033
- 7.1. Market Analysis, Insights and Forecast - by Type
- 7.1.1. Vitamins
- 7.1.2. Minerals
- 7.1.3. Probiotics
- 7.1.4. Omega-3 & 6 Fatty Acids
- 7.1.5. Carotenoids
- 7.1.6. Proteins & Amino Acids
- 7.1.7. Other Types
- 7.2. Market Analysis, Insights and Forecast - by Application
- 7.2.1. Bakery & Cereals
- 7.2.2. Dairy & Dairy Alternative Products
- 7.2.3. Meat & Seafood
- 7.2.4. Confectionery
- 7.2.5. Beverages
- 7.2.6. Other Applications
- 7.1. Market Analysis, Insights and Forecast - by Type
- 8. Europe Natural Functional Food Industry Analysis, Insights and Forecast, 2021-2033
- 8.1. Market Analysis, Insights and Forecast - by Type
- 8.1.1. Vitamins
- 8.1.2. Minerals
- 8.1.3. Probiotics
- 8.1.4. Omega-3 & 6 Fatty Acids
- 8.1.5. Carotenoids
- 8.1.6. Proteins & Amino Acids
- 8.1.7. Other Types
- 8.2. Market Analysis, Insights and Forecast - by Application
- 8.2.1. Bakery & Cereals
- 8.2.2. Dairy & Dairy Alternative Products
- 8.2.3. Meat & Seafood
- 8.2.4. Confectionery
- 8.2.5. Beverages
- 8.2.6. Other Applications
- 8.1. Market Analysis, Insights and Forecast - by Type
- 9. Asia Pacific Natural Functional Food Industry Analysis, Insights and Forecast, 2021-2033
- 9.1. Market Analysis, Insights and Forecast - by Type
- 9.1.1. Vitamins
- 9.1.2. Minerals
- 9.1.3. Probiotics
- 9.1.4. Omega-3 & 6 Fatty Acids
- 9.1.5. Carotenoids
- 9.1.6. Proteins & Amino Acids
- 9.1.7. Other Types
- 9.2. Market Analysis, Insights and Forecast - by Application
- 9.2.1. Bakery & Cereals
- 9.2.2. Dairy & Dairy Alternative Products
- 9.2.3. Meat & Seafood
- 9.2.4. Confectionery
- 9.2.5. Beverages
- 9.2.6. Other Applications
- 9.1. Market Analysis, Insights and Forecast - by Type
- 10. South America Natural Functional Food Industry Analysis, Insights and Forecast, 2021-2033
- 10.1. Market Analysis, Insights and Forecast - by Type
- 10.1.1. Vitamins
- 10.1.2. Minerals
- 10.1.3. Probiotics
- 10.1.4. Omega-3 & 6 Fatty Acids
- 10.1.5. Carotenoids
- 10.1.6. Proteins & Amino Acids
- 10.1.7. Other Types
- 10.2. Market Analysis, Insights and Forecast - by Application
- 10.2.1. Bakery & Cereals
- 10.2.2. Dairy & Dairy Alternative Products
- 10.2.3. Meat & Seafood
- 10.2.4. Confectionery
- 10.2.5. Beverages
- 10.2.6. Other Applications
- 10.1. Market Analysis, Insights and Forecast - by Type
- 11. Middle East and Africa Natural Functional Food Industry Analysis, Insights and Forecast, 2021-2033
- 11.1. Market Analysis, Insights and Forecast - by Type
- 11.1.1. Vitamins
- 11.1.2. Minerals
- 11.1.3. Probiotics
- 11.1.4. Omega-3 & 6 Fatty Acids
- 11.1.5. Carotenoids
- 11.1.6. Proteins & Amino Acids
- 11.1.7. Other Types
- 11.2. Market Analysis, Insights and Forecast - by Application
- 11.2.1. Bakery & Cereals
- 11.2.2. Dairy & Dairy Alternative Products
- 11.2.3. Meat & Seafood
- 11.2.4. Confectionery
- 11.2.5. Beverages
- 11.2.6. Other Applications
- 11.1. Market Analysis, Insights and Forecast - by Type
- 12. Competitive Analysis
- 12.1. Company Profiles
- 12.1.1 Cargill Incorporated
- 12.1.1.1. Company Overview
- 12.1.1.2. Products
- 12.1.1.3. Company Financials
- 12.1.1.4. SWOT Analysis
- 12.1.2 Arla Foods amba
- 12.1.2.1. Company Overview
- 12.1.2.2. Products
- 12.1.2.3. Company Financials
- 12.1.2.4. SWOT Analysis
- 12.1.3 DuPont de Nemours Inc
- 12.1.3.1. Company Overview
- 12.1.3.2. Products
- 12.1.3.3. Company Financials
- 12.1.3.4. SWOT Analysis
- 12.1.4 Archer Daniels Midland Company
- 12.1.4.1. Company Overview
- 12.1.4.2. Products
- 12.1.4.3. Company Financials
- 12.1.4.4. SWOT Analysis
- 12.1.5 Tate & Lyle PLC
- 12.1.5.1. Company Overview
- 12.1.5.2. Products
- 12.1.5.3. Company Financials
- 12.1.5.4. SWOT Analysis
- 12.1.6 BASF SE
- 12.1.6.1. Company Overview
- 12.1.6.2. Products
- 12.1.6.3. Company Financials
- 12.1.6.4. SWOT Analysis
- 12.1.7 Foodchem International Corporation*List Not Exhaustive
- 12.1.7.1. Company Overview
- 12.1.7.2. Products
- 12.1.7.3. Company Financials
- 12.1.7.4. SWOT Analysis
- 12.1.8 Kerry Group
- 12.1.8.1. Company Overview
- 12.1.8.2. Products
- 12.1.8.3. Company Financials
- 12.1.8.4. SWOT Analysis
- 12.1.9 Koninklijke DSM NV
- 12.1.9.1. Company Overview
- 12.1.9.2. Products
- 12.1.9.3. Company Financials
- 12.1.9.4. SWOT Analysis
- 12.1.10 Ingredion Incorporated
- 12.1.10.1. Company Overview
- 12.1.10.2. Products
- 12.1.10.3. Company Financials
- 12.1.10.4. SWOT Analysis
- 12.1.1 Cargill Incorporated
- 12.2. Market Entropy
- 12.2.1 Company's Key Areas Served
- 12.2.2 Recent Developments
- 12.3. Company Market Share Analysis 2025
- 12.3.1 Top 5 Companies Market Share Analysis
- 12.3.2 Top 3 Companies Market Share Analysis
- 12.4. List of Potential Customers
- 13. Research Methodology
List of Figures
- Figure 1: Global Natural Functional Food Industry Revenue Breakdown (billion, %) by Region 2025 & 2033
- Figure 2: North America Natural Functional Food Industry Revenue (billion), by Type 2025 & 2033
- Figure 3: North America Natural Functional Food Industry Revenue Share (%), by Type 2025 & 2033
- Figure 4: North America Natural Functional Food Industry Revenue (billion), by Application 2025 & 2033
- Figure 5: North America Natural Functional Food Industry Revenue Share (%), by Application 2025 & 2033
- Figure 6: North America Natural Functional Food Industry Revenue (billion), by Country 2025 & 2033
- Figure 7: North America Natural Functional Food Industry Revenue Share (%), by Country 2025 & 2033
- Figure 8: Europe Natural Functional Food Industry Revenue (billion), by Type 2025 & 2033
- Figure 9: Europe Natural Functional Food Industry Revenue Share (%), by Type 2025 & 2033
- Figure 10: Europe Natural Functional Food Industry Revenue (billion), by Application 2025 & 2033
- Figure 11: Europe Natural Functional Food Industry Revenue Share (%), by Application 2025 & 2033
- Figure 12: Europe Natural Functional Food Industry Revenue (billion), by Country 2025 & 2033
- Figure 13: Europe Natural Functional Food Industry Revenue Share (%), by Country 2025 & 2033
- Figure 14: Asia Pacific Natural Functional Food Industry Revenue (billion), by Type 2025 & 2033
- Figure 15: Asia Pacific Natural Functional Food Industry Revenue Share (%), by Type 2025 & 2033
- Figure 16: Asia Pacific Natural Functional Food Industry Revenue (billion), by Application 2025 & 2033
- Figure 17: Asia Pacific Natural Functional Food Industry Revenue Share (%), by Application 2025 & 2033
- Figure 18: Asia Pacific Natural Functional Food Industry Revenue (billion), by Country 2025 & 2033
- Figure 19: Asia Pacific Natural Functional Food Industry Revenue Share (%), by Country 2025 & 2033
- Figure 20: South America Natural Functional Food Industry Revenue (billion), by Type 2025 & 2033
- Figure 21: South America Natural Functional Food Industry Revenue Share (%), by Type 2025 & 2033
- Figure 22: South America Natural Functional Food Industry Revenue (billion), by Application 2025 & 2033
- Figure 23: South America Natural Functional Food Industry Revenue Share (%), by Application 2025 & 2033
- Figure 24: South America Natural Functional Food Industry Revenue (billion), by Country 2025 & 2033
- Figure 25: South America Natural Functional Food Industry Revenue Share (%), by Country 2025 & 2033
- Figure 26: Middle East and Africa Natural Functional Food Industry Revenue (billion), by Type 2025 & 2033
- Figure 27: Middle East and Africa Natural Functional Food Industry Revenue Share (%), by Type 2025 & 2033
- Figure 28: Middle East and Africa Natural Functional Food Industry Revenue (billion), by Application 2025 & 2033
- Figure 29: Middle East and Africa Natural Functional Food Industry Revenue Share (%), by Application 2025 & 2033
- Figure 30: Middle East and Africa Natural Functional Food Industry Revenue (billion), by Country 2025 & 2033
- Figure 31: Middle East and Africa Natural Functional Food Industry Revenue Share (%), by Country 2025 & 2033
List of Tables
- Table 1: Global Natural Functional Food Industry Revenue billion Forecast, by Type 2020 & 2033
- Table 2: Global Natural Functional Food Industry Revenue billion Forecast, by Application 2020 & 2033
- Table 3: Global Natural Functional Food Industry Revenue billion Forecast, by Region 2020 & 2033
- Table 4: Global Natural Functional Food Industry Revenue billion Forecast, by Type 2020 & 2033
- Table 5: Global Natural Functional Food Industry Revenue billion Forecast, by Application 2020 & 2033
- Table 6: Global Natural Functional Food Industry Revenue billion Forecast, by Country 2020 & 2033
- Table 7: United States Natural Functional Food Industry Revenue (billion) Forecast, by Application 2020 & 2033
- Table 8: Canada Natural Functional Food Industry Revenue (billion) Forecast, by Application 2020 & 2033
- Table 9: Mexico Natural Functional Food Industry Revenue (billion) Forecast, by Application 2020 & 2033
- Table 10: Rest of North America Natural Functional Food Industry Revenue (billion) Forecast, by Application 2020 & 2033
- Table 11: Global Natural Functional Food Industry Revenue billion Forecast, by Type 2020 & 2033
- Table 12: Global Natural Functional Food Industry Revenue billion Forecast, by Application 2020 & 2033
- Table 13: Global Natural Functional Food Industry Revenue billion Forecast, by Country 2020 & 2033
- Table 14: Germany Natural Functional Food Industry Revenue (billion) Forecast, by Application 2020 & 2033
- Table 15: United Kingdom Natural Functional Food Industry Revenue (billion) Forecast, by Application 2020 & 2033
- Table 16: France Natural Functional Food Industry Revenue (billion) Forecast, by Application 2020 & 2033
- Table 17: Russia Natural Functional Food Industry Revenue (billion) Forecast, by Application 2020 & 2033
- Table 18: Italy Natural Functional Food Industry Revenue (billion) Forecast, by Application 2020 & 2033
- Table 19: Spain Natural Functional Food Industry Revenue (billion) Forecast, by Application 2020 & 2033
- Table 20: Rest of Europe Natural Functional Food Industry Revenue (billion) Forecast, by Application 2020 & 2033
- Table 21: Global Natural Functional Food Industry Revenue billion Forecast, by Type 2020 & 2033
- Table 22: Global Natural Functional Food Industry Revenue billion Forecast, by Application 2020 & 2033
- Table 23: Global Natural Functional Food Industry Revenue billion Forecast, by Country 2020 & 2033
- Table 24: China Natural Functional Food Industry Revenue (billion) Forecast, by Application 2020 & 2033
- Table 25: India Natural Functional Food Industry Revenue (billion) Forecast, by Application 2020 & 2033
- Table 26: Japan Natural Functional Food Industry Revenue (billion) Forecast, by Application 2020 & 2033
- Table 27: Australia Natural Functional Food Industry Revenue (billion) Forecast, by Application 2020 & 2033
- Table 28: Rest of Asia Pacific Natural Functional Food Industry Revenue (billion) Forecast, by Application 2020 & 2033
- Table 29: Global Natural Functional Food Industry Revenue billion Forecast, by Type 2020 & 2033
- Table 30: Global Natural Functional Food Industry Revenue billion Forecast, by Application 2020 & 2033
- Table 31: Global Natural Functional Food Industry Revenue billion Forecast, by Country 2020 & 2033
- Table 32: Brazil Natural Functional Food Industry Revenue (billion) Forecast, by Application 2020 & 2033
- Table 33: Argentina Natural Functional Food Industry Revenue (billion) Forecast, by Application 2020 & 2033
- Table 34: Rest of South America Natural Functional Food Industry Revenue (billion) Forecast, by Application 2020 & 2033
- Table 35: Global Natural Functional Food Industry Revenue billion Forecast, by Type 2020 & 2033
- Table 36: Global Natural Functional Food Industry Revenue billion Forecast, by Application 2020 & 2033
- Table 37: Global Natural Functional Food Industry Revenue billion Forecast, by Country 2020 & 2033
- Table 38: United Arab Emirates Natural Functional Food Industry Revenue (billion) Forecast, by Application 2020 & 2033
- Table 39: South Africa Natural Functional Food Industry Revenue (billion) Forecast, by Application 2020 & 2033
- Table 40: Rest of Middle East and Africa Natural Functional Food Industry Revenue (billion) Forecast, by Application 2020 & 2033
Frequently Asked Questions
1. What is the projected Compound Annual Growth Rate (CAGR) of the Natural Functional Food Industry?
The projected CAGR is approximately 3.4%.
2. Which companies are prominent players in the Natural Functional Food Industry?
Key companies in the market include Cargill Incorporated, Arla Foods amba, DuPont de Nemours Inc, Archer Daniels Midland Company, Tate & Lyle PLC, BASF SE, Foodchem International Corporation*List Not Exhaustive, Kerry Group, Koninklijke DSM NV, Ingredion Incorporated.
3. What are the main segments of the Natural Functional Food Industry?
The market segments include Type, Application.
4. Can you provide details about the market size?
The market size is estimated to be USD 172.6 billion as of 2022.
5. What are some drivers contributing to market growth?
Increasing Demand for Low-Fat and Low-Calorie Food; Increasing Product Innovation.
6. What are the notable trends driving market growth?
Escalating Demand for Functional and Fortified Food.
7. Are there any restraints impacting market growth?
; Threat of New Entrants; Bargaining Power of Buyers/Consumers; Bargaining Power of Suppliers; Threat of Substitute Products; Degree Of Competition.
8. Can you provide examples of recent developments in the market?
October 2022: Teijin Limited launched the Teijin Meguro Institute Co., Ltd. to strengthen the company's development and manufacturing of probiotics for use in functional foods. It will provide functional food ingredients for probiotics products.
9. What pricing options are available for accessing the report?
Pricing options include single-user, multi-user, and enterprise licenses priced at USD 4750, USD 5250, and USD 8750 respectively.
10. Is the market size provided in terms of value or volume?
The market size is provided in terms of value, measured in billion.
11. Are there any specific market keywords associated with the report?
Yes, the market keyword associated with the report is "Natural Functional Food Industry," which aids in identifying and referencing the specific market segment covered.
12. How do I determine which pricing option suits my needs best?
The pricing options vary based on user requirements and access needs. Individual users may opt for single-user licenses, while businesses requiring broader access may choose multi-user or enterprise licenses for cost-effective access to the report.
13. Are there any additional resources or data provided in the Natural Functional Food Industry report?
While the report offers comprehensive insights, it's advisable to review the specific contents or supplementary materials provided to ascertain if additional resources or data are available.
14. How can I stay updated on further developments or reports in the Natural Functional Food Industry?
To stay informed about further developments, trends, and reports in the Natural Functional Food Industry, consider subscribing to industry newsletters, following relevant companies and organizations, or regularly checking reputable industry news sources and publications.
Methodology
Step 1 - Identification of Relevant Samples Size from Population Database


Step 2 - Approaches for Defining Global Market Size (Value, Volume* & Price*)

Note*: In applicable scenarios
Step 3 - Data Sources
Primary Research
- Web Analytics
- Survey Reports
- Research Institute
- Latest Research Reports
- Opinion Leaders
Secondary Research
- Annual Reports
- White Paper
- Latest Press Release
- Industry Association
- Paid Database
- Investor Presentations

Step 4 - Data Triangulation
Involves using different sources of information in order to increase the validity of a study
These sources are likely to be stakeholders in a program - participants, other researchers, program staff, other community members, and so on.
Then we put all data in single framework & apply various statistical tools to find out the dynamic on the market.
During the analysis stage, feedback from the stakeholder groups would be compared to determine areas of agreement as well as areas of divergence