

Key Insights
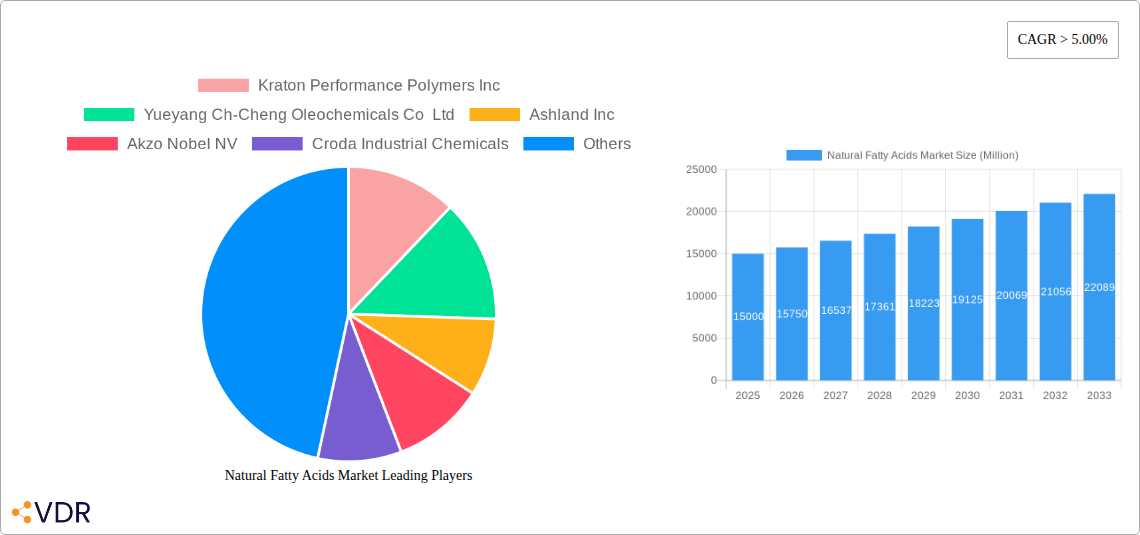
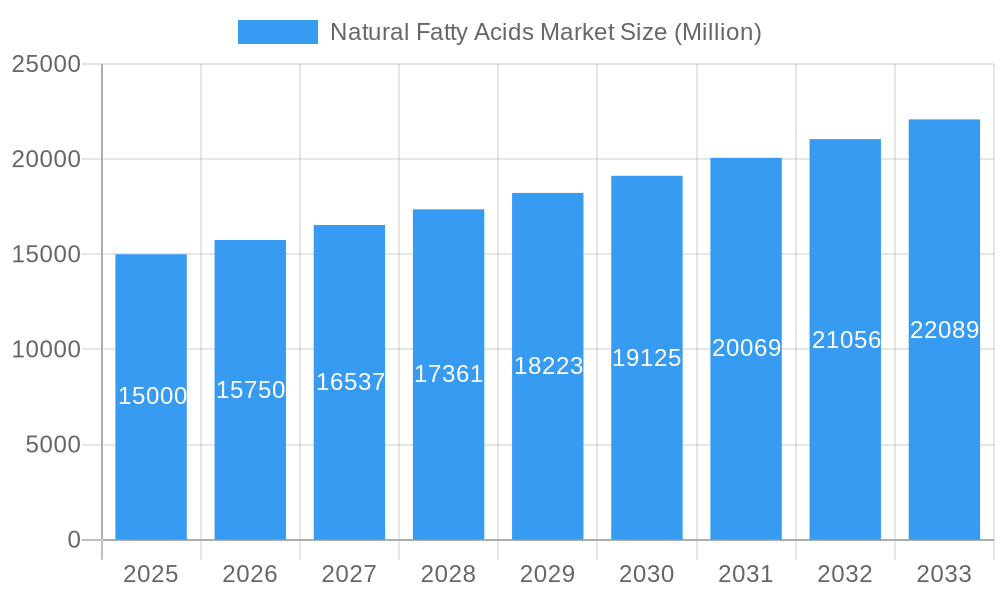
The global natural fatty acids market is experiencing robust growth, projected to maintain a CAGR exceeding 5% from 2025 to 2033. This expansion is fueled by several key drivers. The increasing demand for natural and sustainable ingredients across diverse sectors, including cosmetics, personal care, and food, is a significant factor. Consumers are increasingly conscious of the environmental impact of their choices, leading to a preference for bio-based alternatives to synthetic chemicals. Furthermore, the growing application of natural fatty acids in the production of biofuels and biodegradable plastics contributes to the market's upward trajectory. The diverse applications of these acids, ranging from soaps and detergents to lubricants and rubber processing, ensure a broad market base. While the market faces some restraints, such as price volatility related to raw material sourcing and potential supply chain disruptions, the overall positive trends suggest continued growth. Regional variations exist, with the Asia-Pacific region, particularly China and India, expected to be key contributors due to robust industrial growth and expanding consumer markets. North America and Europe also maintain significant market shares, driven by established industries and high consumer spending on natural products. The market is segmented by type (Stearic Acid, Distilled Fatty Acid, C8 Caprylic Fatty Acid, Tall Oil Fatty Acid, Oleic Acid) and application, reflecting the versatile nature of natural fatty acids and their widespread use.
Natural Fatty Acids Market Market Size (In Billion)
The competitive landscape is marked by both large multinational corporations and regional players. Established chemical companies like BASF SE, Akzo Nobel NV, and Eastman Chemical Company are major players, leveraging their extensive distribution networks and technological expertise. However, smaller, specialized companies are also gaining traction, focusing on niche applications and sustainable sourcing practices. This competitive dynamic fosters innovation and drives the development of new products and applications for natural fatty acids, reinforcing the market's positive outlook. The forecast period of 2025-2033 promises continued growth, driven by ongoing trends toward sustainability and the expanding demand for natural ingredients across various industries. Successful companies will need to strategically navigate supply chain challenges and adapt to evolving consumer preferences while capitalizing on the growing awareness of the environmental benefits of natural fatty acids.
Natural Fatty Acids Market Company Market Share
Natural Fatty Acids Market: A Comprehensive Market Report (2019-2033)
This comprehensive report provides a detailed analysis of the global Natural Fatty Acids market, encompassing historical data (2019-2024), current estimations (2025), and future projections (2025-2033). It delves into market dynamics, growth trends, regional dominance, product landscapes, key challenges, emerging opportunities, and the key players shaping this dynamic industry. The report is meticulously crafted for industry professionals, investors, and strategic decision-makers seeking actionable insights into the Natural Fatty Acids market, encompassing both the parent market (Specialty Chemicals) and its child market segments (Cosmetics, Personal Care, Industrial Applications etc.). The market size is presented in Million USD throughout the report.
Natural Fatty Acids Market Dynamics & Structure
The Natural Fatty Acids market is characterized by moderate concentration, with several major players holding significant market share. Technological innovations, particularly in bio-based fatty acid production, are key drivers, while stringent regulatory frameworks related to sustainability and environmental impact influence market trends. Competitive pressures from synthetic fatty acid substitutes are also notable. End-user demographics, particularly within the booming cosmetics and personal care industries, significantly shape market demand. Mergers and acquisitions (M&A) activity reflects ongoing consolidation and expansion efforts within the sector. In the past five years, approximately xx M&A deals have been observed, with xx% of them being cross-border transactions.
- Market Concentration: Moderately concentrated, with the top 5 players holding approximately xx% of the market share in 2024.
- Technological Innovation: Focus on bio-based and sustainable production methods is driving innovation. However, high R&D costs and scaling challenges present barriers to entry for smaller players.
- Regulatory Landscape: Stringent environmental regulations are influencing production processes and driving the adoption of sustainable practices.
- Competitive Substitutes: Synthetic fatty acids present a significant competitive challenge due to their often lower cost.
- End-User Demographics: Growing consumer demand for natural and organic products fuels growth in the cosmetics and personal care sectors.
- M&A Trends: Consolidation is evident through strategic acquisitions focused on expanding product portfolios and geographic reach.
Natural Fatty Acids Market Growth Trends & Insights
The Natural Fatty Acids market exhibits a robust growth trajectory, driven by increasing demand across diverse end-use industries. Between 2019 and 2024, the market experienced a Compound Annual Growth Rate (CAGR) of xx%. This growth is projected to continue, with a forecast CAGR of xx% from 2025 to 2033, reaching a market size of xxx Million USD by 2033. The rising adoption of natural fatty acids in consumer goods, owing to increasing consumer awareness of health and sustainability, is a key factor. Technological advancements enabling efficient and cost-effective production further contribute to market expansion. Consumer preference for natural ingredients over synthetic alternatives, coupled with supportive government policies promoting sustainable practices, also influence market expansion significantly. Market penetration in developing economies is expected to contribute significantly to future growth.
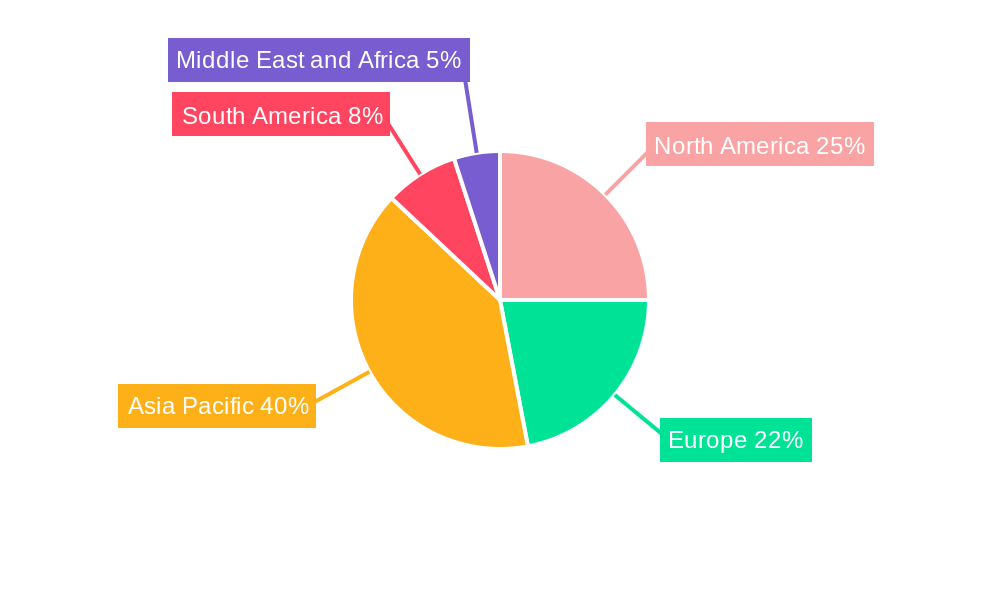
Dominant Regions, Countries, or Segments in Natural Fatty Acids Market
North America currently holds the largest market share in the Natural Fatty Acids market, followed by Europe and Asia Pacific. Within the application segments, the Household, Cosmetics, and Personal Care sector shows the highest growth potential, driven by increasing demand for natural and organic products. The Soap and Detergent segment is also witnessing significant growth. Within the type segment, Stearic acid and Oleic acid are currently dominating due to their widespread usage across multiple applications.
- Key Drivers in North America: Strong regulatory support for sustainable products, high consumer disposable income, and a well-established chemical industry.
- Key Drivers in Europe: Stringent environmental regulations, a strong focus on sustainability, and the availability of advanced technology.
- Key Drivers in Asia Pacific: Rapid economic growth, increasing consumer spending, and expanding end-use industries.
- Application Segment Dominance: Household, Cosmetics, and Personal Care (xx% market share in 2024), followed by Soap and Detergent (xx% market share in 2024).
- Type Segment Dominance: Stearic Acid (xx% market share in 2024) and Oleic Acid (xx% market share in 2024).
Natural Fatty Acids Market Product Landscape
The Natural Fatty Acids market showcases a diverse range of products, including Stearic Acid, Distilled Fatty Acid, C8 Caprylic Fatty Acid, Tall Oil Fatty Acid, and Oleic Acid, each catering to specific application needs. Recent innovations focus on enhancing product purity, improving functionality, and developing sustainable production methods. Unique selling propositions emphasize biodegradability, renewability, and superior performance characteristics compared to synthetic alternatives. Technological advancements involve optimizing extraction processes and developing innovative downstream applications.
Key Drivers, Barriers & Challenges in Natural Fatty Acids Market
Key Drivers:
- Surging Consumer Demand for Natural and Sustainable Products: A significant driver is the escalating preference for naturally derived ingredients across diverse end-use industries, including food & beverage, cosmetics, pharmaceuticals, and industrial applications. Consumers are increasingly seeking products free from synthetic additives and with a reduced environmental footprint.
- Technological Advancements in Production: Innovations in extraction, purification, and processing technologies are enhancing the efficiency and cost-effectiveness of natural fatty acid production. This includes advancements in enzymatic processes, green chemistry techniques, and the development of specialized catalysts, leading to higher yields and purer products.
- Supportive Government Policies and Regulations: Favorable government initiatives, incentives, and regulations promoting the use of bio-based materials and renewable resources are a substantial growth catalyst. These policies often aim to reduce reliance on petrochemicals and support a circular economy.
- Growing Awareness of Health Benefits: Increased consumer and industry awareness regarding the health benefits associated with specific natural fatty acids, such as omega-3 and omega-6, is fueling demand in the nutraceutical and pharmaceutical sectors.
- Expansion into New Application Areas: The continuous discovery and development of novel applications for natural fatty acids in emerging sectors like bioplastics, biofuels, and specialized industrial lubricants are creating new avenues for market expansion.
Key Challenges and Restraints:
- Price Volatility of Raw Materials: The agricultural origin of natural fatty acids makes them susceptible to fluctuations in the prices of raw materials like vegetable oils and animal fats. This volatility can impact production costs, profit margins, and pricing strategies for manufacturers.
- Intense Competition from Synthetic Alternatives: Despite the growing preference for natural products, synthetic fatty acids and their derivatives continue to offer competitive pricing and consistent availability, posing a significant challenge to market penetration and growth for natural alternatives.
- Supply Chain Disruptions and Logistical Complexities: Factors such as adverse weather conditions, geopolitical instability, and global trade dynamics can lead to supply chain disruptions, impacting the availability and cost of both raw materials and finished products. The global nature of sourcing and distribution adds to these logistical challenges.
- Regulatory Hurdles and Standardization: Navigating diverse regulatory landscapes across different regions and ensuring product standardization for various applications can be complex and time-consuming, potentially slowing down market entry and product adoption.
- Perception and Performance Gaps: In certain niche applications, there might be a perception gap regarding the performance or functional equivalence of natural fatty acids compared to their synthetic counterparts, requiring further research and market education.
Emerging Opportunities in Natural Fatty Acids Market
- Expanding Applications in the Food & Beverage Industry: Beyond their traditional uses, there's a growing opportunity to leverage natural fatty acids as functional ingredients, emulsifiers, and flavor enhancers in a wider range of food products, including plant-based alternatives, healthy snacks, and specialized dietary supplements.
- Growing Interest in Pharmaceutical and Nutraceutical Applications: The inherent health benefits of specific natural fatty acids, such as their role in cardiovascular health, cognitive function, and anti-inflammatory properties, are driving increased research and development in pharmaceutical and nutraceutical formulations. This includes opportunities in personalized nutrition and disease management.
- Development of Novel Formulations for Specialized Applications: The cosmetics and personal care industry presents a significant opportunity for innovative formulations utilizing natural fatty acids for their emollient, moisturizing, and skin-conditioning properties. This includes the development of high-performance, eco-friendly skincare, haircare, and makeup products.
- Bioplastics and Biodegradable Materials: Natural fatty acids are increasingly being explored as building blocks for the production of biodegradable polymers and bioplastics, offering a sustainable alternative to traditional petroleum-based plastics and addressing environmental concerns.
- Biofuels and Lubricants: The potential to utilize natural fatty acids in the production of biofuels and high-performance biodegradable lubricants is a burgeoning area, contributing to the shift towards renewable energy sources and environmentally responsible industrial practices.
- Sustainable Sourcing and Traceability: As consumer awareness of ethical sourcing and sustainability grows, there is an opportunity for companies to differentiate themselves by offering traceable and sustainably sourced natural fatty acids, building trust and brand loyalty.
Growth Accelerators in the Natural Fatty Acids Market Industry
Strategic partnerships between producers and end-users are facilitating market expansion. Investments in research and development are driving the innovation of sustainable production technologies. Expansion into untapped markets in developing countries presents significant growth opportunities.
Key Players Shaping the Natural Fatty Acids Market Market
- Kraton Performance Polymers Inc
- Yueyang Ch-Cheng Oleochemicals Co Ltd
- Ashland Inc
- Akzo Nobel NV
- Croda Industrial Chemicals
- BASF SE
- SABIC
- Eastman Chemical Company
- Chemithon Corporation
- Chemol Company Inc
- LG Chemicals
- Faci SpA
- Baerlocher GmbH
- Behn-Meyer Holding AG
- Zibo Fenbao Chemical Co Ltd
- Pacific Oleochemicals Sdn Bhd
Notable Milestones in Natural Fatty Acids Market Sector
- November 2022: Sinarmas Cepsa Pte Ltd (SCPL) and its parent companies signed a Memorandum of Understanding to significantly expand bio-based chemical production in Indonesia. This strategic move represents a substantial investment and commitment to scaling up sustainable fatty acid production, aligning with global sustainability trends and increasing demand for bio-based alternatives.
- August 2022: Kraton Chemical LLC fortified its market presence in the Oceania region by appointing Redox Limited as its exclusive channel partner for Australia and New Zealand. This partnership aimed to enhance the distribution network and broaden market reach for Kraton's Tall Oil Fatty Acid (TOFA) and Ink Polyamides, ensuring greater accessibility and support for customers in these key markets.
- Recent Developments in R&D: Ongoing research and development efforts by various market players are focused on extracting novel fatty acid profiles from underutilized biomass sources and developing innovative applications in areas such as advanced bio-lubricants and functional food ingredients, showcasing the dynamic nature of innovation in the sector.
- Strategic Acquisitions and Collaborations: Several companies have engaged in strategic acquisitions and collaborative ventures to expand their product portfolios, gain access to new technologies, and strengthen their market position. These initiatives underscore the competitive landscape and the drive for growth and consolidation within the natural fatty acids market.
- Launch of New Product Lines: Manufacturers are actively introducing new product lines specifically tailored for the burgeoning cosmetic and pharmaceutical sectors, emphasizing high purity, specific fatty acid compositions, and sustainable sourcing to meet the stringent requirements of these sensitive applications.
In-Depth Natural Fatty Acids Market Market Outlook
The Natural Fatty Acids market is poised for sustained growth, driven by increasing consumer demand for natural products and ongoing technological advancements. Strategic collaborations, expansion into new markets, and focus on sustainable production methods will shape the future of this dynamic industry. The market offers significant opportunities for companies focusing on innovation and sustainability.
Natural Fatty Acids Market Segmentation
-
1. Type
- 1.1. Stearic Acid
- 1.2. Distilled Fatty Acid
- 1.3. C8 Caprylic Fatty Acid
- 1.4. Tall Oil Fatty Acid
- 1.5. Oleic Acid
-
2. Application
- 2.1. Household, Cosmetics, and Personal Care
- 2.2. Soap and Detergent
- 2.3. Oilfield
- 2.4. Rubber and Plastic
- 2.5. Lubricants
- 2.6. Other End-user Industries
Natural Fatty Acids Market Segmentation By Geography
-
1. Asia Pacific
- 1.1. China
- 1.2. India
- 1.3. Japan
- 1.4. South Korea
- 1.5. Rest of Asia Pacific
-
2. North America
- 2.1. United States
- 2.2. Canada
- 2.3. Mexico
-
3. Europe
- 3.1. Germany
- 3.2. United Kingdom
- 3.3. France
- 3.4. Italy
- 3.5. Rest of Europe
-
4. South America
- 4.1. Brazil
- 4.2. Argentina
- 4.3. Rest of South America
-
5. Middle East and Africa
- 5.1. Saudi Arabia
- 5.2. South Africa
- 5.3. Rest of Middle East and Africa
Natural Fatty Acids Market Regional Market Share
Geographic Coverage of Natural Fatty Acids Market
Natural Fatty Acids Market REPORT HIGHLIGHTS
| Aspects | Details |
|---|---|
| Study Period | 2020-2034 |
| Base Year | 2025 |
| Estimated Year | 2026 |
| Forecast Period | 2026-2034 |
| Historical Period | 2020-2025 |
| Growth Rate | CAGR of > 5.00% from 2020-2034 |
| Segmentation |
|
Table of Contents
- 1. Introduction
- 1.1. Research Scope
- 1.2. Market Segmentation
- 1.3. Research Objective
- 1.4. Definitions and Assumptions
- 2. Executive Summary
- 2.1. Market Snapshot
- 3. Market Dynamics
- 3.1. Market Drivers
- 3.2. Market Restrains
- 3.3. Market Trends
- 3.4. Market Opportunities
- 4. Market Factor Analysis
- 4.1. Porters Five Forces
- 4.1.1. Bargaining Power of Suppliers
- 4.1.2. Bargaining Power of Buyers
- 4.1.3. Threat of New Entrants
- 4.1.4. Threat of Substitutes
- 4.1.5. Competitive Rivalry
- 4.2. PESTEL analysis
- 4.3. BCG Analysis
- 4.3.1. Stars (High Growth, High Market Share)
- 4.3.2. Cash Cows (Low Growth, High Market Share)
- 4.3.3. Question Mark (High Growth, Low Market Share)
- 4.3.4. Dogs (Low Growth, Low Market Share)
- 4.4. Ansoff Matrix Analysis
- 4.5. Supply Chain Analysis
- 4.6. Regulatory Landscape
- 4.7. Current Market Potential and Opportunity Assessment (TAM–SAM–SOM Framework)
- 4.8. VDR Analyst Note
- 4.1. Porters Five Forces
- 5. Market Analysis, Insights and Forecast 2021-2033
- 5.1. Market Analysis, Insights and Forecast - by Type
- 5.1.1. Stearic Acid
- 5.1.2. Distilled Fatty Acid
- 5.1.3. C8 Caprylic Fatty Acid
- 5.1.4. Tall Oil Fatty Acid
- 5.1.5. Oleic Acid
- 5.2. Market Analysis, Insights and Forecast - by Application
- 5.2.1. Household, Cosmetics, and Personal Care
- 5.2.2. Soap and Detergent
- 5.2.3. Oilfield
- 5.2.4. Rubber and Plastic
- 5.2.5. Lubricants
- 5.2.6. Other End-user Industries
- 5.3. Market Analysis, Insights and Forecast - by Region
- 5.3.1. Asia Pacific
- 5.3.2. North America
- 5.3.3. Europe
- 5.3.4. South America
- 5.3.5. Middle East and Africa
- 5.1. Market Analysis, Insights and Forecast - by Type
- 6. Global Natural Fatty Acids Market Analysis, Insights and Forecast, 2021-2033
- 6.1. Market Analysis, Insights and Forecast - by Type
- 6.1.1. Stearic Acid
- 6.1.2. Distilled Fatty Acid
- 6.1.3. C8 Caprylic Fatty Acid
- 6.1.4. Tall Oil Fatty Acid
- 6.1.5. Oleic Acid
- 6.2. Market Analysis, Insights and Forecast - by Application
- 6.2.1. Household, Cosmetics, and Personal Care
- 6.2.2. Soap and Detergent
- 6.2.3. Oilfield
- 6.2.4. Rubber and Plastic
- 6.2.5. Lubricants
- 6.2.6. Other End-user Industries
- 6.1. Market Analysis, Insights and Forecast - by Type
- 7. Asia Pacific Natural Fatty Acids Market Analysis, Insights and Forecast, 2021-2033
- 7.1. Market Analysis, Insights and Forecast - by Type
- 7.1.1. Stearic Acid
- 7.1.2. Distilled Fatty Acid
- 7.1.3. C8 Caprylic Fatty Acid
- 7.1.4. Tall Oil Fatty Acid
- 7.1.5. Oleic Acid
- 7.2. Market Analysis, Insights and Forecast - by Application
- 7.2.1. Household, Cosmetics, and Personal Care
- 7.2.2. Soap and Detergent
- 7.2.3. Oilfield
- 7.2.4. Rubber and Plastic
- 7.2.5. Lubricants
- 7.2.6. Other End-user Industries
- 7.1. Market Analysis, Insights and Forecast - by Type
- 8. North America Natural Fatty Acids Market Analysis, Insights and Forecast, 2021-2033
- 8.1. Market Analysis, Insights and Forecast - by Type
- 8.1.1. Stearic Acid
- 8.1.2. Distilled Fatty Acid
- 8.1.3. C8 Caprylic Fatty Acid
- 8.1.4. Tall Oil Fatty Acid
- 8.1.5. Oleic Acid
- 8.2. Market Analysis, Insights and Forecast - by Application
- 8.2.1. Household, Cosmetics, and Personal Care
- 8.2.2. Soap and Detergent
- 8.2.3. Oilfield
- 8.2.4. Rubber and Plastic
- 8.2.5. Lubricants
- 8.2.6. Other End-user Industries
- 8.1. Market Analysis, Insights and Forecast - by Type
- 9. Europe Natural Fatty Acids Market Analysis, Insights and Forecast, 2021-2033
- 9.1. Market Analysis, Insights and Forecast - by Type
- 9.1.1. Stearic Acid
- 9.1.2. Distilled Fatty Acid
- 9.1.3. C8 Caprylic Fatty Acid
- 9.1.4. Tall Oil Fatty Acid
- 9.1.5. Oleic Acid
- 9.2. Market Analysis, Insights and Forecast - by Application
- 9.2.1. Household, Cosmetics, and Personal Care
- 9.2.2. Soap and Detergent
- 9.2.3. Oilfield
- 9.2.4. Rubber and Plastic
- 9.2.5. Lubricants
- 9.2.6. Other End-user Industries
- 9.1. Market Analysis, Insights and Forecast - by Type
- 10. South America Natural Fatty Acids Market Analysis, Insights and Forecast, 2021-2033
- 10.1. Market Analysis, Insights and Forecast - by Type
- 10.1.1. Stearic Acid
- 10.1.2. Distilled Fatty Acid
- 10.1.3. C8 Caprylic Fatty Acid
- 10.1.4. Tall Oil Fatty Acid
- 10.1.5. Oleic Acid
- 10.2. Market Analysis, Insights and Forecast - by Application
- 10.2.1. Household, Cosmetics, and Personal Care
- 10.2.2. Soap and Detergent
- 10.2.3. Oilfield
- 10.2.4. Rubber and Plastic
- 10.2.5. Lubricants
- 10.2.6. Other End-user Industries
- 10.1. Market Analysis, Insights and Forecast - by Type
- 11. Middle East and Africa Natural Fatty Acids Market Analysis, Insights and Forecast, 2021-2033
- 11.1. Market Analysis, Insights and Forecast - by Type
- 11.1.1. Stearic Acid
- 11.1.2. Distilled Fatty Acid
- 11.1.3. C8 Caprylic Fatty Acid
- 11.1.4. Tall Oil Fatty Acid
- 11.1.5. Oleic Acid
- 11.2. Market Analysis, Insights and Forecast - by Application
- 11.2.1. Household, Cosmetics, and Personal Care
- 11.2.2. Soap and Detergent
- 11.2.3. Oilfield
- 11.2.4. Rubber and Plastic
- 11.2.5. Lubricants
- 11.2.6. Other End-user Industries
- 11.1. Market Analysis, Insights and Forecast - by Type
- 12. Competitive Analysis
- 12.1. Company Profiles
- 12.1.1 Kraton Performance Polymers Inc
- 12.1.1.1. Company Overview
- 12.1.1.2. Products
- 12.1.1.3. Company Financials
- 12.1.1.4. SWOT Analysis
- 12.1.2 Yueyang Ch-Cheng Oleochemicals Co Ltd
- 12.1.2.1. Company Overview
- 12.1.2.2. Products
- 12.1.2.3. Company Financials
- 12.1.2.4. SWOT Analysis
- 12.1.3 Ashland Inc
- 12.1.3.1. Company Overview
- 12.1.3.2. Products
- 12.1.3.3. Company Financials
- 12.1.3.4. SWOT Analysis
- 12.1.4 Akzo Nobel NV
- 12.1.4.1. Company Overview
- 12.1.4.2. Products
- 12.1.4.3. Company Financials
- 12.1.4.4. SWOT Analysis
- 12.1.5 Croda Industrial Chemicals
- 12.1.5.1. Company Overview
- 12.1.5.2. Products
- 12.1.5.3. Company Financials
- 12.1.5.4. SWOT Analysis
- 12.1.6 BASF SE
- 12.1.6.1. Company Overview
- 12.1.6.2. Products
- 12.1.6.3. Company Financials
- 12.1.6.4. SWOT Analysis
- 12.1.7 SABIC
- 12.1.7.1. Company Overview
- 12.1.7.2. Products
- 12.1.7.3. Company Financials
- 12.1.7.4. SWOT Analysis
- 12.1.8 Eastman Chemical Company
- 12.1.8.1. Company Overview
- 12.1.8.2. Products
- 12.1.8.3. Company Financials
- 12.1.8.4. SWOT Analysis
- 12.1.9 Chemithon Corporation
- 12.1.9.1. Company Overview
- 12.1.9.2. Products
- 12.1.9.3. Company Financials
- 12.1.9.4. SWOT Analysis
- 12.1.10 Chemol Company Inc
- 12.1.10.1. Company Overview
- 12.1.10.2. Products
- 12.1.10.3. Company Financials
- 12.1.10.4. SWOT Analysis
- 12.1.11 LG Chemicals
- 12.1.11.1. Company Overview
- 12.1.11.2. Products
- 12.1.11.3. Company Financials
- 12.1.11.4. SWOT Analysis
- 12.1.12 Faci SpA
- 12.1.12.1. Company Overview
- 12.1.12.2. Products
- 12.1.12.3. Company Financials
- 12.1.12.4. SWOT Analysis
- 12.1.13 Baerlocher GmbH
- 12.1.13.1. Company Overview
- 12.1.13.2. Products
- 12.1.13.3. Company Financials
- 12.1.13.4. SWOT Analysis
- 12.1.14 Behn-Meyer Holding AG
- 12.1.14.1. Company Overview
- 12.1.14.2. Products
- 12.1.14.3. Company Financials
- 12.1.14.4. SWOT Analysis
- 12.1.15 Zibo Fenbao Chemical Co Ltd*List Not Exhaustive
- 12.1.15.1. Company Overview
- 12.1.15.2. Products
- 12.1.15.3. Company Financials
- 12.1.15.4. SWOT Analysis
- 12.1.16 Pacific Oleochemicals Sdn Bhd
- 12.1.16.1. Company Overview
- 12.1.16.2. Products
- 12.1.16.3. Company Financials
- 12.1.16.4. SWOT Analysis
- 12.1.1 Kraton Performance Polymers Inc
- 12.2. Market Entropy
- 12.2.1 Company's Key Areas Served
- 12.2.2 Recent Developments
- 12.3. Company Market Share Analysis 2025
- 12.3.1 Top 5 Companies Market Share Analysis
- 12.3.2 Top 3 Companies Market Share Analysis
- 12.4. List of Potential Customers
- 13. Research Methodology
List of Figures
- Figure 1: Global Natural Fatty Acids Market Revenue Breakdown (Million, %) by Region 2025 & 2033
- Figure 2: Global Natural Fatty Acids Market Volume Breakdown (liter , %) by Region 2025 & 2033
- Figure 3: Asia Pacific Natural Fatty Acids Market Revenue (Million), by Type 2025 & 2033
- Figure 4: Asia Pacific Natural Fatty Acids Market Volume (liter ), by Type 2025 & 2033
- Figure 5: Asia Pacific Natural Fatty Acids Market Revenue Share (%), by Type 2025 & 2033
- Figure 6: Asia Pacific Natural Fatty Acids Market Volume Share (%), by Type 2025 & 2033
- Figure 7: Asia Pacific Natural Fatty Acids Market Revenue (Million), by Application 2025 & 2033
- Figure 8: Asia Pacific Natural Fatty Acids Market Volume (liter ), by Application 2025 & 2033
- Figure 9: Asia Pacific Natural Fatty Acids Market Revenue Share (%), by Application 2025 & 2033
- Figure 10: Asia Pacific Natural Fatty Acids Market Volume Share (%), by Application 2025 & 2033
- Figure 11: Asia Pacific Natural Fatty Acids Market Revenue (Million), by Country 2025 & 2033
- Figure 12: Asia Pacific Natural Fatty Acids Market Volume (liter ), by Country 2025 & 2033
- Figure 13: Asia Pacific Natural Fatty Acids Market Revenue Share (%), by Country 2025 & 2033
- Figure 14: Asia Pacific Natural Fatty Acids Market Volume Share (%), by Country 2025 & 2033
- Figure 15: North America Natural Fatty Acids Market Revenue (Million), by Type 2025 & 2033
- Figure 16: North America Natural Fatty Acids Market Volume (liter ), by Type 2025 & 2033
- Figure 17: North America Natural Fatty Acids Market Revenue Share (%), by Type 2025 & 2033
- Figure 18: North America Natural Fatty Acids Market Volume Share (%), by Type 2025 & 2033
- Figure 19: North America Natural Fatty Acids Market Revenue (Million), by Application 2025 & 2033
- Figure 20: North America Natural Fatty Acids Market Volume (liter ), by Application 2025 & 2033
- Figure 21: North America Natural Fatty Acids Market Revenue Share (%), by Application 2025 & 2033
- Figure 22: North America Natural Fatty Acids Market Volume Share (%), by Application 2025 & 2033
- Figure 23: North America Natural Fatty Acids Market Revenue (Million), by Country 2025 & 2033
- Figure 24: North America Natural Fatty Acids Market Volume (liter ), by Country 2025 & 2033
- Figure 25: North America Natural Fatty Acids Market Revenue Share (%), by Country 2025 & 2033
- Figure 26: North America Natural Fatty Acids Market Volume Share (%), by Country 2025 & 2033
- Figure 27: Europe Natural Fatty Acids Market Revenue (Million), by Type 2025 & 2033
- Figure 28: Europe Natural Fatty Acids Market Volume (liter ), by Type 2025 & 2033
- Figure 29: Europe Natural Fatty Acids Market Revenue Share (%), by Type 2025 & 2033
- Figure 30: Europe Natural Fatty Acids Market Volume Share (%), by Type 2025 & 2033
- Figure 31: Europe Natural Fatty Acids Market Revenue (Million), by Application 2025 & 2033
- Figure 32: Europe Natural Fatty Acids Market Volume (liter ), by Application 2025 & 2033
- Figure 33: Europe Natural Fatty Acids Market Revenue Share (%), by Application 2025 & 2033
- Figure 34: Europe Natural Fatty Acids Market Volume Share (%), by Application 2025 & 2033
- Figure 35: Europe Natural Fatty Acids Market Revenue (Million), by Country 2025 & 2033
- Figure 36: Europe Natural Fatty Acids Market Volume (liter ), by Country 2025 & 2033
- Figure 37: Europe Natural Fatty Acids Market Revenue Share (%), by Country 2025 & 2033
- Figure 38: Europe Natural Fatty Acids Market Volume Share (%), by Country 2025 & 2033
- Figure 39: South America Natural Fatty Acids Market Revenue (Million), by Type 2025 & 2033
- Figure 40: South America Natural Fatty Acids Market Volume (liter ), by Type 2025 & 2033
- Figure 41: South America Natural Fatty Acids Market Revenue Share (%), by Type 2025 & 2033
- Figure 42: South America Natural Fatty Acids Market Volume Share (%), by Type 2025 & 2033
- Figure 43: South America Natural Fatty Acids Market Revenue (Million), by Application 2025 & 2033
- Figure 44: South America Natural Fatty Acids Market Volume (liter ), by Application 2025 & 2033
- Figure 45: South America Natural Fatty Acids Market Revenue Share (%), by Application 2025 & 2033
- Figure 46: South America Natural Fatty Acids Market Volume Share (%), by Application 2025 & 2033
- Figure 47: South America Natural Fatty Acids Market Revenue (Million), by Country 2025 & 2033
- Figure 48: South America Natural Fatty Acids Market Volume (liter ), by Country 2025 & 2033
- Figure 49: South America Natural Fatty Acids Market Revenue Share (%), by Country 2025 & 2033
- Figure 50: South America Natural Fatty Acids Market Volume Share (%), by Country 2025 & 2033
- Figure 51: Middle East and Africa Natural Fatty Acids Market Revenue (Million), by Type 2025 & 2033
- Figure 52: Middle East and Africa Natural Fatty Acids Market Volume (liter ), by Type 2025 & 2033
- Figure 53: Middle East and Africa Natural Fatty Acids Market Revenue Share (%), by Type 2025 & 2033
- Figure 54: Middle East and Africa Natural Fatty Acids Market Volume Share (%), by Type 2025 & 2033
- Figure 55: Middle East and Africa Natural Fatty Acids Market Revenue (Million), by Application 2025 & 2033
- Figure 56: Middle East and Africa Natural Fatty Acids Market Volume (liter ), by Application 2025 & 2033
- Figure 57: Middle East and Africa Natural Fatty Acids Market Revenue Share (%), by Application 2025 & 2033
- Figure 58: Middle East and Africa Natural Fatty Acids Market Volume Share (%), by Application 2025 & 2033
- Figure 59: Middle East and Africa Natural Fatty Acids Market Revenue (Million), by Country 2025 & 2033
- Figure 60: Middle East and Africa Natural Fatty Acids Market Volume (liter ), by Country 2025 & 2033
- Figure 61: Middle East and Africa Natural Fatty Acids Market Revenue Share (%), by Country 2025 & 2033
- Figure 62: Middle East and Africa Natural Fatty Acids Market Volume Share (%), by Country 2025 & 2033
List of Tables
- Table 1: Global Natural Fatty Acids Market Revenue Million Forecast, by Type 2020 & 2033
- Table 2: Global Natural Fatty Acids Market Volume liter Forecast, by Type 2020 & 2033
- Table 3: Global Natural Fatty Acids Market Revenue Million Forecast, by Application 2020 & 2033
- Table 4: Global Natural Fatty Acids Market Volume liter Forecast, by Application 2020 & 2033
- Table 5: Global Natural Fatty Acids Market Revenue Million Forecast, by Region 2020 & 2033
- Table 6: Global Natural Fatty Acids Market Volume liter Forecast, by Region 2020 & 2033
- Table 7: Global Natural Fatty Acids Market Revenue Million Forecast, by Type 2020 & 2033
- Table 8: Global Natural Fatty Acids Market Volume liter Forecast, by Type 2020 & 2033
- Table 9: Global Natural Fatty Acids Market Revenue Million Forecast, by Application 2020 & 2033
- Table 10: Global Natural Fatty Acids Market Volume liter Forecast, by Application 2020 & 2033
- Table 11: Global Natural Fatty Acids Market Revenue Million Forecast, by Country 2020 & 2033
- Table 12: Global Natural Fatty Acids Market Volume liter Forecast, by Country 2020 & 2033
- Table 13: China Natural Fatty Acids Market Revenue (Million) Forecast, by Application 2020 & 2033
- Table 14: China Natural Fatty Acids Market Volume (liter ) Forecast, by Application 2020 & 2033
- Table 15: India Natural Fatty Acids Market Revenue (Million) Forecast, by Application 2020 & 2033
- Table 16: India Natural Fatty Acids Market Volume (liter ) Forecast, by Application 2020 & 2033
- Table 17: Japan Natural Fatty Acids Market Revenue (Million) Forecast, by Application 2020 & 2033
- Table 18: Japan Natural Fatty Acids Market Volume (liter ) Forecast, by Application 2020 & 2033
- Table 19: South Korea Natural Fatty Acids Market Revenue (Million) Forecast, by Application 2020 & 2033
- Table 20: South Korea Natural Fatty Acids Market Volume (liter ) Forecast, by Application 2020 & 2033
- Table 21: Rest of Asia Pacific Natural Fatty Acids Market Revenue (Million) Forecast, by Application 2020 & 2033
- Table 22: Rest of Asia Pacific Natural Fatty Acids Market Volume (liter ) Forecast, by Application 2020 & 2033
- Table 23: Global Natural Fatty Acids Market Revenue Million Forecast, by Type 2020 & 2033
- Table 24: Global Natural Fatty Acids Market Volume liter Forecast, by Type 2020 & 2033
- Table 25: Global Natural Fatty Acids Market Revenue Million Forecast, by Application 2020 & 2033
- Table 26: Global Natural Fatty Acids Market Volume liter Forecast, by Application 2020 & 2033
- Table 27: Global Natural Fatty Acids Market Revenue Million Forecast, by Country 2020 & 2033
- Table 28: Global Natural Fatty Acids Market Volume liter Forecast, by Country 2020 & 2033
- Table 29: United States Natural Fatty Acids Market Revenue (Million) Forecast, by Application 2020 & 2033
- Table 30: United States Natural Fatty Acids Market Volume (liter ) Forecast, by Application 2020 & 2033
- Table 31: Canada Natural Fatty Acids Market Revenue (Million) Forecast, by Application 2020 & 2033
- Table 32: Canada Natural Fatty Acids Market Volume (liter ) Forecast, by Application 2020 & 2033
- Table 33: Mexico Natural Fatty Acids Market Revenue (Million) Forecast, by Application 2020 & 2033
- Table 34: Mexico Natural Fatty Acids Market Volume (liter ) Forecast, by Application 2020 & 2033
- Table 35: Global Natural Fatty Acids Market Revenue Million Forecast, by Type 2020 & 2033
- Table 36: Global Natural Fatty Acids Market Volume liter Forecast, by Type 2020 & 2033
- Table 37: Global Natural Fatty Acids Market Revenue Million Forecast, by Application 2020 & 2033
- Table 38: Global Natural Fatty Acids Market Volume liter Forecast, by Application 2020 & 2033
- Table 39: Global Natural Fatty Acids Market Revenue Million Forecast, by Country 2020 & 2033
- Table 40: Global Natural Fatty Acids Market Volume liter Forecast, by Country 2020 & 2033
- Table 41: Germany Natural Fatty Acids Market Revenue (Million) Forecast, by Application 2020 & 2033
- Table 42: Germany Natural Fatty Acids Market Volume (liter ) Forecast, by Application 2020 & 2033
- Table 43: United Kingdom Natural Fatty Acids Market Revenue (Million) Forecast, by Application 2020 & 2033
- Table 44: United Kingdom Natural Fatty Acids Market Volume (liter ) Forecast, by Application 2020 & 2033
- Table 45: France Natural Fatty Acids Market Revenue (Million) Forecast, by Application 2020 & 2033
- Table 46: France Natural Fatty Acids Market Volume (liter ) Forecast, by Application 2020 & 2033
- Table 47: Italy Natural Fatty Acids Market Revenue (Million) Forecast, by Application 2020 & 2033
- Table 48: Italy Natural Fatty Acids Market Volume (liter ) Forecast, by Application 2020 & 2033
- Table 49: Rest of Europe Natural Fatty Acids Market Revenue (Million) Forecast, by Application 2020 & 2033
- Table 50: Rest of Europe Natural Fatty Acids Market Volume (liter ) Forecast, by Application 2020 & 2033
- Table 51: Global Natural Fatty Acids Market Revenue Million Forecast, by Type 2020 & 2033
- Table 52: Global Natural Fatty Acids Market Volume liter Forecast, by Type 2020 & 2033
- Table 53: Global Natural Fatty Acids Market Revenue Million Forecast, by Application 2020 & 2033
- Table 54: Global Natural Fatty Acids Market Volume liter Forecast, by Application 2020 & 2033
- Table 55: Global Natural Fatty Acids Market Revenue Million Forecast, by Country 2020 & 2033
- Table 56: Global Natural Fatty Acids Market Volume liter Forecast, by Country 2020 & 2033
- Table 57: Brazil Natural Fatty Acids Market Revenue (Million) Forecast, by Application 2020 & 2033
- Table 58: Brazil Natural Fatty Acids Market Volume (liter ) Forecast, by Application 2020 & 2033
- Table 59: Argentina Natural Fatty Acids Market Revenue (Million) Forecast, by Application 2020 & 2033
- Table 60: Argentina Natural Fatty Acids Market Volume (liter ) Forecast, by Application 2020 & 2033
- Table 61: Rest of South America Natural Fatty Acids Market Revenue (Million) Forecast, by Application 2020 & 2033
- Table 62: Rest of South America Natural Fatty Acids Market Volume (liter ) Forecast, by Application 2020 & 2033
- Table 63: Global Natural Fatty Acids Market Revenue Million Forecast, by Type 2020 & 2033
- Table 64: Global Natural Fatty Acids Market Volume liter Forecast, by Type 2020 & 2033
- Table 65: Global Natural Fatty Acids Market Revenue Million Forecast, by Application 2020 & 2033
- Table 66: Global Natural Fatty Acids Market Volume liter Forecast, by Application 2020 & 2033
- Table 67: Global Natural Fatty Acids Market Revenue Million Forecast, by Country 2020 & 2033
- Table 68: Global Natural Fatty Acids Market Volume liter Forecast, by Country 2020 & 2033
- Table 69: Saudi Arabia Natural Fatty Acids Market Revenue (Million) Forecast, by Application 2020 & 2033
- Table 70: Saudi Arabia Natural Fatty Acids Market Volume (liter ) Forecast, by Application 2020 & 2033
- Table 71: South Africa Natural Fatty Acids Market Revenue (Million) Forecast, by Application 2020 & 2033
- Table 72: South Africa Natural Fatty Acids Market Volume (liter ) Forecast, by Application 2020 & 2033
- Table 73: Rest of Middle East and Africa Natural Fatty Acids Market Revenue (Million) Forecast, by Application 2020 & 2033
- Table 74: Rest of Middle East and Africa Natural Fatty Acids Market Volume (liter ) Forecast, by Application 2020 & 2033
Frequently Asked Questions
1. What is the projected Compound Annual Growth Rate (CAGR) of the Natural Fatty Acids Market?
The projected CAGR is approximately > 5.00%.
2. Which companies are prominent players in the Natural Fatty Acids Market?
Key companies in the market include Kraton Performance Polymers Inc, Yueyang Ch-Cheng Oleochemicals Co Ltd, Ashland Inc, Akzo Nobel NV, Croda Industrial Chemicals, BASF SE, SABIC, Eastman Chemical Company, Chemithon Corporation, Chemol Company Inc, LG Chemicals, Faci SpA, Baerlocher GmbH, Behn-Meyer Holding AG, Zibo Fenbao Chemical Co Ltd*List Not Exhaustive, Pacific Oleochemicals Sdn Bhd.
3. What are the main segments of the Natural Fatty Acids Market?
The market segments include Type, Application.
4. Can you provide details about the market size?
The market size is estimated to be USD XX Million as of 2022.
5. What are some drivers contributing to market growth?
Increasing Demand for Glycerin to Manufacture Propylene Glycol and Epichlorohydrin; Government Regulations Promoting the Use of Eco-friendly Products; Broader Use of C18s in Oilfield and Drilling Applications; Increasing Demand from the Cosmetics and Personal Care Market.
6. What are the notable trends driving market growth?
Household. Cosmetics. and Personal Care Segment to Dominate the Market Demand.
7. Are there any restraints impacting market growth?
Fluctuating Supply and Prices of Feed Stock Materials.
8. Can you provide examples of recent developments in the market?
November 2022: Sinarmas Cepsa Pte Ltd (SCPL) and its parent companies, the chemicals business of CEPSA and agribusiness Golden Agri-Resources (GAR), signed a Memorandum of Understanding to expand the production of bio-based chemicals at SCPL's site in Lubuk Gaung, Indonesia.
9. What pricing options are available for accessing the report?
Pricing options include single-user, multi-user, and enterprise licenses priced at USD 4750, USD 5250, and USD 8750 respectively.
10. Is the market size provided in terms of value or volume?
The market size is provided in terms of value, measured in Million and volume, measured in liter .
11. Are there any specific market keywords associated with the report?
Yes, the market keyword associated with the report is "Natural Fatty Acids Market," which aids in identifying and referencing the specific market segment covered.
12. How do I determine which pricing option suits my needs best?
The pricing options vary based on user requirements and access needs. Individual users may opt for single-user licenses, while businesses requiring broader access may choose multi-user or enterprise licenses for cost-effective access to the report.
13. Are there any additional resources or data provided in the Natural Fatty Acids Market report?
While the report offers comprehensive insights, it's advisable to review the specific contents or supplementary materials provided to ascertain if additional resources or data are available.
14. How can I stay updated on further developments or reports in the Natural Fatty Acids Market?
To stay informed about further developments, trends, and reports in the Natural Fatty Acids Market, consider subscribing to industry newsletters, following relevant companies and organizations, or regularly checking reputable industry news sources and publications.
Methodology
Step 1 - Identification of Relevant Samples Size from Population Database


Step 2 - Approaches for Defining Global Market Size (Value, Volume* & Price*)

Note*: In applicable scenarios
Step 3 - Data Sources
Primary Research
- Web Analytics
- Survey Reports
- Research Institute
- Latest Research Reports
- Opinion Leaders
Secondary Research
- Annual Reports
- White Paper
- Latest Press Release
- Industry Association
- Paid Database
- Investor Presentations

Step 4 - Data Triangulation
Involves using different sources of information in order to increase the validity of a study
These sources are likely to be stakeholders in a program - participants, other researchers, program staff, other community members, and so on.
Then we put all data in single framework & apply various statistical tools to find out the dynamic on the market.
During the analysis stage, feedback from the stakeholder groups would be compared to determine areas of agreement as well as areas of divergence