
Key Insights
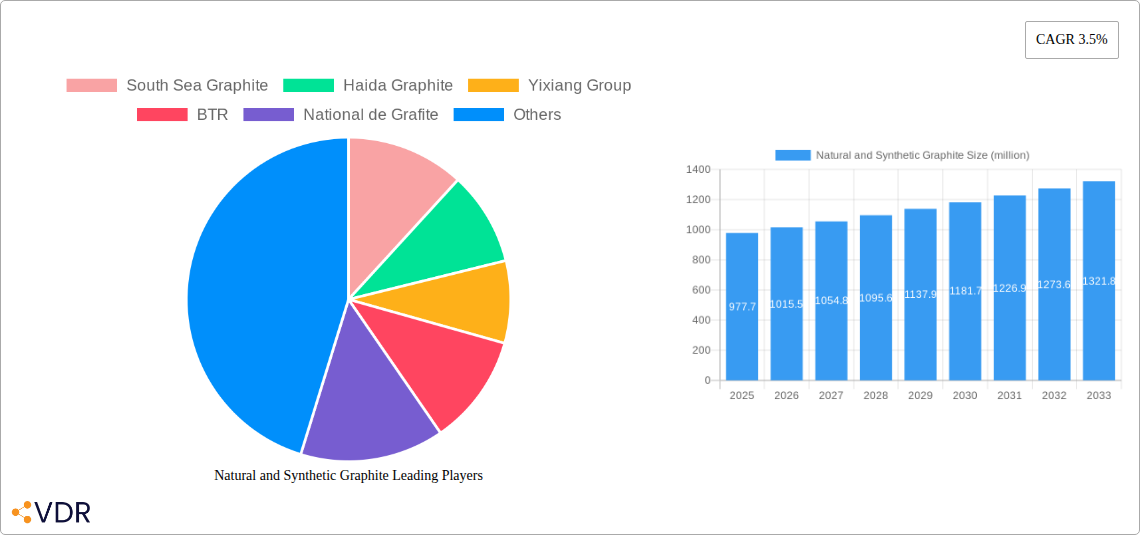
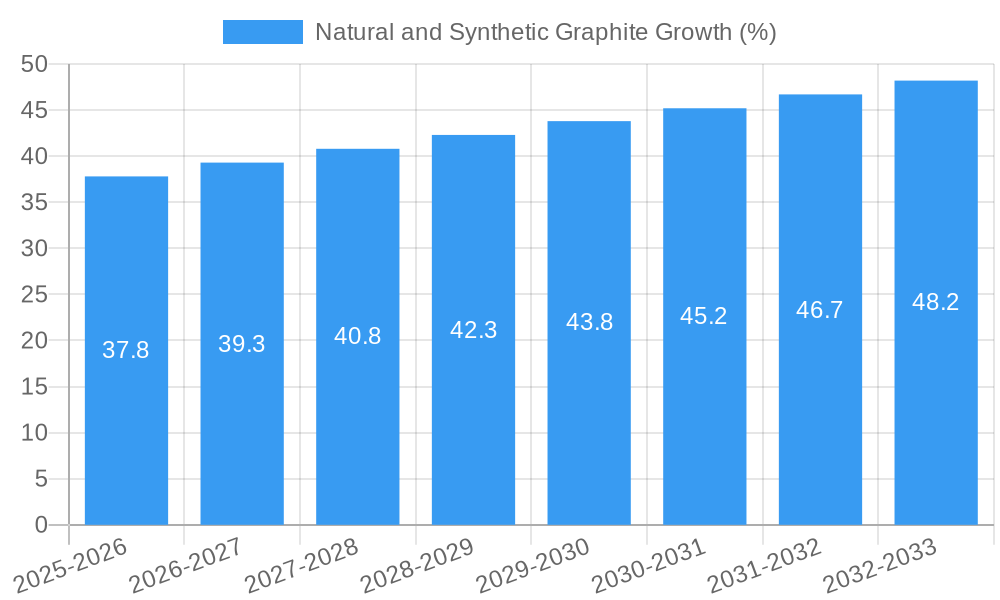
The global natural and synthetic graphite market, valued at $977.7 million in 2025, is projected to experience steady growth, driven by increasing demand from key sectors like electric vehicles (EVs), energy storage systems (ESS), and advanced manufacturing. The Compound Annual Growth Rate (CAGR) of 3.5% from 2025 to 2033 reflects a consistent, albeit moderate, expansion. This growth is fueled by the escalating adoption of lithium-ion batteries, a critical component in EVs and ESS, which rely heavily on graphite's conductive and thermal properties. Furthermore, the rising application of graphite in high-performance materials for aerospace and defense further contributes to market expansion. While challenges exist, such as price volatility of raw materials and supply chain disruptions, technological advancements in graphite production and purification are expected to mitigate these constraints. The market is segmented by type (natural and synthetic), application (batteries, refractories, lubricants, etc.), and region, each exhibiting unique growth trajectories influenced by factors specific to their respective geographic locations and industrial landscapes. Major players, including South Sea Graphite, Imerys Graphite and Carbon, and SGL Group, are actively shaping the market through strategic investments in R&D, capacity expansion, and partnerships, further consolidating their market positions.
The competitive landscape is characterized by a blend of established players and emerging companies. Established players leverage their extensive production networks and technological expertise to maintain market share, while new entrants focus on innovation and niche applications. Geographic distribution reveals varying levels of market penetration, with certain regions exhibiting higher growth rates due to factors such as favorable government policies supporting green technologies, and thriving automotive and energy sectors. Future market dynamics will be shaped by factors such as the pace of EV adoption, the development of alternative battery technologies, and governmental regulations related to environmental sustainability. Continued innovation in graphite processing and the exploration of new graphite resources will play a crucial role in sustaining market growth in the coming years.
Natural and Synthetic Graphite Market Report: 2019-2033
This comprehensive report provides an in-depth analysis of the global natural and synthetic graphite market, encompassing market dynamics, growth trends, regional dominance, product landscape, key players, and future outlook. The study period covers 2019-2033, with 2025 as the base and estimated year, and a forecast period of 2025-2033. The report utilizes data from the historical period (2019-2024) to project future market trends and provide actionable insights for industry professionals. The market is segmented by type (natural and synthetic) and application (batteries, refractories, lubricants, etc.), allowing for a granular understanding of market dynamics across parent and child markets. The report values are presented in million units.
Natural and Synthetic Graphite Market Dynamics & Structure
This section analyzes the competitive landscape, technological advancements, regulatory environment, and market forces shaping the natural and synthetic graphite industry. The report examines market concentration, identifying key players and their market share, as well as assessing the impact of mergers and acquisitions (M&A) activities.
- Market Concentration: The market is characterized by a mix of large multinational corporations and smaller, specialized producers. The top 10 players account for approximately xx% of the global market share in 2025. Market concentration is expected to xx% by 2033.
- Technological Innovation: Ongoing research and development efforts focus on enhancing graphite purity, improving production efficiency, and exploring new applications. Key innovations include the development of advanced purification techniques and the creation of specialized graphite grades for high-performance batteries.
- Regulatory Frameworks: Environmental regulations and policies related to mining and processing of graphite significantly impact industry operations and sustainability practices.
- Competitive Product Substitutes: Alternative materials, such as graphene and other carbon-based materials, pose a potential threat, though their market penetration remains limited as of 2025.
- End-User Demographics: The automotive, electronics, and energy storage sectors are the primary drivers of demand, with significant growth projected across various segments during the forecast period.
- M&A Trends: The number of M&A deals in the graphite industry has experienced a xx% increase since 2019, indicating consolidation and strategic expansion. The total deal value in 2024 was estimated at xx million.
Natural and Synthetic Graphite Growth Trends & Insights
This section details the historical and projected market size evolution, adoption rates, and technological disruptions impacting the natural and synthetic graphite market. Specific growth metrics, including Compound Annual Growth Rate (CAGR) and market penetration rates, are provided to illustrate market expansion.
The global natural and synthetic graphite market witnessed a CAGR of xx% during the historical period (2019-2024), reaching xx million in 2024. The forecast period (2025-2033) is anticipated to exhibit a CAGR of xx%, driven by increasing demand from the expanding electric vehicle (EV) and energy storage systems (ESS) markets. Technological advancements in graphite processing and purification techniques are also contributing to this growth. Consumer preference towards sustainable and high-performance products is further accelerating market adoption. Market penetration in key end-use sectors like batteries is expected to increase from xx% in 2025 to xx% by 2033.
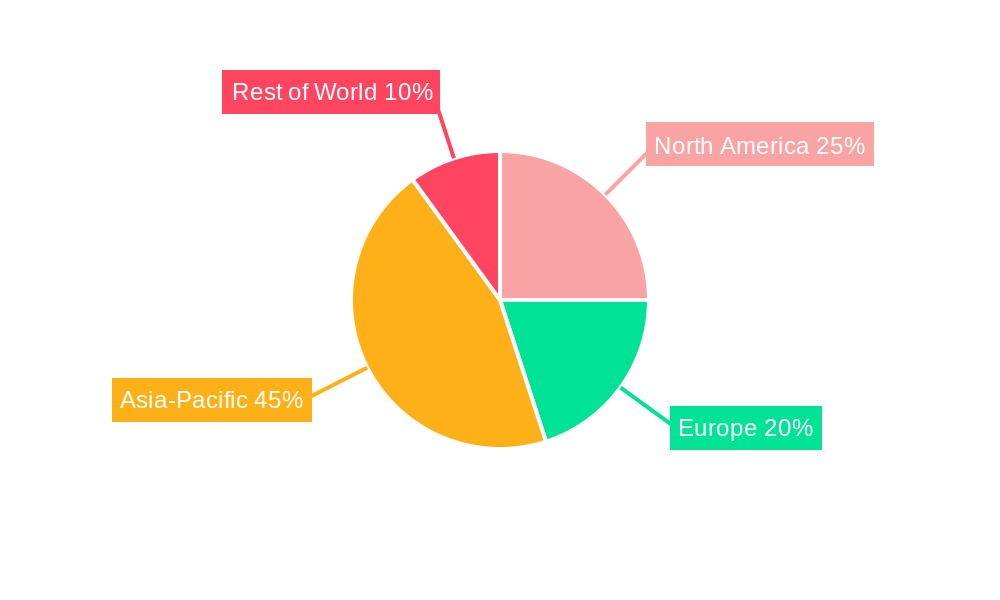
Dominant Regions, Countries, or Segments in Natural and Synthetic Graphite
This section identifies leading regions and countries driving market growth and assesses their dominance factors.
- China: China holds a significant market share, owing to its large production capacity, abundant graphite reserves, and strong downstream industries. Supportive government policies and investments in the EV sector are key growth drivers. (Market share in 2025: xx%).
- Other regions: Other regions contributing significantly to the market are North America, Europe, and parts of Asia. Growth in these regions is driven by factors such as increasing demand for lithium-ion batteries, expansion of renewable energy projects, and supportive government regulations.
Key drivers in dominant regions include:
- Robust economic growth and rising disposable incomes.
- Favorable government policies promoting the adoption of clean energy technologies.
- Development of robust infrastructure supporting the EV and energy storage industries.
Natural and Synthetic Graphite Product Landscape
The natural and synthetic graphite market offers a range of products with varying purity, particle size, and properties, tailored to specific applications. Significant innovations focus on enhancing the performance characteristics of graphite for use in high-capacity batteries and other advanced technologies. Unique selling propositions (USPs) often center around superior purity, improved conductivity, and enhanced thermal stability.
Key Drivers, Barriers & Challenges in Natural and Synthetic Graphite
Key Drivers:
- The booming electric vehicle (EV) market is a primary driver, demanding large quantities of high-quality graphite for batteries.
- Growth in renewable energy storage solutions, such as grid-scale batteries, fuels demand.
- Advancements in graphite purification and processing techniques are enabling the production of higher-quality materials.
Key Challenges:
- Supply chain disruptions and price volatility of graphite raw materials pose significant challenges.
- Environmental regulations related to mining and processing can increase operational costs.
- Intense competition among graphite producers necessitates continuous innovation and cost optimization.
Emerging Opportunities in Natural and Synthetic Graphite
Emerging opportunities lie in:
- Expanding applications of graphite in advanced materials and composites.
- Development of sustainable and environmentally friendly graphite production methods.
- Exploration of new graphite sources and improved extraction techniques.
Growth Accelerators in the Natural and Synthetic Graphite Industry
Technological advancements in battery technology and the expansion of the EV market are key growth accelerators. Strategic partnerships and collaborations between graphite producers, battery manufacturers, and automakers are driving innovation and market expansion. Investments in research and development for improved graphite materials and processing technologies further boost market growth.
Key Players Shaping the Natural and Synthetic Graphite Market
- South Sea Graphite
- Haida Graphite
- Yixiang Group
- BTR
- National de Grafite
- Northeast Asia Mineral Resources
- Aoyu Graphite Group
- Xincheng New Material
- SGL
- Tiansheng Nonmetal Ind
- Xinghe Graphite
- Heijin Graphite
- Imerys Graphite and Carbon
- Agrawal Graphite Industries
- Jinhuafeng Graphite
- Fangda Carbon
- Graphit Kropfmuhl AG
- Grafitbergbau Kaisersberg
- Fuda Graphite
- Fenlu Graphite
- Black Dragon Graphite
- Huangyu Graphite
- Puchen Graphite
- Koh-i-Noor Grafit Sro
- Tirupati Graphite
- Xincheng Graphite
- Jinhui Graphite
- Yanxin Graphite
- Shida Carbon
Notable Milestones in Natural and Synthetic Graphite Sector
- 2021 Q4: Several major battery manufacturers announce long-term agreements with graphite suppliers, securing raw material supplies.
- 2022 Q2: A significant merger occurs between two leading graphite producers, creating a larger, more integrated entity.
- 2023 Q3: A new high-purity graphite processing plant opens in [Location], expanding global production capacity.
In-Depth Natural and Synthetic Graphite Market Outlook
The future of the natural and synthetic graphite market appears bright, fueled by the continued expansion of the EV and renewable energy sectors. Strategic investments in research and development, coupled with sustainable production practices, will be critical for long-term success. The market is expected to experience robust growth, with significant opportunities for companies that can adapt to evolving technological advancements and meet the growing demands of a rapidly changing landscape.
Natural and Synthetic Graphite Segmentation
-
1. Application
- 1.1. Refractories
- 1.2. Metallurgy
- 1.3. Parts and Components
- 1.4. Batteries
- 1.5. Other
-
2. Types
- 2.1. Natural Graphite
- 2.2. Synthetic Graphite
Natural and Synthetic Graphite Segmentation By Geography
-
1. North America
- 1.1. United States
- 1.2. Canada
- 1.3. Mexico
-
2. South America
- 2.1. Brazil
- 2.2. Argentina
- 2.3. Rest of South America
-
3. Europe
- 3.1. United Kingdom
- 3.2. Germany
- 3.3. France
- 3.4. Italy
- 3.5. Spain
- 3.6. Russia
- 3.7. Benelux
- 3.8. Nordics
- 3.9. Rest of Europe
-
4. Middle East & Africa
- 4.1. Turkey
- 4.2. Israel
- 4.3. GCC
- 4.4. North Africa
- 4.5. South Africa
- 4.6. Rest of Middle East & Africa
-
5. Asia Pacific
- 5.1. China
- 5.2. India
- 5.3. Japan
- 5.4. South Korea
- 5.5. ASEAN
- 5.6. Oceania
- 5.7. Rest of Asia Pacific
Natural and Synthetic Graphite REPORT HIGHLIGHTS
| Aspects | Details |
|---|---|
| Study Period | 2019-2033 |
| Base Year | 2024 |
| Estimated Year | 2025 |
| Forecast Period | 2025-2033 |
| Historical Period | 2019-2024 |
| Growth Rate | CAGR of 3.5% from 2019-2033 |
| Segmentation |
|
Table of Contents
- 1. Introduction
- 1.1. Research Scope
- 1.2. Market Segmentation
- 1.3. Research Methodology
- 1.4. Definitions and Assumptions
- 2. Executive Summary
- 2.1. Introduction
- 3. Market Dynamics
- 3.1. Introduction
- 3.2. Market Drivers
- 3.3. Market Restrains
- 3.4. Market Trends
- 4. Market Factor Analysis
- 4.1. Porters Five Forces
- 4.2. Supply/Value Chain
- 4.3. PESTEL analysis
- 4.4. Market Entropy
- 4.5. Patent/Trademark Analysis
- 5. Global Natural and Synthetic Graphite Analysis, Insights and Forecast, 2019-2031
- 5.1. Market Analysis, Insights and Forecast - by Application
- 5.1.1. Refractories
- 5.1.2. Metallurgy
- 5.1.3. Parts and Components
- 5.1.4. Batteries
- 5.1.5. Other
- 5.2. Market Analysis, Insights and Forecast - by Types
- 5.2.1. Natural Graphite
- 5.2.2. Synthetic Graphite
- 5.3. Market Analysis, Insights and Forecast - by Region
- 5.3.1. North America
- 5.3.2. South America
- 5.3.3. Europe
- 5.3.4. Middle East & Africa
- 5.3.5. Asia Pacific
- 5.1. Market Analysis, Insights and Forecast - by Application
- 6. North America Natural and Synthetic Graphite Analysis, Insights and Forecast, 2019-2031
- 6.1. Market Analysis, Insights and Forecast - by Application
- 6.1.1. Refractories
- 6.1.2. Metallurgy
- 6.1.3. Parts and Components
- 6.1.4. Batteries
- 6.1.5. Other
- 6.2. Market Analysis, Insights and Forecast - by Types
- 6.2.1. Natural Graphite
- 6.2.2. Synthetic Graphite
- 6.1. Market Analysis, Insights and Forecast - by Application
- 7. South America Natural and Synthetic Graphite Analysis, Insights and Forecast, 2019-2031
- 7.1. Market Analysis, Insights and Forecast - by Application
- 7.1.1. Refractories
- 7.1.2. Metallurgy
- 7.1.3. Parts and Components
- 7.1.4. Batteries
- 7.1.5. Other
- 7.2. Market Analysis, Insights and Forecast - by Types
- 7.2.1. Natural Graphite
- 7.2.2. Synthetic Graphite
- 7.1. Market Analysis, Insights and Forecast - by Application
- 8. Europe Natural and Synthetic Graphite Analysis, Insights and Forecast, 2019-2031
- 8.1. Market Analysis, Insights and Forecast - by Application
- 8.1.1. Refractories
- 8.1.2. Metallurgy
- 8.1.3. Parts and Components
- 8.1.4. Batteries
- 8.1.5. Other
- 8.2. Market Analysis, Insights and Forecast - by Types
- 8.2.1. Natural Graphite
- 8.2.2. Synthetic Graphite
- 8.1. Market Analysis, Insights and Forecast - by Application
- 9. Middle East & Africa Natural and Synthetic Graphite Analysis, Insights and Forecast, 2019-2031
- 9.1. Market Analysis, Insights and Forecast - by Application
- 9.1.1. Refractories
- 9.1.2. Metallurgy
- 9.1.3. Parts and Components
- 9.1.4. Batteries
- 9.1.5. Other
- 9.2. Market Analysis, Insights and Forecast - by Types
- 9.2.1. Natural Graphite
- 9.2.2. Synthetic Graphite
- 9.1. Market Analysis, Insights and Forecast - by Application
- 10. Asia Pacific Natural and Synthetic Graphite Analysis, Insights and Forecast, 2019-2031
- 10.1. Market Analysis, Insights and Forecast - by Application
- 10.1.1. Refractories
- 10.1.2. Metallurgy
- 10.1.3. Parts and Components
- 10.1.4. Batteries
- 10.1.5. Other
- 10.2. Market Analysis, Insights and Forecast - by Types
- 10.2.1. Natural Graphite
- 10.2.2. Synthetic Graphite
- 10.1. Market Analysis, Insights and Forecast - by Application
- 11. Competitive Analysis
- 11.1. Global Market Share Analysis 2024
- 11.2. Company Profiles
- 11.2.1 South Sea Graphite
- 11.2.1.1. Overview
- 11.2.1.2. Products
- 11.2.1.3. SWOT Analysis
- 11.2.1.4. Recent Developments
- 11.2.1.5. Financials (Based on Availability)
- 11.2.2 Haida Graphite
- 11.2.2.1. Overview
- 11.2.2.2. Products
- 11.2.2.3. SWOT Analysis
- 11.2.2.4. Recent Developments
- 11.2.2.5. Financials (Based on Availability)
- 11.2.3 Yixiang Group
- 11.2.3.1. Overview
- 11.2.3.2. Products
- 11.2.3.3. SWOT Analysis
- 11.2.3.4. Recent Developments
- 11.2.3.5. Financials (Based on Availability)
- 11.2.4 BTR
- 11.2.4.1. Overview
- 11.2.4.2. Products
- 11.2.4.3. SWOT Analysis
- 11.2.4.4. Recent Developments
- 11.2.4.5. Financials (Based on Availability)
- 11.2.5 National de Grafite
- 11.2.5.1. Overview
- 11.2.5.2. Products
- 11.2.5.3. SWOT Analysis
- 11.2.5.4. Recent Developments
- 11.2.5.5. Financials (Based on Availability)
- 11.2.6 Northeast Asia Mineral Resources
- 11.2.6.1. Overview
- 11.2.6.2. Products
- 11.2.6.3. SWOT Analysis
- 11.2.6.4. Recent Developments
- 11.2.6.5. Financials (Based on Availability)
- 11.2.7 Aoyu Graphite Group
- 11.2.7.1. Overview
- 11.2.7.2. Products
- 11.2.7.3. SWOT Analysis
- 11.2.7.4. Recent Developments
- 11.2.7.5. Financials (Based on Availability)
- 11.2.8 Xincheng New Material
- 11.2.8.1. Overview
- 11.2.8.2. Products
- 11.2.8.3. SWOT Analysis
- 11.2.8.4. Recent Developments
- 11.2.8.5. Financials (Based on Availability)
- 11.2.9 SGL
- 11.2.9.1. Overview
- 11.2.9.2. Products
- 11.2.9.3. SWOT Analysis
- 11.2.9.4. Recent Developments
- 11.2.9.5. Financials (Based on Availability)
- 11.2.10 Tiansheng Nonmetal Ind
- 11.2.10.1. Overview
- 11.2.10.2. Products
- 11.2.10.3. SWOT Analysis
- 11.2.10.4. Recent Developments
- 11.2.10.5. Financials (Based on Availability)
- 11.2.11 Xinghe Graphite
- 11.2.11.1. Overview
- 11.2.11.2. Products
- 11.2.11.3. SWOT Analysis
- 11.2.11.4. Recent Developments
- 11.2.11.5. Financials (Based on Availability)
- 11.2.12 Heijin Graphite
- 11.2.12.1. Overview
- 11.2.12.2. Products
- 11.2.12.3. SWOT Analysis
- 11.2.12.4. Recent Developments
- 11.2.12.5. Financials (Based on Availability)
- 11.2.13 Imerys Graphite and Carbon
- 11.2.13.1. Overview
- 11.2.13.2. Products
- 11.2.13.3. SWOT Analysis
- 11.2.13.4. Recent Developments
- 11.2.13.5. Financials (Based on Availability)
- 11.2.14 Agrawal Graphite Industries
- 11.2.14.1. Overview
- 11.2.14.2. Products
- 11.2.14.3. SWOT Analysis
- 11.2.14.4. Recent Developments
- 11.2.14.5. Financials (Based on Availability)
- 11.2.15 Jinhuafeng Graphite
- 11.2.15.1. Overview
- 11.2.15.2. Products
- 11.2.15.3. SWOT Analysis
- 11.2.15.4. Recent Developments
- 11.2.15.5. Financials (Based on Availability)
- 11.2.16 Fangda Carbon
- 11.2.16.1. Overview
- 11.2.16.2. Products
- 11.2.16.3. SWOT Analysis
- 11.2.16.4. Recent Developments
- 11.2.16.5. Financials (Based on Availability)
- 11.2.17 Graphit Kropfmuhl AG
- 11.2.17.1. Overview
- 11.2.17.2. Products
- 11.2.17.3. SWOT Analysis
- 11.2.17.4. Recent Developments
- 11.2.17.5. Financials (Based on Availability)
- 11.2.18 Grafitbergbau Kaisersberg
- 11.2.18.1. Overview
- 11.2.18.2. Products
- 11.2.18.3. SWOT Analysis
- 11.2.18.4. Recent Developments
- 11.2.18.5. Financials (Based on Availability)
- 11.2.19 Fuda Graphite
- 11.2.19.1. Overview
- 11.2.19.2. Products
- 11.2.19.3. SWOT Analysis
- 11.2.19.4. Recent Developments
- 11.2.19.5. Financials (Based on Availability)
- 11.2.20 Fenlu Graphite
- 11.2.20.1. Overview
- 11.2.20.2. Products
- 11.2.20.3. SWOT Analysis
- 11.2.20.4. Recent Developments
- 11.2.20.5. Financials (Based on Availability)
- 11.2.21 Black Dragon Graphite
- 11.2.21.1. Overview
- 11.2.21.2. Products
- 11.2.21.3. SWOT Analysis
- 11.2.21.4. Recent Developments
- 11.2.21.5. Financials (Based on Availability)
- 11.2.22 Huangyu Graphite
- 11.2.22.1. Overview
- 11.2.22.2. Products
- 11.2.22.3. SWOT Analysis
- 11.2.22.4. Recent Developments
- 11.2.22.5. Financials (Based on Availability)
- 11.2.23 Puchen Graphite
- 11.2.23.1. Overview
- 11.2.23.2. Products
- 11.2.23.3. SWOT Analysis
- 11.2.23.4. Recent Developments
- 11.2.23.5. Financials (Based on Availability)
- 11.2.24 Koh-i-Noor Grafit Sro
- 11.2.24.1. Overview
- 11.2.24.2. Products
- 11.2.24.3. SWOT Analysis
- 11.2.24.4. Recent Developments
- 11.2.24.5. Financials (Based on Availability)
- 11.2.25 Tirupati Graphite
- 11.2.25.1. Overview
- 11.2.25.2. Products
- 11.2.25.3. SWOT Analysis
- 11.2.25.4. Recent Developments
- 11.2.25.5. Financials (Based on Availability)
- 11.2.26 Xincheng Graphite
- 11.2.26.1. Overview
- 11.2.26.2. Products
- 11.2.26.3. SWOT Analysis
- 11.2.26.4. Recent Developments
- 11.2.26.5. Financials (Based on Availability)
- 11.2.27 Jinhui Graphite
- 11.2.27.1. Overview
- 11.2.27.2. Products
- 11.2.27.3. SWOT Analysis
- 11.2.27.4. Recent Developments
- 11.2.27.5. Financials (Based on Availability)
- 11.2.28 Yanxin Graphite
- 11.2.28.1. Overview
- 11.2.28.2. Products
- 11.2.28.3. SWOT Analysis
- 11.2.28.4. Recent Developments
- 11.2.28.5. Financials (Based on Availability)
- 11.2.29 Shida Carbon
- 11.2.29.1. Overview
- 11.2.29.2. Products
- 11.2.29.3. SWOT Analysis
- 11.2.29.4. Recent Developments
- 11.2.29.5. Financials (Based on Availability)
- 11.2.1 South Sea Graphite
List of Figures
- Figure 1: Global Natural and Synthetic Graphite Revenue Breakdown (million, %) by Region 2024 & 2032
- Figure 2: North America Natural and Synthetic Graphite Revenue (million), by Application 2024 & 2032
- Figure 3: North America Natural and Synthetic Graphite Revenue Share (%), by Application 2024 & 2032
- Figure 4: North America Natural and Synthetic Graphite Revenue (million), by Types 2024 & 2032
- Figure 5: North America Natural and Synthetic Graphite Revenue Share (%), by Types 2024 & 2032
- Figure 6: North America Natural and Synthetic Graphite Revenue (million), by Country 2024 & 2032
- Figure 7: North America Natural and Synthetic Graphite Revenue Share (%), by Country 2024 & 2032
- Figure 8: South America Natural and Synthetic Graphite Revenue (million), by Application 2024 & 2032
- Figure 9: South America Natural and Synthetic Graphite Revenue Share (%), by Application 2024 & 2032
- Figure 10: South America Natural and Synthetic Graphite Revenue (million), by Types 2024 & 2032
- Figure 11: South America Natural and Synthetic Graphite Revenue Share (%), by Types 2024 & 2032
- Figure 12: South America Natural and Synthetic Graphite Revenue (million), by Country 2024 & 2032
- Figure 13: South America Natural and Synthetic Graphite Revenue Share (%), by Country 2024 & 2032
- Figure 14: Europe Natural and Synthetic Graphite Revenue (million), by Application 2024 & 2032
- Figure 15: Europe Natural and Synthetic Graphite Revenue Share (%), by Application 2024 & 2032
- Figure 16: Europe Natural and Synthetic Graphite Revenue (million), by Types 2024 & 2032
- Figure 17: Europe Natural and Synthetic Graphite Revenue Share (%), by Types 2024 & 2032
- Figure 18: Europe Natural and Synthetic Graphite Revenue (million), by Country 2024 & 2032
- Figure 19: Europe Natural and Synthetic Graphite Revenue Share (%), by Country 2024 & 2032
- Figure 20: Middle East & Africa Natural and Synthetic Graphite Revenue (million), by Application 2024 & 2032
- Figure 21: Middle East & Africa Natural and Synthetic Graphite Revenue Share (%), by Application 2024 & 2032
- Figure 22: Middle East & Africa Natural and Synthetic Graphite Revenue (million), by Types 2024 & 2032
- Figure 23: Middle East & Africa Natural and Synthetic Graphite Revenue Share (%), by Types 2024 & 2032
- Figure 24: Middle East & Africa Natural and Synthetic Graphite Revenue (million), by Country 2024 & 2032
- Figure 25: Middle East & Africa Natural and Synthetic Graphite Revenue Share (%), by Country 2024 & 2032
- Figure 26: Asia Pacific Natural and Synthetic Graphite Revenue (million), by Application 2024 & 2032
- Figure 27: Asia Pacific Natural and Synthetic Graphite Revenue Share (%), by Application 2024 & 2032
- Figure 28: Asia Pacific Natural and Synthetic Graphite Revenue (million), by Types 2024 & 2032
- Figure 29: Asia Pacific Natural and Synthetic Graphite Revenue Share (%), by Types 2024 & 2032
- Figure 30: Asia Pacific Natural and Synthetic Graphite Revenue (million), by Country 2024 & 2032
- Figure 31: Asia Pacific Natural and Synthetic Graphite Revenue Share (%), by Country 2024 & 2032
List of Tables
- Table 1: Global Natural and Synthetic Graphite Revenue million Forecast, by Region 2019 & 2032
- Table 2: Global Natural and Synthetic Graphite Revenue million Forecast, by Application 2019 & 2032
- Table 3: Global Natural and Synthetic Graphite Revenue million Forecast, by Types 2019 & 2032
- Table 4: Global Natural and Synthetic Graphite Revenue million Forecast, by Region 2019 & 2032
- Table 5: Global Natural and Synthetic Graphite Revenue million Forecast, by Application 2019 & 2032
- Table 6: Global Natural and Synthetic Graphite Revenue million Forecast, by Types 2019 & 2032
- Table 7: Global Natural and Synthetic Graphite Revenue million Forecast, by Country 2019 & 2032
- Table 8: United States Natural and Synthetic Graphite Revenue (million) Forecast, by Application 2019 & 2032
- Table 9: Canada Natural and Synthetic Graphite Revenue (million) Forecast, by Application 2019 & 2032
- Table 10: Mexico Natural and Synthetic Graphite Revenue (million) Forecast, by Application 2019 & 2032
- Table 11: Global Natural and Synthetic Graphite Revenue million Forecast, by Application 2019 & 2032
- Table 12: Global Natural and Synthetic Graphite Revenue million Forecast, by Types 2019 & 2032
- Table 13: Global Natural and Synthetic Graphite Revenue million Forecast, by Country 2019 & 2032
- Table 14: Brazil Natural and Synthetic Graphite Revenue (million) Forecast, by Application 2019 & 2032
- Table 15: Argentina Natural and Synthetic Graphite Revenue (million) Forecast, by Application 2019 & 2032
- Table 16: Rest of South America Natural and Synthetic Graphite Revenue (million) Forecast, by Application 2019 & 2032
- Table 17: Global Natural and Synthetic Graphite Revenue million Forecast, by Application 2019 & 2032
- Table 18: Global Natural and Synthetic Graphite Revenue million Forecast, by Types 2019 & 2032
- Table 19: Global Natural and Synthetic Graphite Revenue million Forecast, by Country 2019 & 2032
- Table 20: United Kingdom Natural and Synthetic Graphite Revenue (million) Forecast, by Application 2019 & 2032
- Table 21: Germany Natural and Synthetic Graphite Revenue (million) Forecast, by Application 2019 & 2032
- Table 22: France Natural and Synthetic Graphite Revenue (million) Forecast, by Application 2019 & 2032
- Table 23: Italy Natural and Synthetic Graphite Revenue (million) Forecast, by Application 2019 & 2032
- Table 24: Spain Natural and Synthetic Graphite Revenue (million) Forecast, by Application 2019 & 2032
- Table 25: Russia Natural and Synthetic Graphite Revenue (million) Forecast, by Application 2019 & 2032
- Table 26: Benelux Natural and Synthetic Graphite Revenue (million) Forecast, by Application 2019 & 2032
- Table 27: Nordics Natural and Synthetic Graphite Revenue (million) Forecast, by Application 2019 & 2032
- Table 28: Rest of Europe Natural and Synthetic Graphite Revenue (million) Forecast, by Application 2019 & 2032
- Table 29: Global Natural and Synthetic Graphite Revenue million Forecast, by Application 2019 & 2032
- Table 30: Global Natural and Synthetic Graphite Revenue million Forecast, by Types 2019 & 2032
- Table 31: Global Natural and Synthetic Graphite Revenue million Forecast, by Country 2019 & 2032
- Table 32: Turkey Natural and Synthetic Graphite Revenue (million) Forecast, by Application 2019 & 2032
- Table 33: Israel Natural and Synthetic Graphite Revenue (million) Forecast, by Application 2019 & 2032
- Table 34: GCC Natural and Synthetic Graphite Revenue (million) Forecast, by Application 2019 & 2032
- Table 35: North Africa Natural and Synthetic Graphite Revenue (million) Forecast, by Application 2019 & 2032
- Table 36: South Africa Natural and Synthetic Graphite Revenue (million) Forecast, by Application 2019 & 2032
- Table 37: Rest of Middle East & Africa Natural and Synthetic Graphite Revenue (million) Forecast, by Application 2019 & 2032
- Table 38: Global Natural and Synthetic Graphite Revenue million Forecast, by Application 2019 & 2032
- Table 39: Global Natural and Synthetic Graphite Revenue million Forecast, by Types 2019 & 2032
- Table 40: Global Natural and Synthetic Graphite Revenue million Forecast, by Country 2019 & 2032
- Table 41: China Natural and Synthetic Graphite Revenue (million) Forecast, by Application 2019 & 2032
- Table 42: India Natural and Synthetic Graphite Revenue (million) Forecast, by Application 2019 & 2032
- Table 43: Japan Natural and Synthetic Graphite Revenue (million) Forecast, by Application 2019 & 2032
- Table 44: South Korea Natural and Synthetic Graphite Revenue (million) Forecast, by Application 2019 & 2032
- Table 45: ASEAN Natural and Synthetic Graphite Revenue (million) Forecast, by Application 2019 & 2032
- Table 46: Oceania Natural and Synthetic Graphite Revenue (million) Forecast, by Application 2019 & 2032
- Table 47: Rest of Asia Pacific Natural and Synthetic Graphite Revenue (million) Forecast, by Application 2019 & 2032
Frequently Asked Questions
1. What is the projected Compound Annual Growth Rate (CAGR) of the Natural and Synthetic Graphite?
The projected CAGR is approximately 3.5%.
2. Which companies are prominent players in the Natural and Synthetic Graphite?
Key companies in the market include South Sea Graphite, Haida Graphite, Yixiang Group, BTR, National de Grafite, Northeast Asia Mineral Resources, Aoyu Graphite Group, Xincheng New Material, SGL, Tiansheng Nonmetal Ind, Xinghe Graphite, Heijin Graphite, Imerys Graphite and Carbon, Agrawal Graphite Industries, Jinhuafeng Graphite, Fangda Carbon, Graphit Kropfmuhl AG, Grafitbergbau Kaisersberg, Fuda Graphite, Fenlu Graphite, Black Dragon Graphite, Huangyu Graphite, Puchen Graphite, Koh-i-Noor Grafit Sro, Tirupati Graphite, Xincheng Graphite, Jinhui Graphite, Yanxin Graphite, Shida Carbon.
3. What are the main segments of the Natural and Synthetic Graphite?
The market segments include Application, Types.
4. Can you provide details about the market size?
The market size is estimated to be USD 977.7 million as of 2022.
5. What are some drivers contributing to market growth?
N/A
6. What are the notable trends driving market growth?
N/A
7. Are there any restraints impacting market growth?
N/A
8. Can you provide examples of recent developments in the market?
N/A
9. What pricing options are available for accessing the report?
Pricing options include single-user, multi-user, and enterprise licenses priced at USD 5900.00, USD 8850.00, and USD 11800.00 respectively.
10. Is the market size provided in terms of value or volume?
The market size is provided in terms of value, measured in million.
11. Are there any specific market keywords associated with the report?
Yes, the market keyword associated with the report is "Natural and Synthetic Graphite," which aids in identifying and referencing the specific market segment covered.
12. How do I determine which pricing option suits my needs best?
The pricing options vary based on user requirements and access needs. Individual users may opt for single-user licenses, while businesses requiring broader access may choose multi-user or enterprise licenses for cost-effective access to the report.
13. Are there any additional resources or data provided in the Natural and Synthetic Graphite report?
While the report offers comprehensive insights, it's advisable to review the specific contents or supplementary materials provided to ascertain if additional resources or data are available.
14. How can I stay updated on further developments or reports in the Natural and Synthetic Graphite?
To stay informed about further developments, trends, and reports in the Natural and Synthetic Graphite, consider subscribing to industry newsletters, following relevant companies and organizations, or regularly checking reputable industry news sources and publications.
Methodology
Step 1 - Identification of Relevant Samples Size from Population Database


Step 2 - Approaches for Defining Global Market Size (Value, Volume* & Price*)

Note*: In applicable scenarios
Step 3 - Data Sources
Primary Research
- Web Analytics
- Survey Reports
- Research Institute
- Latest Research Reports
- Opinion Leaders
Secondary Research
- Annual Reports
- White Paper
- Latest Press Release
- Industry Association
- Paid Database
- Investor Presentations

Step 4 - Data Triangulation
Involves using different sources of information in order to increase the validity of a study
These sources are likely to be stakeholders in a program - participants, other researchers, program staff, other community members, and so on.
Then we put all data in single framework & apply various statistical tools to find out the dynamic on the market.
During the analysis stage, feedback from the stakeholder groups would be compared to determine areas of agreement as well as areas of divergence


