

Key Insights
The Native Collagen Supplements market is poised for substantial growth, projected to reach an estimated $234.26 million in 2025 with a robust CAGR of 8.27% through 2033. This expansion is fueled by a growing consumer understanding of collagen's multifaceted benefits, extending beyond traditional skincare to encompass joint health, gut wellness, and muscle recovery. The increasing prevalence of lifestyle-related health concerns and an aging global population are significant drivers, propelling demand for these supplements as a proactive health and wellness solution. Furthermore, the rising popularity of functional foods and beverages is creating new avenues for native collagen integration, offering consumers convenient ways to incorporate this vital protein into their daily routines. Innovations in sourcing and processing are also contributing to market dynamism, ensuring higher bioavailability and product efficacy, which in turn builds consumer trust and encourages repeat purchases.
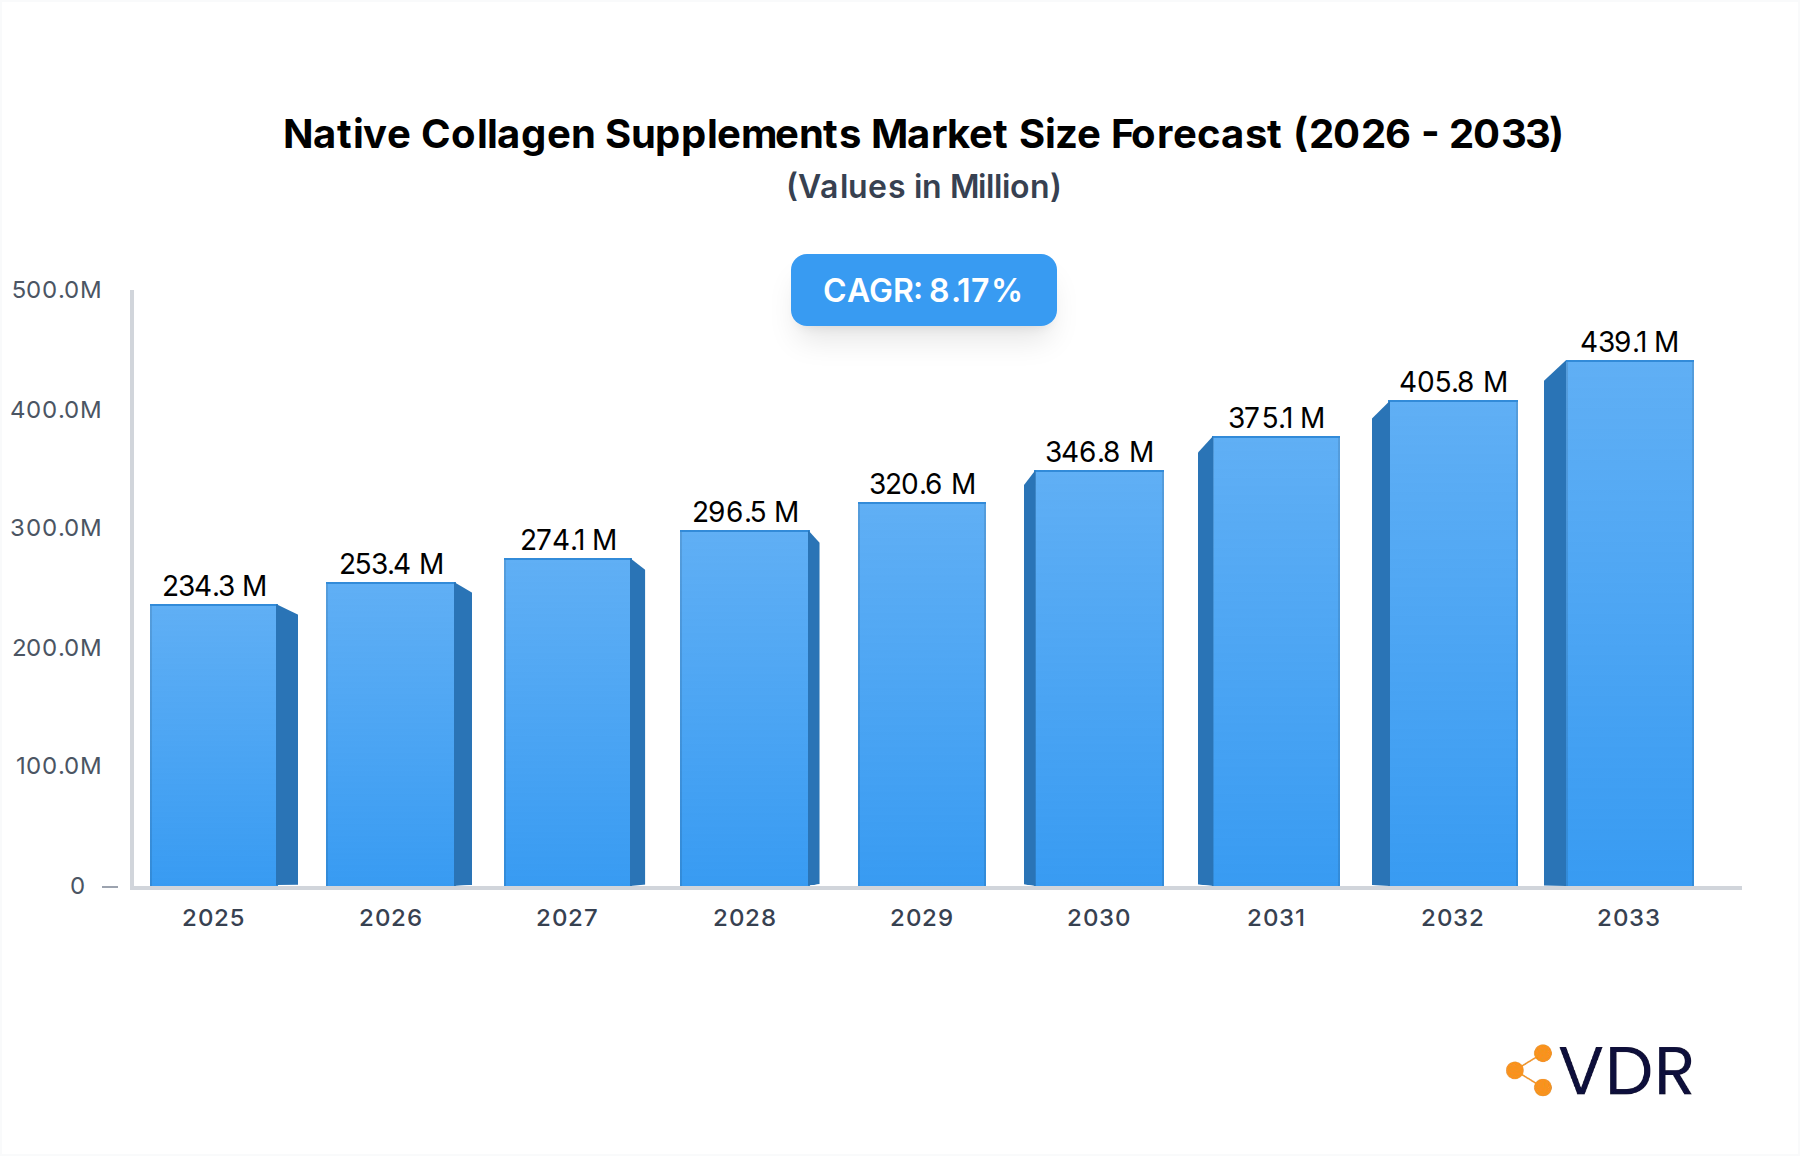
Native Collagen Supplements Market Size (In Million)
The market segmentation reflects a diverse range of applications and product types catering to varied consumer needs. Nutritional products, including protein powders and bars, alongside snacks and cereals, represent key application areas where native collagen is being increasingly incorporated to enhance nutritional profiles. Dairy products and beverages are also witnessing a surge in collagen-fortified offerings, aligning with the trend towards convenient, health-conscious consumables. While Type I collagen supplements dominate due to their widespread association with skin and connective tissue health, there is a growing interest in Type II, III, and V/X collagen supplements, each offering specific benefits for joint health, muscle repair, and cellular regeneration. Leading companies are actively investing in research and development to expand their product portfolios and capitalize on these evolving consumer preferences, ensuring a dynamic and competitive market landscape.

Native Collagen Supplements Company Market Share
Native Collagen Supplements Market Dynamics & Structure
The native collagen supplements market is characterized by a highly fragmented landscape, featuring a blend of established global players and emerging niche brands. This dynamic environment is driven by continuous technological innovation, particularly in extraction and purification techniques, ensuring higher bioavailability and efficacy. Regulatory frameworks are becoming increasingly stringent, focusing on product safety and labeling accuracy, which influences manufacturing processes and market entry for new entrants. Competitive product substitutes, such as plant-based protein alternatives and other joint health supplements, pose a significant challenge, necessitating ongoing product differentiation and value proposition refinement. End-user demographics are expanding beyond traditional fitness enthusiasts to encompass a broader health-conscious consumer base, including aging populations and those seeking dermatological benefits. Mergers and acquisitions (M&A) trends indicate a consolidation phase, with larger entities acquiring smaller, innovative companies to gain market share and technological expertise.
- Market Concentration: Moderately fragmented with increasing M&A activity.
- Technological Innovation Drivers: Advanced extraction, peptide hydrolysis, and bioavailability enhancement technologies.
- Regulatory Frameworks: Emerging stricter guidelines for efficacy claims and ingredient purity.
- Competitive Product Substitutes: Plant-based proteins, hyaluronic acid, glucosamine, chondroitin.
- End-User Demographics: Expanding from athletes to aging population, beauty-conscious consumers, and general wellness seekers.
- M&A Trends: Strategic acquisitions of innovative startups by larger corporations.
Native Collagen Supplements Growth Trends & Insights
The native collagen supplements market is poised for substantial expansion, projecting a robust Compound Annual Growth Rate (CAGR) of 12.5% from 2025 to 2033. This growth trajectory is underpinned by escalating consumer awareness regarding the multifaceted health benefits of collagen, encompassing joint health, skin elasticity, hair strength, and gut wellness. During the historical period (2019–2024), the market witnessed steady adoption, driven by initial interest from athletes and the beauty industry. The base year of 2025 marks a significant inflection point, with increased research validating collagen's efficacy and a surge in product availability across various formats. Adoption rates are accelerating, particularly in North America and Europe, as consumers actively seek preventative health solutions. Technological disruptions, such as the development of highly bioavailable peptide forms and novel delivery systems like powders, capsules, and functional beverages, are further fueling market penetration. Consumer behavior shifts are evident, with a growing preference for sustainably sourced, transparently manufactured, and scientifically backed collagen products. This trend is prompting manufacturers to invest in advanced sourcing and processing techniques, contributing to a projected market size of $7,500 million by 2025, with a further expansion to $18,250 million by 2033. The increasing integration of collagen into daily routines, from morning smoothies to specialized skincare formulations, indicates a deepening market penetration and a strong appetite for continued innovation and product diversification. Furthermore, the rising disposable incomes in emerging economies are expected to unlock new consumer segments, widening the market's reach and reinforcing its growth momentum. The growing influence of social media and wellness influencers also plays a pivotal role in disseminating information and driving demand for collagen-based products, solidifying its position as a leading dietary supplement.
Dominant Regions, Countries, or Segments in Native Collagen Supplements
The North American region currently stands as the dominant force in the native collagen supplements market, driven by a confluence of factors including high consumer disposable income, a well-established wellness culture, and a proactive approach to preventative healthcare. Within North America, the United States spearheads this dominance, accounting for an estimated 45% of the global market share in 2025. This leadership is further amplified by robust retail infrastructure, a significant presence of key industry players like Glanbia PLC, The Bountiful Company, and The Clorox Company (through its acquisition of Renew +), and extensive marketing efforts that have successfully educated consumers on the benefits of collagen.
From an application perspective, Nutritional Products represent the largest and most dynamic segment, projected to capture approximately 35% of the market by 2025. This segment encompasses a wide array of products, including powders, capsules, and gummies, catering to a broad consumer base seeking general health and wellness support. The ease of integration into daily diets and the perceived efficacy of these formats contribute to their widespread appeal.
In terms of product type, Type I Collagen Supplements lead the market, holding an estimated 50% share in 2025. This dominance stems from Type I collagen's prevalence in the human body and its well-documented benefits for skin, bones, and connective tissues, aligning with the primary health concerns of a significant portion of the consumer base.
Emerging economies, particularly in the Asia-Pacific region, are exhibiting the fastest growth rates, driven by increasing awareness, rising middle-class populations, and a growing demand for anti-aging and beauty-enhancing products. Countries like China and South Korea are rapidly expanding their domestic production and consumption, presenting significant future growth potential and attracting substantial investment.
- Dominant Region: North America (led by the United States).
- Key Country Drivers (US): High disposable income, strong wellness culture, advanced retail, major industry players.
- Dominant Application Segment: Nutritional Products.
- Nutritional Products Drivers: Versatile formats (powders, capsules, gummies), ease of consumption, general wellness focus.
- Dominant Type Segment: Type I Collagen Supplements.
- Type I Collagen Drivers: Ubiquitous in the body, scientifically backed benefits for skin, bones, and connective tissue.
- Fastest Growing Region: Asia-Pacific (especially China and South Korea).
- Asia-Pacific Growth Drivers: Rising awareness, expanding middle class, demand for anti-aging and beauty products.
Native Collagen Supplements Product Landscape
The native collagen supplements product landscape is characterized by a relentless drive for enhanced efficacy and consumer convenience. Innovations are centered on improving bioavailability through advanced peptide technologies and enzymatic hydrolysis, ensuring that consumers derive maximum benefit from each dose. Product formats have diversified significantly, moving beyond traditional capsules and powders to include collagen-infused beverages, functional snacks, and even ready-to-mix formulations tailored for specific health goals, such as bone support or hair growth. Manufacturers are also increasingly focusing on the sourcing of collagen, emphasizing grass-fed, pasture-raised, and marine-based origins to cater to ethical and health-conscious consumers. Performance metrics are being rigorously evaluated through clinical trials, providing a stronger scientific backing for product claims and differentiating brands in a competitive market. Unique selling propositions often revolve around ingredient purity, the absence of common allergens, and the combination of collagen with complementary ingredients like hyaluronic acid and vitamin C to amplify synergistic effects.
Key Drivers, Barriers & Challenges in Native Collagen Supplements
Key Drivers:
- Growing Consumer Awareness: Increasing understanding of collagen's health benefits for skin, joints, and overall wellness.
- Aging Global Population: Rising demand from an aging demographic seeking joint support and anti-aging solutions.
- Rising Disposable Incomes: Enhanced purchasing power in both developed and emerging economies.
- Technological Advancements: Development of more bioavailable collagen peptides and diverse product formats.
- Positive Scientific Research: Continued studies validating collagen's efficacy in various health applications.
Barriers & Challenges:
- Regulatory Scrutiny: Evolving regulations regarding health claims and ingredient sourcing, requiring rigorous compliance.
- Supply Chain Volatility: Dependence on animal by-products can lead to price fluctuations and availability issues.
- Competition from Alternatives: Intense competition from plant-based proteins and other functional supplements.
- Consumer Skepticism: The need for clear, scientifically substantiated evidence to overcome skepticism about effectiveness.
- Ethical Sourcing Concerns: Growing consumer demand for ethically sourced and sustainable ingredients, posing a challenge for some manufacturers.
Emerging Opportunities in Native Collagen Supplements
Emerging opportunities in the native collagen supplements market lie in the expansion of personalized nutrition, the development of novel delivery systems for enhanced absorption, and the exploration of collagen's therapeutic applications beyond general wellness. Untapped markets in developing economies with a burgeoning middle class present significant growth potential. Innovative applications, such as collagen integration into medical devices for wound healing or its use in advanced cosmetic formulations, offer lucrative avenues. Evolving consumer preferences for clean-label products, sustainable sourcing, and scientifically validated benefits are driving demand for premium, transparently manufactured collagen supplements. The rise of the "beauty from within" trend also opens doors for specialized collagen products targeting hair, skin, and nail health, with a focus on unique ingredient blends and targeted delivery.
Growth Accelerators in the Native Collagen Supplements Industry
The native collagen supplements industry is experiencing significant growth acceleration fueled by several key catalysts. Technological breakthroughs in peptide synthesis and encapsulation techniques are yielding more potent and easily absorbed collagen forms, directly enhancing product efficacy and consumer satisfaction. Strategic partnerships between supplement manufacturers, food and beverage companies, and even pharmaceutical entities are creating synergistic opportunities for product innovation and wider market penetration, such as incorporating collagen into functional foods and drinks. Furthermore, proactive market expansion strategies by key players into under-penetrated geographical regions, coupled with targeted marketing campaigns that highlight scientific backing and tangible health benefits, are effectively converting interest into sustained demand. The increasing accessibility of these products through diverse distribution channels, including online retail, pharmacies, and health food stores, further amplifies their reach and contribution to overall market growth.
Key Players Shaping the Native Collagen Supplements Market
- Further
- Glanbia PLC
- Hunter & Gather Foods
- Optimum Nutrition
- The Bountiful Company
- The Clorox Company
- Shiseido Company Limited
- Amorepacific Corporation
- The Protein Drinks
- Asterism Healthcare
- Hangzhou Nutrition Biotechnology
- Aneva Nutraceuticals
- Bottled Science
- Bauer Nutrition USA
- Wilmar Sugar
Notable Milestones in Native Collagen Supplements Sector
- 2019: Increased research publications on the bioavailability and effectiveness of hydrolyzed collagen peptides.
- 2020: Growing consumer interest in at-home wellness and beauty routines, boosting collagen supplement sales.
- 2021: Launch of innovative collagen-infused beverages and functional snacks targeting broader consumer appeal.
- 2022: Expansion of marine collagen sources to cater to pescatarian and ethical consumer demands.
- 2023: Significant investment in clinical trials to substantiate product claims and enhance scientific credibility.
- 2024: Emergence of personalized collagen formulations based on individual health needs and genetic profiles.
In-Depth Native Collagen Supplements Market Outlook
The future outlook for the native collagen supplements market is exceptionally bright, driven by an intensified focus on preventative health, the burgeoning demand for anti-aging solutions, and continued advancements in product science. Growth accelerators, including the development of novel delivery mechanisms that enhance absorption and the expansion into previously untapped emerging markets, will be pivotal. Strategic collaborations between ingredient suppliers, manufacturers, and retailers are expected to streamline supply chains and broaden product accessibility. The increasing consumer preference for transparent labeling and ethically sourced ingredients will push manufacturers towards greater sustainability and traceability. As research continues to unveil the extensive benefits of collagen, its integration into mainstream health and wellness regimes will solidify, projecting sustained high growth rates and significant market expansion in the coming years, with a predicted market valuation of over $18,000 million by 2033.
Native Collagen Supplements Segmentation
-
1. Application
- 1.1. Nutritional Products
- 1.2. Snacks & Cereals
- 1.3. Dairy Products
- 1.4. Beverages
- 1.5. Meat & Poultry
- 1.6. Other
-
2. Type
- 2.1. Type I Collagen Supplements
- 2.2. Type II Collagen Supplements
- 2.3. Type III Collagen Supplements
- 2.4. Type V/X Collagen Supplements
Native Collagen Supplements Segmentation By Geography
-
1. North America
- 1.1. United States
- 1.2. Canada
- 1.3. Mexico
-
2. South America
- 2.1. Brazil
- 2.2. Argentina
- 2.3. Rest of South America
-
3. Europe
- 3.1. United Kingdom
- 3.2. Germany
- 3.3. France
- 3.4. Italy
- 3.5. Spain
- 3.6. Russia
- 3.7. Benelux
- 3.8. Nordics
- 3.9. Rest of Europe
-
4. Middle East & Africa
- 4.1. Turkey
- 4.2. Israel
- 4.3. GCC
- 4.4. North Africa
- 4.5. South Africa
- 4.6. Rest of Middle East & Africa
-
5. Asia Pacific
- 5.1. China
- 5.2. India
- 5.3. Japan
- 5.4. South Korea
- 5.5. ASEAN
- 5.6. Oceania
- 5.7. Rest of Asia Pacific
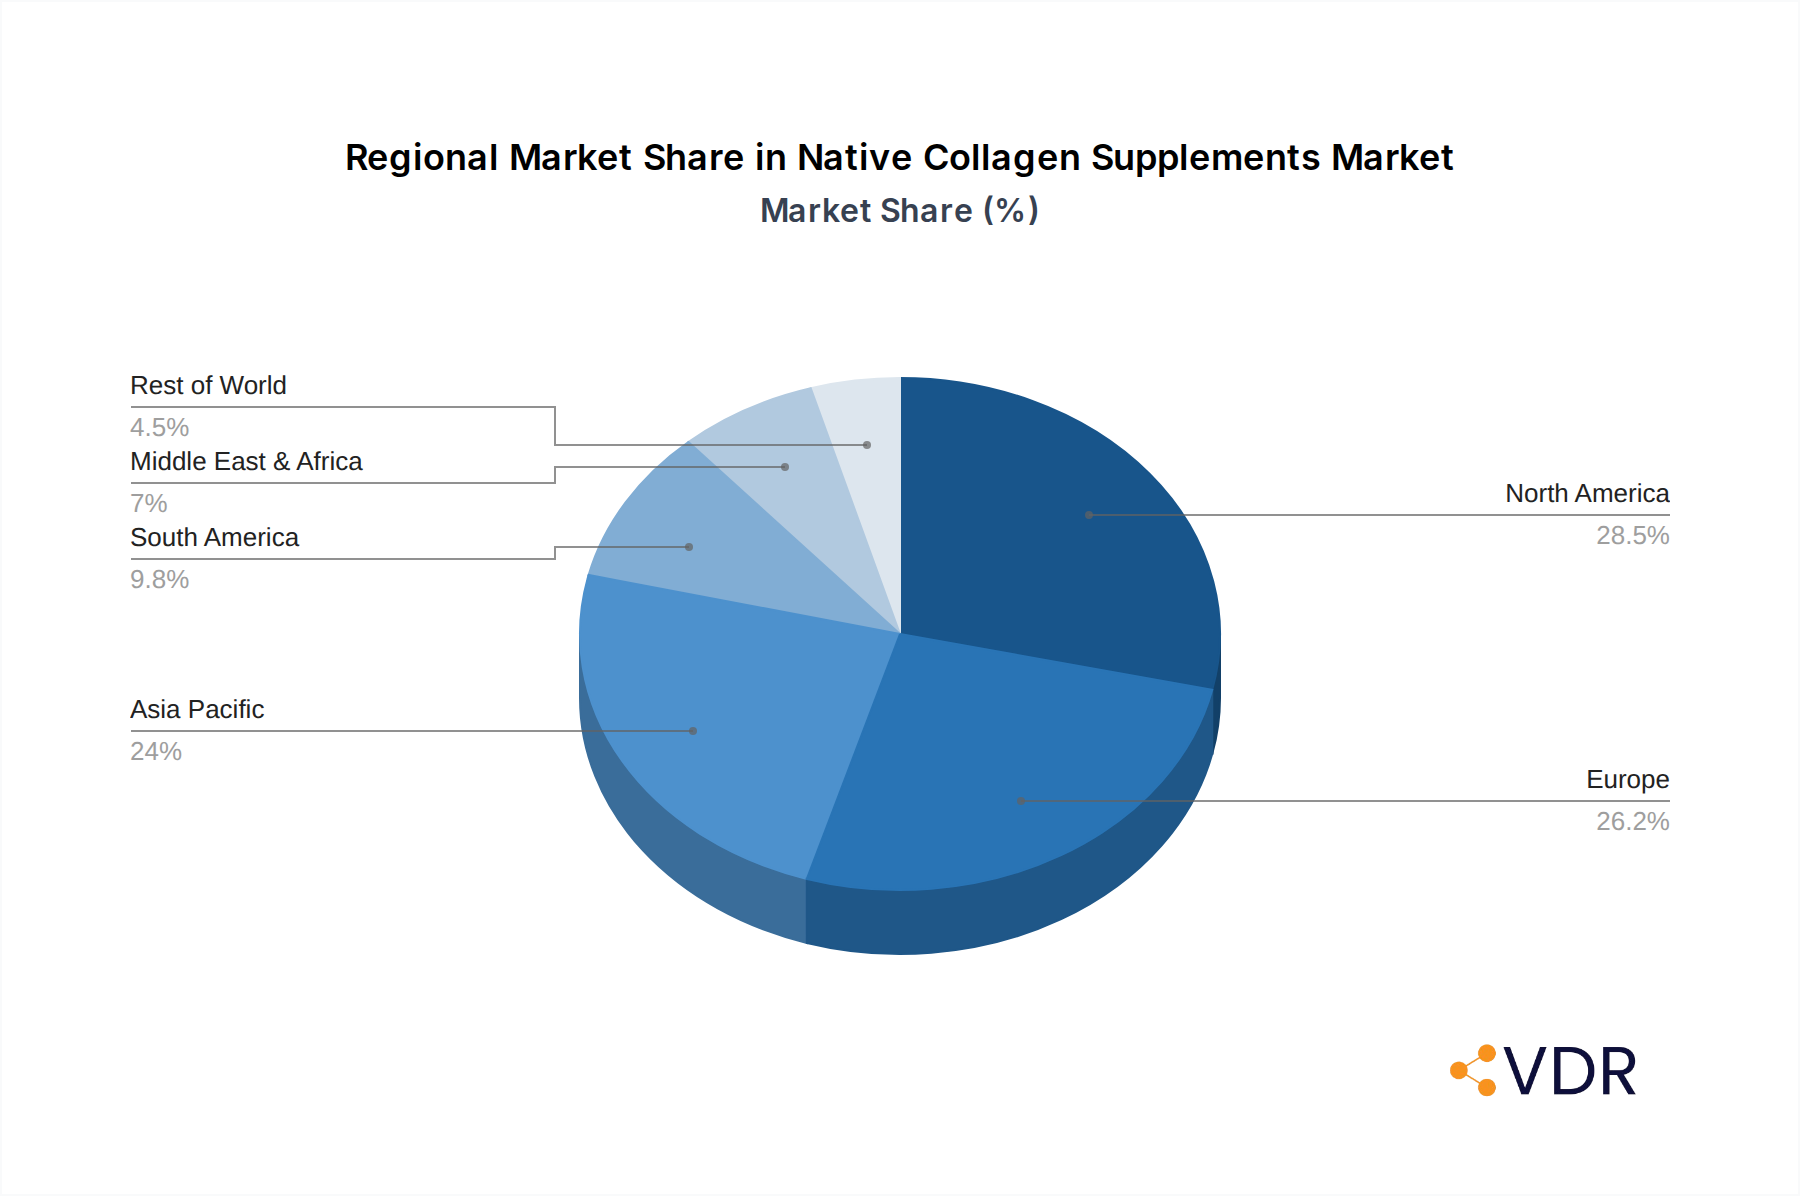
Native Collagen Supplements Regional Market Share
Geographic Coverage of Native Collagen Supplements
Native Collagen Supplements REPORT HIGHLIGHTS
| Aspects | Details |
|---|---|
| Study Period | 2020-2034 |
| Base Year | 2025 |
| Estimated Year | 2026 |
| Forecast Period | 2026-2034 |
| Historical Period | 2020-2025 |
| Growth Rate | CAGR of 8.27% from 2020-2034 |
| Segmentation |
|
Table of Contents
- 1. Introduction
- 1.1. Research Scope
- 1.2. Market Segmentation
- 1.3. Research Methodology
- 1.4. Definitions and Assumptions
- 2. Executive Summary
- 2.1. Introduction
- 3. Market Dynamics
- 3.1. Introduction
- 3.2. Market Drivers
- 3.3. Market Restrains
- 3.4. Market Trends
- 4. Market Factor Analysis
- 4.1. Porters Five Forces
- 4.2. Supply/Value Chain
- 4.3. PESTEL analysis
- 4.4. Market Entropy
- 4.5. Patent/Trademark Analysis
- 5. Global Native Collagen Supplements Analysis, Insights and Forecast, 2020-2032
- 5.1. Market Analysis, Insights and Forecast - by Application
- 5.1.1. Nutritional Products
- 5.1.2. Snacks & Cereals
- 5.1.3. Dairy Products
- 5.1.4. Beverages
- 5.1.5. Meat & Poultry
- 5.1.6. Other
- 5.2. Market Analysis, Insights and Forecast - by Type
- 5.2.1. Type I Collagen Supplements
- 5.2.2. Type II Collagen Supplements
- 5.2.3. Type III Collagen Supplements
- 5.2.4. Type V/X Collagen Supplements
- 5.3. Market Analysis, Insights and Forecast - by Region
- 5.3.1. North America
- 5.3.2. South America
- 5.3.3. Europe
- 5.3.4. Middle East & Africa
- 5.3.5. Asia Pacific
- 5.1. Market Analysis, Insights and Forecast - by Application
- 6. North America Native Collagen Supplements Analysis, Insights and Forecast, 2020-2032
- 6.1. Market Analysis, Insights and Forecast - by Application
- 6.1.1. Nutritional Products
- 6.1.2. Snacks & Cereals
- 6.1.3. Dairy Products
- 6.1.4. Beverages
- 6.1.5. Meat & Poultry
- 6.1.6. Other
- 6.2. Market Analysis, Insights and Forecast - by Type
- 6.2.1. Type I Collagen Supplements
- 6.2.2. Type II Collagen Supplements
- 6.2.3. Type III Collagen Supplements
- 6.2.4. Type V/X Collagen Supplements
- 6.1. Market Analysis, Insights and Forecast - by Application
- 7. South America Native Collagen Supplements Analysis, Insights and Forecast, 2020-2032
- 7.1. Market Analysis, Insights and Forecast - by Application
- 7.1.1. Nutritional Products
- 7.1.2. Snacks & Cereals
- 7.1.3. Dairy Products
- 7.1.4. Beverages
- 7.1.5. Meat & Poultry
- 7.1.6. Other
- 7.2. Market Analysis, Insights and Forecast - by Type
- 7.2.1. Type I Collagen Supplements
- 7.2.2. Type II Collagen Supplements
- 7.2.3. Type III Collagen Supplements
- 7.2.4. Type V/X Collagen Supplements
- 7.1. Market Analysis, Insights and Forecast - by Application
- 8. Europe Native Collagen Supplements Analysis, Insights and Forecast, 2020-2032
- 8.1. Market Analysis, Insights and Forecast - by Application
- 8.1.1. Nutritional Products
- 8.1.2. Snacks & Cereals
- 8.1.3. Dairy Products
- 8.1.4. Beverages
- 8.1.5. Meat & Poultry
- 8.1.6. Other
- 8.2. Market Analysis, Insights and Forecast - by Type
- 8.2.1. Type I Collagen Supplements
- 8.2.2. Type II Collagen Supplements
- 8.2.3. Type III Collagen Supplements
- 8.2.4. Type V/X Collagen Supplements
- 8.1. Market Analysis, Insights and Forecast - by Application
- 9. Middle East & Africa Native Collagen Supplements Analysis, Insights and Forecast, 2020-2032
- 9.1. Market Analysis, Insights and Forecast - by Application
- 9.1.1. Nutritional Products
- 9.1.2. Snacks & Cereals
- 9.1.3. Dairy Products
- 9.1.4. Beverages
- 9.1.5. Meat & Poultry
- 9.1.6. Other
- 9.2. Market Analysis, Insights and Forecast - by Type
- 9.2.1. Type I Collagen Supplements
- 9.2.2. Type II Collagen Supplements
- 9.2.3. Type III Collagen Supplements
- 9.2.4. Type V/X Collagen Supplements
- 9.1. Market Analysis, Insights and Forecast - by Application
- 10. Asia Pacific Native Collagen Supplements Analysis, Insights and Forecast, 2020-2032
- 10.1. Market Analysis, Insights and Forecast - by Application
- 10.1.1. Nutritional Products
- 10.1.2. Snacks & Cereals
- 10.1.3. Dairy Products
- 10.1.4. Beverages
- 10.1.5. Meat & Poultry
- 10.1.6. Other
- 10.2. Market Analysis, Insights and Forecast - by Type
- 10.2.1. Type I Collagen Supplements
- 10.2.2. Type II Collagen Supplements
- 10.2.3. Type III Collagen Supplements
- 10.2.4. Type V/X Collagen Supplements
- 10.1. Market Analysis, Insights and Forecast - by Application
- 11. Competitive Analysis
- 11.1. Global Market Share Analysis 2025
- 11.2. Company Profiles
- 11.2.1 Further
- 11.2.1.1. Overview
- 11.2.1.2. Products
- 11.2.1.3. SWOT Analysis
- 11.2.1.4. Recent Developments
- 11.2.1.5. Financials (Based on Availability)
- 11.2.2 Glanbia PLC
- 11.2.2.1. Overview
- 11.2.2.2. Products
- 11.2.2.3. SWOT Analysis
- 11.2.2.4. Recent Developments
- 11.2.2.5. Financials (Based on Availability)
- 11.2.3 Hunter & Gather Foods
- 11.2.3.1. Overview
- 11.2.3.2. Products
- 11.2.3.3. SWOT Analysis
- 11.2.3.4. Recent Developments
- 11.2.3.5. Financials (Based on Availability)
- 11.2.4 Optimum Nutrition
- 11.2.4.1. Overview
- 11.2.4.2. Products
- 11.2.4.3. SWOT Analysis
- 11.2.4.4. Recent Developments
- 11.2.4.5. Financials (Based on Availability)
- 11.2.5 The Bountiful Company
- 11.2.5.1. Overview
- 11.2.5.2. Products
- 11.2.5.3. SWOT Analysis
- 11.2.5.4. Recent Developments
- 11.2.5.5. Financials (Based on Availability)
- 11.2.6 The Clorox Company
- 11.2.6.1. Overview
- 11.2.6.2. Products
- 11.2.6.3. SWOT Analysis
- 11.2.6.4. Recent Developments
- 11.2.6.5. Financials (Based on Availability)
- 11.2.7 Shiseido Company Limited
- 11.2.7.1. Overview
- 11.2.7.2. Products
- 11.2.7.3. SWOT Analysis
- 11.2.7.4. Recent Developments
- 11.2.7.5. Financials (Based on Availability)
- 11.2.8 Amorepacific Corporation
- 11.2.8.1. Overview
- 11.2.8.2. Products
- 11.2.8.3. SWOT Analysis
- 11.2.8.4. Recent Developments
- 11.2.8.5. Financials (Based on Availability)
- 11.2.9 The Protein Drinks
- 11.2.9.1. Overview
- 11.2.9.2. Products
- 11.2.9.3. SWOT Analysis
- 11.2.9.4. Recent Developments
- 11.2.9.5. Financials (Based on Availability)
- 11.2.10 Asterism Healthcare
- 11.2.10.1. Overview
- 11.2.10.2. Products
- 11.2.10.3. SWOT Analysis
- 11.2.10.4. Recent Developments
- 11.2.10.5. Financials (Based on Availability)
- 11.2.11 Hangzhou Nutrition Biotechnology
- 11.2.11.1. Overview
- 11.2.11.2. Products
- 11.2.11.3. SWOT Analysis
- 11.2.11.4. Recent Developments
- 11.2.11.5. Financials (Based on Availability)
- 11.2.12 Aneva Nutraceuticals
- 11.2.12.1. Overview
- 11.2.12.2. Products
- 11.2.12.3. SWOT Analysis
- 11.2.12.4. Recent Developments
- 11.2.12.5. Financials (Based on Availability)
- 11.2.13 Bottled Science
- 11.2.13.1. Overview
- 11.2.13.2. Products
- 11.2.13.3. SWOT Analysis
- 11.2.13.4. Recent Developments
- 11.2.13.5. Financials (Based on Availability)
- 11.2.14 Bauer Nutrition USA
- 11.2.14.1. Overview
- 11.2.14.2. Products
- 11.2.14.3. SWOT Analysis
- 11.2.14.4. Recent Developments
- 11.2.14.5. Financials (Based on Availability)
- 11.2.15 Wilmar Sugar
- 11.2.15.1. Overview
- 11.2.15.2. Products
- 11.2.15.3. SWOT Analysis
- 11.2.15.4. Recent Developments
- 11.2.15.5. Financials (Based on Availability)
- 11.2.1 Further
List of Figures
- Figure 1: Global Native Collagen Supplements Revenue Breakdown (undefined, %) by Region 2025 & 2033
- Figure 2: Global Native Collagen Supplements Volume Breakdown (K, %) by Region 2025 & 2033
- Figure 3: North America Native Collagen Supplements Revenue (undefined), by Application 2025 & 2033
- Figure 4: North America Native Collagen Supplements Volume (K), by Application 2025 & 2033
- Figure 5: North America Native Collagen Supplements Revenue Share (%), by Application 2025 & 2033
- Figure 6: North America Native Collagen Supplements Volume Share (%), by Application 2025 & 2033
- Figure 7: North America Native Collagen Supplements Revenue (undefined), by Type 2025 & 2033
- Figure 8: North America Native Collagen Supplements Volume (K), by Type 2025 & 2033
- Figure 9: North America Native Collagen Supplements Revenue Share (%), by Type 2025 & 2033
- Figure 10: North America Native Collagen Supplements Volume Share (%), by Type 2025 & 2033
- Figure 11: North America Native Collagen Supplements Revenue (undefined), by Country 2025 & 2033
- Figure 12: North America Native Collagen Supplements Volume (K), by Country 2025 & 2033
- Figure 13: North America Native Collagen Supplements Revenue Share (%), by Country 2025 & 2033
- Figure 14: North America Native Collagen Supplements Volume Share (%), by Country 2025 & 2033
- Figure 15: South America Native Collagen Supplements Revenue (undefined), by Application 2025 & 2033
- Figure 16: South America Native Collagen Supplements Volume (K), by Application 2025 & 2033
- Figure 17: South America Native Collagen Supplements Revenue Share (%), by Application 2025 & 2033
- Figure 18: South America Native Collagen Supplements Volume Share (%), by Application 2025 & 2033
- Figure 19: South America Native Collagen Supplements Revenue (undefined), by Type 2025 & 2033
- Figure 20: South America Native Collagen Supplements Volume (K), by Type 2025 & 2033
- Figure 21: South America Native Collagen Supplements Revenue Share (%), by Type 2025 & 2033
- Figure 22: South America Native Collagen Supplements Volume Share (%), by Type 2025 & 2033
- Figure 23: South America Native Collagen Supplements Revenue (undefined), by Country 2025 & 2033
- Figure 24: South America Native Collagen Supplements Volume (K), by Country 2025 & 2033
- Figure 25: South America Native Collagen Supplements Revenue Share (%), by Country 2025 & 2033
- Figure 26: South America Native Collagen Supplements Volume Share (%), by Country 2025 & 2033
- Figure 27: Europe Native Collagen Supplements Revenue (undefined), by Application 2025 & 2033
- Figure 28: Europe Native Collagen Supplements Volume (K), by Application 2025 & 2033
- Figure 29: Europe Native Collagen Supplements Revenue Share (%), by Application 2025 & 2033
- Figure 30: Europe Native Collagen Supplements Volume Share (%), by Application 2025 & 2033
- Figure 31: Europe Native Collagen Supplements Revenue (undefined), by Type 2025 & 2033
- Figure 32: Europe Native Collagen Supplements Volume (K), by Type 2025 & 2033
- Figure 33: Europe Native Collagen Supplements Revenue Share (%), by Type 2025 & 2033
- Figure 34: Europe Native Collagen Supplements Volume Share (%), by Type 2025 & 2033
- Figure 35: Europe Native Collagen Supplements Revenue (undefined), by Country 2025 & 2033
- Figure 36: Europe Native Collagen Supplements Volume (K), by Country 2025 & 2033
- Figure 37: Europe Native Collagen Supplements Revenue Share (%), by Country 2025 & 2033
- Figure 38: Europe Native Collagen Supplements Volume Share (%), by Country 2025 & 2033
- Figure 39: Middle East & Africa Native Collagen Supplements Revenue (undefined), by Application 2025 & 2033
- Figure 40: Middle East & Africa Native Collagen Supplements Volume (K), by Application 2025 & 2033
- Figure 41: Middle East & Africa Native Collagen Supplements Revenue Share (%), by Application 2025 & 2033
- Figure 42: Middle East & Africa Native Collagen Supplements Volume Share (%), by Application 2025 & 2033
- Figure 43: Middle East & Africa Native Collagen Supplements Revenue (undefined), by Type 2025 & 2033
- Figure 44: Middle East & Africa Native Collagen Supplements Volume (K), by Type 2025 & 2033
- Figure 45: Middle East & Africa Native Collagen Supplements Revenue Share (%), by Type 2025 & 2033
- Figure 46: Middle East & Africa Native Collagen Supplements Volume Share (%), by Type 2025 & 2033
- Figure 47: Middle East & Africa Native Collagen Supplements Revenue (undefined), by Country 2025 & 2033
- Figure 48: Middle East & Africa Native Collagen Supplements Volume (K), by Country 2025 & 2033
- Figure 49: Middle East & Africa Native Collagen Supplements Revenue Share (%), by Country 2025 & 2033
- Figure 50: Middle East & Africa Native Collagen Supplements Volume Share (%), by Country 2025 & 2033
- Figure 51: Asia Pacific Native Collagen Supplements Revenue (undefined), by Application 2025 & 2033
- Figure 52: Asia Pacific Native Collagen Supplements Volume (K), by Application 2025 & 2033
- Figure 53: Asia Pacific Native Collagen Supplements Revenue Share (%), by Application 2025 & 2033
- Figure 54: Asia Pacific Native Collagen Supplements Volume Share (%), by Application 2025 & 2033
- Figure 55: Asia Pacific Native Collagen Supplements Revenue (undefined), by Type 2025 & 2033
- Figure 56: Asia Pacific Native Collagen Supplements Volume (K), by Type 2025 & 2033
- Figure 57: Asia Pacific Native Collagen Supplements Revenue Share (%), by Type 2025 & 2033
- Figure 58: Asia Pacific Native Collagen Supplements Volume Share (%), by Type 2025 & 2033
- Figure 59: Asia Pacific Native Collagen Supplements Revenue (undefined), by Country 2025 & 2033
- Figure 60: Asia Pacific Native Collagen Supplements Volume (K), by Country 2025 & 2033
- Figure 61: Asia Pacific Native Collagen Supplements Revenue Share (%), by Country 2025 & 2033
- Figure 62: Asia Pacific Native Collagen Supplements Volume Share (%), by Country 2025 & 2033
List of Tables
- Table 1: Global Native Collagen Supplements Revenue undefined Forecast, by Application 2020 & 2033
- Table 2: Global Native Collagen Supplements Volume K Forecast, by Application 2020 & 2033
- Table 3: Global Native Collagen Supplements Revenue undefined Forecast, by Type 2020 & 2033
- Table 4: Global Native Collagen Supplements Volume K Forecast, by Type 2020 & 2033
- Table 5: Global Native Collagen Supplements Revenue undefined Forecast, by Region 2020 & 2033
- Table 6: Global Native Collagen Supplements Volume K Forecast, by Region 2020 & 2033
- Table 7: Global Native Collagen Supplements Revenue undefined Forecast, by Application 2020 & 2033
- Table 8: Global Native Collagen Supplements Volume K Forecast, by Application 2020 & 2033
- Table 9: Global Native Collagen Supplements Revenue undefined Forecast, by Type 2020 & 2033
- Table 10: Global Native Collagen Supplements Volume K Forecast, by Type 2020 & 2033
- Table 11: Global Native Collagen Supplements Revenue undefined Forecast, by Country 2020 & 2033
- Table 12: Global Native Collagen Supplements Volume K Forecast, by Country 2020 & 2033
- Table 13: United States Native Collagen Supplements Revenue (undefined) Forecast, by Application 2020 & 2033
- Table 14: United States Native Collagen Supplements Volume (K) Forecast, by Application 2020 & 2033
- Table 15: Canada Native Collagen Supplements Revenue (undefined) Forecast, by Application 2020 & 2033
- Table 16: Canada Native Collagen Supplements Volume (K) Forecast, by Application 2020 & 2033
- Table 17: Mexico Native Collagen Supplements Revenue (undefined) Forecast, by Application 2020 & 2033
- Table 18: Mexico Native Collagen Supplements Volume (K) Forecast, by Application 2020 & 2033
- Table 19: Global Native Collagen Supplements Revenue undefined Forecast, by Application 2020 & 2033
- Table 20: Global Native Collagen Supplements Volume K Forecast, by Application 2020 & 2033
- Table 21: Global Native Collagen Supplements Revenue undefined Forecast, by Type 2020 & 2033
- Table 22: Global Native Collagen Supplements Volume K Forecast, by Type 2020 & 2033
- Table 23: Global Native Collagen Supplements Revenue undefined Forecast, by Country 2020 & 2033
- Table 24: Global Native Collagen Supplements Volume K Forecast, by Country 2020 & 2033
- Table 25: Brazil Native Collagen Supplements Revenue (undefined) Forecast, by Application 2020 & 2033
- Table 26: Brazil Native Collagen Supplements Volume (K) Forecast, by Application 2020 & 2033
- Table 27: Argentina Native Collagen Supplements Revenue (undefined) Forecast, by Application 2020 & 2033
- Table 28: Argentina Native Collagen Supplements Volume (K) Forecast, by Application 2020 & 2033
- Table 29: Rest of South America Native Collagen Supplements Revenue (undefined) Forecast, by Application 2020 & 2033
- Table 30: Rest of South America Native Collagen Supplements Volume (K) Forecast, by Application 2020 & 2033
- Table 31: Global Native Collagen Supplements Revenue undefined Forecast, by Application 2020 & 2033
- Table 32: Global Native Collagen Supplements Volume K Forecast, by Application 2020 & 2033
- Table 33: Global Native Collagen Supplements Revenue undefined Forecast, by Type 2020 & 2033
- Table 34: Global Native Collagen Supplements Volume K Forecast, by Type 2020 & 2033
- Table 35: Global Native Collagen Supplements Revenue undefined Forecast, by Country 2020 & 2033
- Table 36: Global Native Collagen Supplements Volume K Forecast, by Country 2020 & 2033
- Table 37: United Kingdom Native Collagen Supplements Revenue (undefined) Forecast, by Application 2020 & 2033
- Table 38: United Kingdom Native Collagen Supplements Volume (K) Forecast, by Application 2020 & 2033
- Table 39: Germany Native Collagen Supplements Revenue (undefined) Forecast, by Application 2020 & 2033
- Table 40: Germany Native Collagen Supplements Volume (K) Forecast, by Application 2020 & 2033
- Table 41: France Native Collagen Supplements Revenue (undefined) Forecast, by Application 2020 & 2033
- Table 42: France Native Collagen Supplements Volume (K) Forecast, by Application 2020 & 2033
- Table 43: Italy Native Collagen Supplements Revenue (undefined) Forecast, by Application 2020 & 2033
- Table 44: Italy Native Collagen Supplements Volume (K) Forecast, by Application 2020 & 2033
- Table 45: Spain Native Collagen Supplements Revenue (undefined) Forecast, by Application 2020 & 2033
- Table 46: Spain Native Collagen Supplements Volume (K) Forecast, by Application 2020 & 2033
- Table 47: Russia Native Collagen Supplements Revenue (undefined) Forecast, by Application 2020 & 2033
- Table 48: Russia Native Collagen Supplements Volume (K) Forecast, by Application 2020 & 2033
- Table 49: Benelux Native Collagen Supplements Revenue (undefined) Forecast, by Application 2020 & 2033
- Table 50: Benelux Native Collagen Supplements Volume (K) Forecast, by Application 2020 & 2033
- Table 51: Nordics Native Collagen Supplements Revenue (undefined) Forecast, by Application 2020 & 2033
- Table 52: Nordics Native Collagen Supplements Volume (K) Forecast, by Application 2020 & 2033
- Table 53: Rest of Europe Native Collagen Supplements Revenue (undefined) Forecast, by Application 2020 & 2033
- Table 54: Rest of Europe Native Collagen Supplements Volume (K) Forecast, by Application 2020 & 2033
- Table 55: Global Native Collagen Supplements Revenue undefined Forecast, by Application 2020 & 2033
- Table 56: Global Native Collagen Supplements Volume K Forecast, by Application 2020 & 2033
- Table 57: Global Native Collagen Supplements Revenue undefined Forecast, by Type 2020 & 2033
- Table 58: Global Native Collagen Supplements Volume K Forecast, by Type 2020 & 2033
- Table 59: Global Native Collagen Supplements Revenue undefined Forecast, by Country 2020 & 2033
- Table 60: Global Native Collagen Supplements Volume K Forecast, by Country 2020 & 2033
- Table 61: Turkey Native Collagen Supplements Revenue (undefined) Forecast, by Application 2020 & 2033
- Table 62: Turkey Native Collagen Supplements Volume (K) Forecast, by Application 2020 & 2033
- Table 63: Israel Native Collagen Supplements Revenue (undefined) Forecast, by Application 2020 & 2033
- Table 64: Israel Native Collagen Supplements Volume (K) Forecast, by Application 2020 & 2033
- Table 65: GCC Native Collagen Supplements Revenue (undefined) Forecast, by Application 2020 & 2033
- Table 66: GCC Native Collagen Supplements Volume (K) Forecast, by Application 2020 & 2033
- Table 67: North Africa Native Collagen Supplements Revenue (undefined) Forecast, by Application 2020 & 2033
- Table 68: North Africa Native Collagen Supplements Volume (K) Forecast, by Application 2020 & 2033
- Table 69: South Africa Native Collagen Supplements Revenue (undefined) Forecast, by Application 2020 & 2033
- Table 70: South Africa Native Collagen Supplements Volume (K) Forecast, by Application 2020 & 2033
- Table 71: Rest of Middle East & Africa Native Collagen Supplements Revenue (undefined) Forecast, by Application 2020 & 2033
- Table 72: Rest of Middle East & Africa Native Collagen Supplements Volume (K) Forecast, by Application 2020 & 2033
- Table 73: Global Native Collagen Supplements Revenue undefined Forecast, by Application 2020 & 2033
- Table 74: Global Native Collagen Supplements Volume K Forecast, by Application 2020 & 2033
- Table 75: Global Native Collagen Supplements Revenue undefined Forecast, by Type 2020 & 2033
- Table 76: Global Native Collagen Supplements Volume K Forecast, by Type 2020 & 2033
- Table 77: Global Native Collagen Supplements Revenue undefined Forecast, by Country 2020 & 2033
- Table 78: Global Native Collagen Supplements Volume K Forecast, by Country 2020 & 2033
- Table 79: China Native Collagen Supplements Revenue (undefined) Forecast, by Application 2020 & 2033
- Table 80: China Native Collagen Supplements Volume (K) Forecast, by Application 2020 & 2033
- Table 81: India Native Collagen Supplements Revenue (undefined) Forecast, by Application 2020 & 2033
- Table 82: India Native Collagen Supplements Volume (K) Forecast, by Application 2020 & 2033
- Table 83: Japan Native Collagen Supplements Revenue (undefined) Forecast, by Application 2020 & 2033
- Table 84: Japan Native Collagen Supplements Volume (K) Forecast, by Application 2020 & 2033
- Table 85: South Korea Native Collagen Supplements Revenue (undefined) Forecast, by Application 2020 & 2033
- Table 86: South Korea Native Collagen Supplements Volume (K) Forecast, by Application 2020 & 2033
- Table 87: ASEAN Native Collagen Supplements Revenue (undefined) Forecast, by Application 2020 & 2033
- Table 88: ASEAN Native Collagen Supplements Volume (K) Forecast, by Application 2020 & 2033
- Table 89: Oceania Native Collagen Supplements Revenue (undefined) Forecast, by Application 2020 & 2033
- Table 90: Oceania Native Collagen Supplements Volume (K) Forecast, by Application 2020 & 2033
- Table 91: Rest of Asia Pacific Native Collagen Supplements Revenue (undefined) Forecast, by Application 2020 & 2033
- Table 92: Rest of Asia Pacific Native Collagen Supplements Volume (K) Forecast, by Application 2020 & 2033
Frequently Asked Questions
1. What is the projected Compound Annual Growth Rate (CAGR) of the Native Collagen Supplements?
The projected CAGR is approximately 8.27%.
2. Which companies are prominent players in the Native Collagen Supplements?
Key companies in the market include Further, Glanbia PLC, Hunter & Gather Foods, Optimum Nutrition, The Bountiful Company, The Clorox Company, Shiseido Company Limited, Amorepacific Corporation, The Protein Drinks, Asterism Healthcare, Hangzhou Nutrition Biotechnology, Aneva Nutraceuticals, Bottled Science, Bauer Nutrition USA, Wilmar Sugar.
3. What are the main segments of the Native Collagen Supplements?
The market segments include Application, Type.
4. Can you provide details about the market size?
The market size is estimated to be USD XXX N/A as of 2022.
5. What are some drivers contributing to market growth?
N/A
6. What are the notable trends driving market growth?
N/A
7. Are there any restraints impacting market growth?
N/A
8. Can you provide examples of recent developments in the market?
N/A
9. What pricing options are available for accessing the report?
Pricing options include single-user, multi-user, and enterprise licenses priced at USD 3950.00, USD 5925.00, and USD 7900.00 respectively.
10. Is the market size provided in terms of value or volume?
The market size is provided in terms of value, measured in N/A and volume, measured in K.
11. Are there any specific market keywords associated with the report?
Yes, the market keyword associated with the report is "Native Collagen Supplements," which aids in identifying and referencing the specific market segment covered.
12. How do I determine which pricing option suits my needs best?
The pricing options vary based on user requirements and access needs. Individual users may opt for single-user licenses, while businesses requiring broader access may choose multi-user or enterprise licenses for cost-effective access to the report.
13. Are there any additional resources or data provided in the Native Collagen Supplements report?
While the report offers comprehensive insights, it's advisable to review the specific contents or supplementary materials provided to ascertain if additional resources or data are available.
14. How can I stay updated on further developments or reports in the Native Collagen Supplements?
To stay informed about further developments, trends, and reports in the Native Collagen Supplements, consider subscribing to industry newsletters, following relevant companies and organizations, or regularly checking reputable industry news sources and publications.
Methodology
Step 1 - Identification of Relevant Samples Size from Population Database


Step 2 - Approaches for Defining Global Market Size (Value, Volume* & Price*)

Note*: In applicable scenarios
Step 3 - Data Sources
Primary Research
- Web Analytics
- Survey Reports
- Research Institute
- Latest Research Reports
- Opinion Leaders
Secondary Research
- Annual Reports
- White Paper
- Latest Press Release
- Industry Association
- Paid Database
- Investor Presentations

Step 4 - Data Triangulation
Involves using different sources of information in order to increase the validity of a study
These sources are likely to be stakeholders in a program - participants, other researchers, program staff, other community members, and so on.
Then we put all data in single framework & apply various statistical tools to find out the dynamic on the market.
During the analysis stage, feedback from the stakeholder groups would be compared to determine areas of agreement as well as areas of divergence