

Key Insights
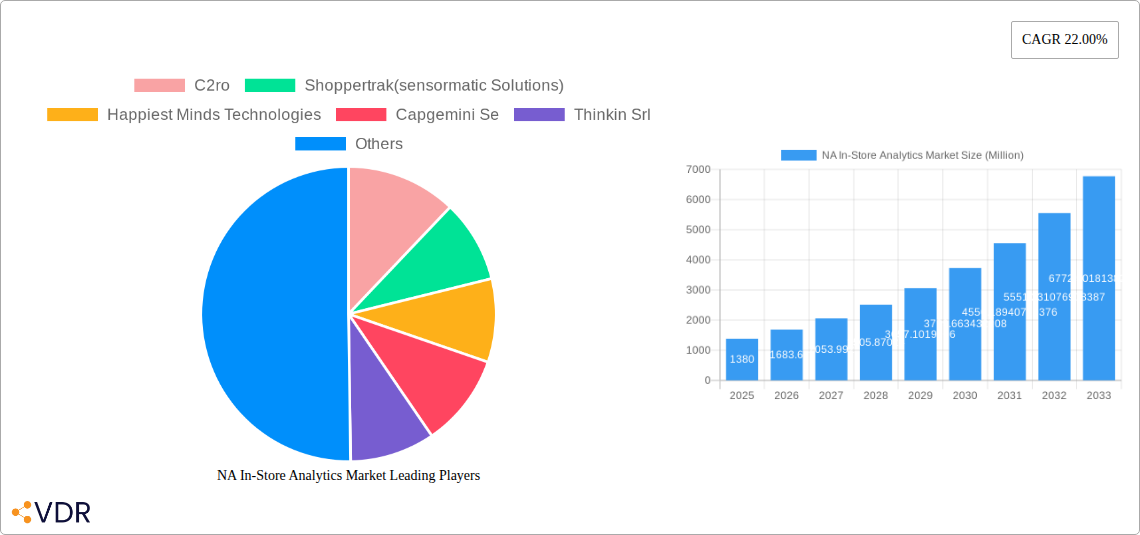
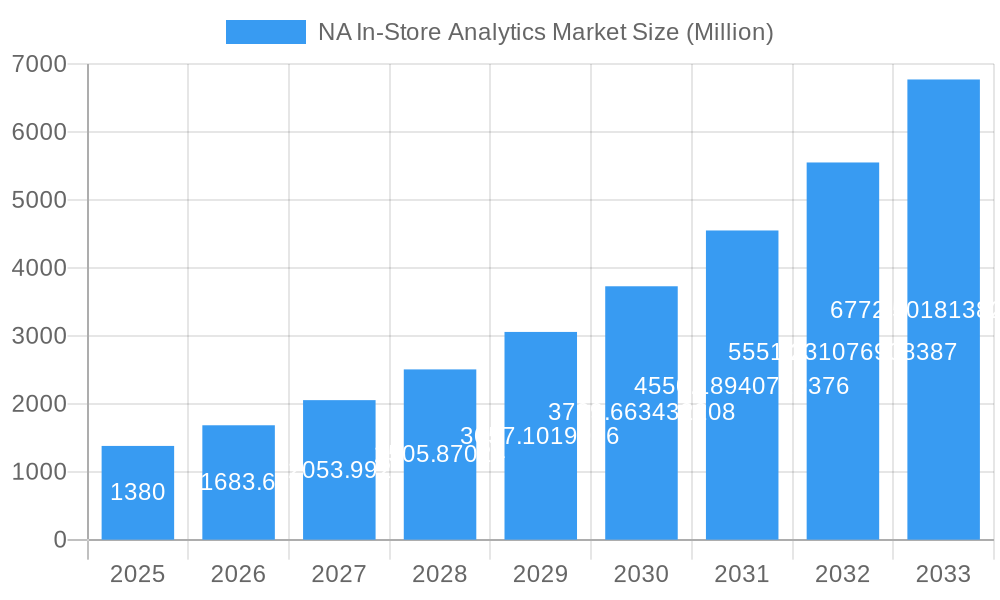
The North American (NA) In-Store Analytics Market is poised for remarkable expansion, driven by the escalating need for retailers to understand intricate customer behavior and optimize store operations. With an estimated market size of USD 1.38 Billion in 2025, the sector is projected to witness a phenomenal CAGR of 22.00% over the forecast period of 2025-2033. This robust growth is fueled by retailers' increasing adoption of advanced technologies like AI, IoT, and machine learning to gain a competitive edge. Key market drivers include the demand for enhanced customer experience, personalized marketing strategies, improved inventory management, and streamlined store layouts. The proliferation of sophisticated in-store analytics solutions enables businesses to transform raw data into actionable insights, leading to better decision-making, increased sales, and optimized operational efficiency.
NA In-Store Analytics Market Market Size (In Billion)
The market's dynamism is further accentuated by the diverse range of applications and segments it caters to. From customer management and risk compliance to marketing and merchandising, in-store analytics offers a comprehensive suite of solutions for retail businesses of all sizes, from large enterprises to small and medium-sized businesses. Both cloud-based and on-premise deployment models are gaining traction, providing flexibility to meet varied IT infrastructures and security requirements. The North American region, encompassing the United States, Canada, and Mexico, is a frontrunner in adopting these technologies, owing to a mature retail landscape, high disposable incomes, and a proactive approach to technological innovation. Key players are continuously investing in research and development to offer more sophisticated and integrated solutions, thereby shaping the future of brick-and-mortar retail.
NA In-Store Analytics Market Company Market Share
NA In-Store Analytics Market: Unlocking Retail Potential with Data-Driven Insights
This comprehensive report provides an in-depth analysis of the North American In-Store Analytics Market, a crucial sector for retailers seeking to optimize operations, enhance customer experiences, and drive revenue growth. The market encompasses the strategic deployment of technologies and services to collect, analyze, and act upon data generated within physical retail environments. We explore the intricate dynamics of this parent market, including its key child markets such as retail shelf intelligence, customer behavior analytics, and operational efficiency tools. With a focus on high-traffic keywords like "retail analytics," "in-store technology," "customer insights," and "store optimization," this report is designed to attract and inform industry professionals, investors, and solution providers navigating this rapidly evolving landscape. All values are presented in Million units.
NA In-Store Analytics Market Market Dynamics & Structure
The North American In-Store Analytics Market is characterized by a dynamic and evolving competitive landscape, driven by continuous technological innovation. While market concentration is present among established players, there is also significant room for disruptive solutions. Key drivers include the increasing demand for personalized customer experiences, the need to combat showrooming, and the imperative to optimize inventory management. Regulatory frameworks, primarily concerning data privacy and consumer consent (e.g., GDPR, CCPA), play a crucial role in shaping market strategies and product development. Competitive product substitutes include manual data collection methods and less sophisticated analytics tools, but the sophistication and real-time insights offered by dedicated in-store analytics solutions are increasingly differentiating them. End-user demographics span across all retail sectors, from large hypermarkets and department stores to specialized boutiques and convenience stores, each with unique analytical needs. Mergers and acquisitions (M&A) are a prevalent trend as larger players seek to consolidate market share and acquire innovative technologies or customer bases. For instance, the integration of shelf intelligence solutions into broader analytics platforms signifies a strategic move to offer comprehensive in-store visibility.
- Market Concentration: Moderate, with key players holding significant market share but also space for niche providers.
- Technological Innovation Drivers: AI/ML for predictive analytics, IoT sensors for real-time data capture, computer vision for behavior analysis, and cloud computing for scalable data processing.
- Regulatory Frameworks: Data privacy laws, consumer protection regulations, and industry-specific compliance requirements.
- Competitive Product Substitutes: Manual data collection, basic POS data analysis, traditional footfall counters.
- End-User Demographics: Broad, including apparel, electronics, grocery, home improvement, and specialty retail.
- M&A Trends: Active, with acquisitions focused on expanding capabilities, market reach, and technological portfolios.
NA In-Store Analytics Market Growth Trends & Insights
The NA In-Store Analytics Market is poised for substantial growth, projected to witness a Compound Annual Growth Rate (CAGR) of xx% during the forecast period of 2025–2033. This expansion is fueled by the transformative power of data in the retail sector. Retailers are increasingly recognizing that granular, in-store insights are no longer a luxury but a necessity for survival and growth in a competitive market. The adoption rates of in-store analytics solutions are rapidly increasing, driven by a deeper understanding of their ROI and the tangible benefits they deliver. Technological disruptions, such as the advent of sophisticated AI-powered computer vision for analyzing customer movement and engagement, and the proliferation of IoT devices for hyper-accurate inventory tracking, are fundamentally reshaping the in-store analytics landscape. Consumer behavior shifts, including the expectation of personalized interactions and seamless shopping journeys, are compelling retailers to invest in solutions that can decipher these nuanced preferences. The market size is expected to grow from an estimated $XX million in 2025 to $YY million by 2033. Key adoption drivers include the desire to improve store layout, optimize product placement, enhance staffing decisions, and personalize marketing efforts at the point of sale. The integration of online and offline data streams, often referred to as omnichannel analytics, is also a significant trend, providing a holistic view of customer journeys. The increasing use of mobile devices within stores for product research and price comparison further necessitates advanced analytics to understand shopper intent and influence purchasing decisions.
- Market Size Evolution: From $XX million in 2025 to $YY million by 2033.
- CAGR: xx% during the forecast period (2025–2033).
- Adoption Rates: Steadily increasing across all retail segments due to demonstrated ROI and competitive pressures.
- Technological Disruptions: AI/ML for predictive analytics, computer vision for behavior analysis, IoT for real-time inventory, and advanced data visualization tools.
- Consumer Behavior Shifts: Demand for personalization, seamless omnichannel experiences, and data-driven recommendations.
- Market Penetration: High in large enterprises, with increasing penetration in the Small and Medium Enterprises (SME) segment.
Dominant Regions, Countries, or Segments in NA In-Store Analytics Market
Within the North American In-Store Analytics Market, the United States consistently emerges as the dominant country, driven by its large retail footprint, high adoption of advanced technologies, and a strong entrepreneurial spirit in developing innovative solutions. The Component: Software segment also holds a leading position, as sophisticated analytics platforms and AI-powered tools form the core of effective in-store analysis. The Deployment: Cloud model is increasingly preferred due to its scalability, flexibility, and cost-effectiveness, allowing retailers to access powerful analytics without significant upfront infrastructure investments. In terms of Organization Size, Large Enterprises represent the most significant market share, owing to their substantial budgets, complex operational needs, and a greater propensity to invest in cutting-edge technologies. The Application: Store Operation Management is a primary driver of growth, with retailers prioritizing efficiency, labor optimization, and inventory accuracy to improve profitability. Furthermore, Marketing and Merchandising applications are also gaining substantial traction as brands leverage in-store data to personalize promotions, optimize product placement, and enhance shopper engagement. The robust economic policies, significant investments in retail technology, and a large consumer base contribute to the United States' leadership. Key drivers for the dominance of software include the development of advanced algorithms for customer behavior prediction, sentiment analysis, and real-time performance monitoring. The widespread availability of cloud infrastructure and the increasing comfort of businesses with cloud-based solutions solidify its leading deployment model. Large enterprises, with their extensive store networks and vast amounts of transactional data, are natural early adopters and significant investors in comprehensive in-store analytics solutions. The immediate impact on operational efficiency and marketing effectiveness makes store operation management and marketing/merchandising the most sought-after applications.
- Dominant Country: United States, owing to its extensive retail market and technological adoption.
- Leading Component: Software, comprising analytics platforms, AI/ML models, and data visualization tools.
- Preferred Deployment: Cloud, offering scalability, accessibility, and reduced IT overhead.
- Largest Organization Size: Large Enterprises, due to substantial investment capacity and complex needs.
- Primary Application: Store Operation Management, focusing on efficiency, inventory, and labor optimization.
- Emerging Application: Marketing and Merchandising, driven by personalization and shopper engagement demands.
NA In-Store Analytics Market Product Landscape
The NA In-Store Analytics Market product landscape is characterized by a continuous stream of innovations aimed at providing deeper and more actionable insights. Solutions range from AI-powered video analytics that track customer footfall, dwell times, and pathing, to sophisticated sensor networks for real-time inventory management and shelf availability monitoring. Leading products offer unique selling propositions such as real-time anomaly detection in stock levels, sentiment analysis of customer interactions captured through audio or video, and predictive modeling for staffing needs. Technological advancements include the integration of edge computing for faster on-site data processing and advanced machine learning algorithms for hyper-personalization of in-store offers.
Key Drivers, Barriers & Challenges in NA In-Store Analytics Market
Key Drivers:
- Enhanced Customer Experience: The demand for personalized shopping journeys and improved service levels.
- Operational Efficiency: Optimizing inventory, staffing, and store layout to reduce costs and increase productivity.
- Data-Driven Decision Making: Shifting from intuition to evidence-based strategies for merchandising and marketing.
- Competitive Pressure: The need to keep pace with data-savvy competitors and evolving retail trends.
- Technological Advancements: Accessibility of AI, ML, IoT, and cloud computing enabling more sophisticated solutions.
Barriers & Challenges:
- Data Privacy Concerns: Navigating complex regulations and ensuring consumer trust regarding data collection.
- Integration Complexity: Integrating new analytics solutions with existing legacy systems can be challenging and costly.
- Cost of Implementation: Significant upfront investment in hardware, software, and training can be a barrier for some retailers.
- Talent Gap: A shortage of skilled data scientists and analysts capable of leveraging these complex tools.
- Scalability Issues: Ensuring solutions can effectively scale across multiple store locations and handle increasing data volumes.
Emerging Opportunities in NA In-Store Analytics Market
Emerging opportunities within the NA In-Store Analytics Market lie in the hyper-personalization of the in-store experience through AI-driven recommendations and dynamic pricing. The integration of augmented reality (AR) for product visualization and interactive store navigation presents another significant avenue. Furthermore, the untapped potential in smaller retail formats and independent businesses, offering them more accessible and tailored analytics solutions, represents a burgeoning market. The increasing focus on sustainability and ethical sourcing also opens doors for analytics that track and report on supply chain transparency and waste reduction within stores.
Growth Accelerators in the NA In-Store Analytics Market Industry
Several catalysts are accelerating the growth of the NA In-Store Analytics Market. Technological breakthroughs in AI and machine learning are continuously enhancing the accuracy and predictive capabilities of analytics platforms. Strategic partnerships between technology providers and retail associations or consulting firms are expanding market reach and adoption. Furthermore, market expansion strategies by vendors targeting specific retail verticals or geographical sub-regions are driving sustained growth. The ongoing digital transformation in retail, coupled with the post-pandemic acceleration of technology adoption, is creating a fertile ground for these accelerators.
Key Players Shaping the NA In-Store Analytics Market Market
- C2ro
- Shoppertrak (Sensormatic Solutions)
- Happiest Minds Technologies
- Capgemini SE
- Thinkin Srl
- Retailnext Inc
- Cisco Meraki (Cisco Systems Inc)
- Cloud4wi Inc
- Capillary Technologies
- Amoobi
- Analytiks AI
- SAP SE
- Trax Image Recognition
Notable Milestones in NA In-Store Analytics Market Sector
- July 2023: Acosta and Pensa Systems partnered to enhance revenue growth for CPG retailers and brands by integrating Pensa's shelf intelligence with Acosta's analytics and merchandising solutions, offering accurate retail shelf visibility and strategic business insights.
- January 2023: Google Cloud launched four new AI technologies, including a shelf-checking AI solution built on Vertex AI Vision, to help retailers automate in-store inventory checks and improve customer shopping experiences.
In-Depth NA In-Store Analytics Market Market Outlook
The NA In-Store Analytics Market is set for continued robust expansion, driven by an unwavering commitment to data-driven retail strategies. Future market potential is anchored in the evolving capabilities of AI and ML, promising more sophisticated predictive analytics and hyper-personalized customer interactions. Strategic opportunities abound in developing integrated omnichannel solutions that seamlessly bridge the online and offline retail experiences, offering retailers a unified view of their customers. The increasing demand for real-time actionable insights will propel innovation in edge computing and advanced data visualization. As retailers continue to prioritize operational efficiency and customer satisfaction, the adoption of in-store analytics will transition from a competitive advantage to a fundamental operational necessity, ensuring sustained growth and market development.
NA In-Store Analytics Market Segmentation
-
1. Component
- 1.1. Software
- 1.2. Services
-
2. Deployment
- 2.1. Cloud
- 2.2. On-premise
-
3. Organization Size
- 3.1. Large Enterprises
- 3.2. Small and Medium Enterprises
-
4. Application
- 4.1. Customer Management
- 4.2. Risk and Compliance Management
- 4.3. Store Operation Management
- 4.4. Marketing and Merchandizing
- 4.5. Other Applications
NA In-Store Analytics Market Segmentation By Geography
-
1. North America
- 1.1. United States
- 1.2. Canada
- 1.3. Mexico
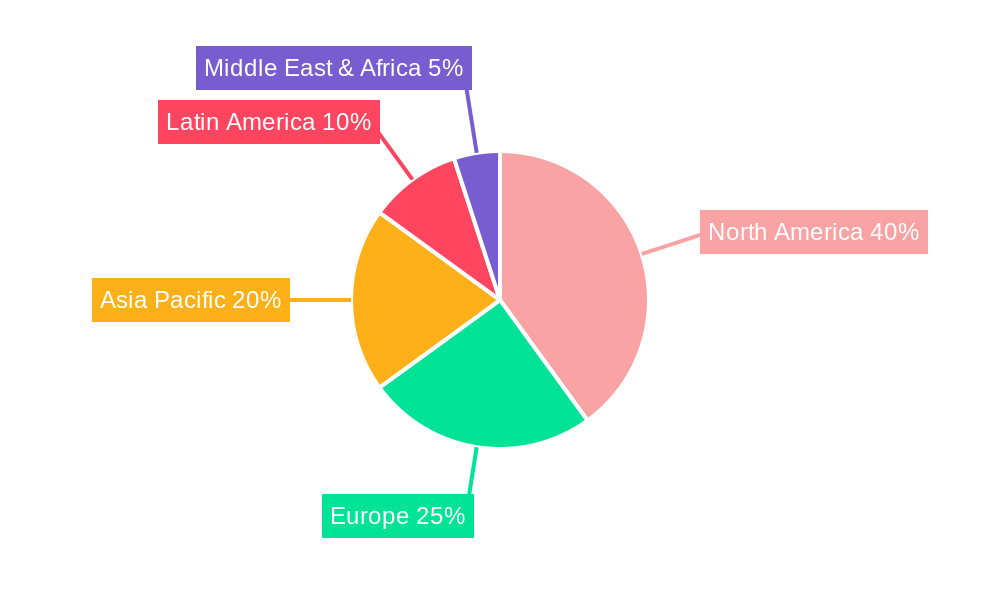
NA In-Store Analytics Market Regional Market Share
Geographic Coverage of NA In-Store Analytics Market
NA In-Store Analytics Market REPORT HIGHLIGHTS
| Aspects | Details |
|---|---|
| Study Period | 2020-2034 |
| Base Year | 2025 |
| Estimated Year | 2026 |
| Forecast Period | 2026-2034 |
| Historical Period | 2020-2025 |
| Growth Rate | CAGR of 22.00% from 2020-2034 |
| Segmentation |
|
Table of Contents
- 1. Introduction
- 1.1. Research Scope
- 1.2. Market Segmentation
- 1.3. Research Objective
- 1.4. Definitions and Assumptions
- 2. Executive Summary
- 2.1. Market Snapshot
- 3. Market Dynamics
- 3.1. Market Drivers
- 3.2. Market Restrains
- 3.3. Market Trends
- 3.4. Market Opportunities
- 4. Market Factor Analysis
- 4.1. Porters Five Forces
- 4.1.1. Bargaining Power of Suppliers
- 4.1.2. Bargaining Power of Buyers
- 4.1.3. Threat of New Entrants
- 4.1.4. Threat of Substitutes
- 4.1.5. Competitive Rivalry
- 4.2. PESTEL analysis
- 4.3. BCG Analysis
- 4.3.1. Stars (High Growth, High Market Share)
- 4.3.2. Cash Cows (Low Growth, High Market Share)
- 4.3.3. Question Mark (High Growth, Low Market Share)
- 4.3.4. Dogs (Low Growth, Low Market Share)
- 4.4. Ansoff Matrix Analysis
- 4.5. Supply Chain Analysis
- 4.6. Regulatory Landscape
- 4.7. Current Market Potential and Opportunity Assessment (TAM–SAM–SOM Framework)
- 4.8. VDR Analyst Note
- 4.1. Porters Five Forces
- 5. Market Analysis, Insights and Forecast 2021-2033
- 5.1. Market Analysis, Insights and Forecast - by Component
- 5.1.1. Software
- 5.1.2. Services
- 5.2. Market Analysis, Insights and Forecast - by Deployment
- 5.2.1. Cloud
- 5.2.2. On-premise
- 5.3. Market Analysis, Insights and Forecast - by Organization Size
- 5.3.1. Large Enterprises
- 5.3.2. Small and Medium Enterprises
- 5.4. Market Analysis, Insights and Forecast - by Application
- 5.4.1. Customer Management
- 5.4.2. Risk and Compliance Management
- 5.4.3. Store Operation Management
- 5.4.4. Marketing and Merchandizing
- 5.4.5. Other Applications
- 5.5. Market Analysis, Insights and Forecast - by Region
- 5.5.1. North America
- 5.1. Market Analysis, Insights and Forecast - by Component
- 6. NA In-Store Analytics Market Analysis, Insights and Forecast, 2021-2033
- 6.1. Market Analysis, Insights and Forecast - by Component
- 6.1.1. Software
- 6.1.2. Services
- 6.2. Market Analysis, Insights and Forecast - by Deployment
- 6.2.1. Cloud
- 6.2.2. On-premise
- 6.3. Market Analysis, Insights and Forecast - by Organization Size
- 6.3.1. Large Enterprises
- 6.3.2. Small and Medium Enterprises
- 6.4. Market Analysis, Insights and Forecast - by Application
- 6.4.1. Customer Management
- 6.4.2. Risk and Compliance Management
- 6.4.3. Store Operation Management
- 6.4.4. Marketing and Merchandizing
- 6.4.5. Other Applications
- 6.1. Market Analysis, Insights and Forecast - by Component
- 7. Competitive Analysis
- 7.1. Company Profiles
- 7.1.1 C2ro
- 7.1.1.1. Company Overview
- 7.1.1.2. Products
- 7.1.1.3. Company Financials
- 7.1.1.4. SWOT Analysis
- 7.1.2 Shoppertrak(sensormatic Solutions)
- 7.1.2.1. Company Overview
- 7.1.2.2. Products
- 7.1.2.3. Company Financials
- 7.1.2.4. SWOT Analysis
- 7.1.3 Happiest Minds Technologies
- 7.1.3.1. Company Overview
- 7.1.3.2. Products
- 7.1.3.3. Company Financials
- 7.1.3.4. SWOT Analysis
- 7.1.4 Capgemini Se
- 7.1.4.1. Company Overview
- 7.1.4.2. Products
- 7.1.4.3. Company Financials
- 7.1.4.4. SWOT Analysis
- 7.1.5 Thinkin Srl
- 7.1.5.1. Company Overview
- 7.1.5.2. Products
- 7.1.5.3. Company Financials
- 7.1.5.4. SWOT Analysis
- 7.1.6 Retailnext Inc
- 7.1.6.1. Company Overview
- 7.1.6.2. Products
- 7.1.6.3. Company Financials
- 7.1.6.4. SWOT Analysis
- 7.1.7 Cisco Meraki (Cisco Systems Inc )
- 7.1.7.1. Company Overview
- 7.1.7.2. Products
- 7.1.7.3. Company Financials
- 7.1.7.4. SWOT Analysis
- 7.1.8 Cloud4wi Inc
- 7.1.8.1. Company Overview
- 7.1.8.2. Products
- 7.1.8.3. Company Financials
- 7.1.8.4. SWOT Analysis
- 7.1.9 Capillary Technologies
- 7.1.9.1. Company Overview
- 7.1.9.2. Products
- 7.1.9.3. Company Financials
- 7.1.9.4. SWOT Analysis
- 7.1.10 Amoobi
- 7.1.10.1. Company Overview
- 7.1.10.2. Products
- 7.1.10.3. Company Financials
- 7.1.10.4. SWOT Analysis
- 7.1.11 Analytiks AI
- 7.1.11.1. Company Overview
- 7.1.11.2. Products
- 7.1.11.3. Company Financials
- 7.1.11.4. SWOT Analysis
- 7.1.12 SAP SE
- 7.1.12.1. Company Overview
- 7.1.12.2. Products
- 7.1.12.3. Company Financials
- 7.1.12.4. SWOT Analysis
- 7.1.13 Trax Image Recognition
- 7.1.13.1. Company Overview
- 7.1.13.2. Products
- 7.1.13.3. Company Financials
- 7.1.13.4. SWOT Analysis
- 7.1.1 C2ro
- 7.2. Market Entropy
- 7.2.1 Company's Key Areas Served
- 7.2.2 Recent Developments
- 7.3. Company Market Share Analysis 2025
- 7.3.1 Top 5 Companies Market Share Analysis
- 7.3.2 Top 3 Companies Market Share Analysis
- 7.4. List of Potential Customers
- 8. Research Methodology
List of Figures
- Figure 1: NA In-Store Analytics Market Revenue Breakdown (Million, %) by Product 2025 & 2033
- Figure 2: NA In-Store Analytics Market Share (%) by Company 2025
List of Tables
- Table 1: NA In-Store Analytics Market Revenue Million Forecast, by Component 2020 & 2033
- Table 2: NA In-Store Analytics Market Volume K Unit Forecast, by Component 2020 & 2033
- Table 3: NA In-Store Analytics Market Revenue Million Forecast, by Deployment 2020 & 2033
- Table 4: NA In-Store Analytics Market Volume K Unit Forecast, by Deployment 2020 & 2033
- Table 5: NA In-Store Analytics Market Revenue Million Forecast, by Organization Size 2020 & 2033
- Table 6: NA In-Store Analytics Market Volume K Unit Forecast, by Organization Size 2020 & 2033
- Table 7: NA In-Store Analytics Market Revenue Million Forecast, by Application 2020 & 2033
- Table 8: NA In-Store Analytics Market Volume K Unit Forecast, by Application 2020 & 2033
- Table 9: NA In-Store Analytics Market Revenue Million Forecast, by Region 2020 & 2033
- Table 10: NA In-Store Analytics Market Volume K Unit Forecast, by Region 2020 & 2033
- Table 11: NA In-Store Analytics Market Revenue Million Forecast, by Component 2020 & 2033
- Table 12: NA In-Store Analytics Market Volume K Unit Forecast, by Component 2020 & 2033
- Table 13: NA In-Store Analytics Market Revenue Million Forecast, by Deployment 2020 & 2033
- Table 14: NA In-Store Analytics Market Volume K Unit Forecast, by Deployment 2020 & 2033
- Table 15: NA In-Store Analytics Market Revenue Million Forecast, by Organization Size 2020 & 2033
- Table 16: NA In-Store Analytics Market Volume K Unit Forecast, by Organization Size 2020 & 2033
- Table 17: NA In-Store Analytics Market Revenue Million Forecast, by Application 2020 & 2033
- Table 18: NA In-Store Analytics Market Volume K Unit Forecast, by Application 2020 & 2033
- Table 19: NA In-Store Analytics Market Revenue Million Forecast, by Country 2020 & 2033
- Table 20: NA In-Store Analytics Market Volume K Unit Forecast, by Country 2020 & 2033
- Table 21: United States NA In-Store Analytics Market Revenue (Million) Forecast, by Application 2020 & 2033
- Table 22: United States NA In-Store Analytics Market Volume (K Unit) Forecast, by Application 2020 & 2033
- Table 23: Canada NA In-Store Analytics Market Revenue (Million) Forecast, by Application 2020 & 2033
- Table 24: Canada NA In-Store Analytics Market Volume (K Unit) Forecast, by Application 2020 & 2033
- Table 25: Mexico NA In-Store Analytics Market Revenue (Million) Forecast, by Application 2020 & 2033
- Table 26: Mexico NA In-Store Analytics Market Volume (K Unit) Forecast, by Application 2020 & 2033
Frequently Asked Questions
1. What is the projected Compound Annual Growth Rate (CAGR) of the NA In-Store Analytics Market?
The projected CAGR is approximately 22.00%.
2. Which companies are prominent players in the NA In-Store Analytics Market?
Key companies in the market include C2ro, Shoppertrak(sensormatic Solutions), Happiest Minds Technologies, Capgemini Se, Thinkin Srl, Retailnext Inc, Cisco Meraki (Cisco Systems Inc ), Cloud4wi Inc, Capillary Technologies, Amoobi, Analytiks AI, SAP SE, Trax Image Recognition.
3. What are the main segments of the NA In-Store Analytics Market?
The market segments include Component, Deployment, Organization Size, Application.
4. Can you provide details about the market size?
The market size is estimated to be USD 1.38 Million as of 2022.
5. What are some drivers contributing to market growth?
Increasing Data Volume In In-store Operations; Need For Better Customer Service And Enhanced Shopping Experience.
6. What are the notable trends driving market growth?
Store Operation Management to Exhibit Good Growth Over the Forecast Period.
7. Are there any restraints impacting market growth?
Lack of Personnel Skills.
8. Can you provide examples of recent developments in the market?
July 2023 - Acosta, an Acosta Group agency and a provider of commerce-centric solutions for the modern marketplace to retailers, brands, and foodservice providers, and Pensa Systems, a provider of digital retail shelf inventory management solutions, have partnered to boost revenue growth for CPG retailers and brands with highly accurate retail shelf visibility, strategic business insights as well as in-store execution. The shelf intelligence of the Pensa brand is being integrated into this new partnership by Acosta's analytics, in-store data collection, business intelligence, and merchandising solutions for all retailers on the market.
9. What pricing options are available for accessing the report?
Pricing options include single-user, multi-user, and enterprise licenses priced at USD 4750, USD 4950, and USD 6800 respectively.
10. Is the market size provided in terms of value or volume?
The market size is provided in terms of value, measured in Million and volume, measured in K Unit.
11. Are there any specific market keywords associated with the report?
Yes, the market keyword associated with the report is "NA In-Store Analytics Market," which aids in identifying and referencing the specific market segment covered.
12. How do I determine which pricing option suits my needs best?
The pricing options vary based on user requirements and access needs. Individual users may opt for single-user licenses, while businesses requiring broader access may choose multi-user or enterprise licenses for cost-effective access to the report.
13. Are there any additional resources or data provided in the NA In-Store Analytics Market report?
While the report offers comprehensive insights, it's advisable to review the specific contents or supplementary materials provided to ascertain if additional resources or data are available.
14. How can I stay updated on further developments or reports in the NA In-Store Analytics Market?
To stay informed about further developments, trends, and reports in the NA In-Store Analytics Market, consider subscribing to industry newsletters, following relevant companies and organizations, or regularly checking reputable industry news sources and publications.
Methodology
Step 1 - Identification of Relevant Samples Size from Population Database


Step 2 - Approaches for Defining Global Market Size (Value, Volume* & Price*)

Note*: In applicable scenarios
Step 3 - Data Sources
Primary Research
- Web Analytics
- Survey Reports
- Research Institute
- Latest Research Reports
- Opinion Leaders
Secondary Research
- Annual Reports
- White Paper
- Latest Press Release
- Industry Association
- Paid Database
- Investor Presentations

Step 4 - Data Triangulation
Involves using different sources of information in order to increase the validity of a study
These sources are likely to be stakeholders in a program - participants, other researchers, program staff, other community members, and so on.
Then we put all data in single framework & apply various statistical tools to find out the dynamic on the market.
During the analysis stage, feedback from the stakeholder groups would be compared to determine areas of agreement as well as areas of divergence