

Key Insights
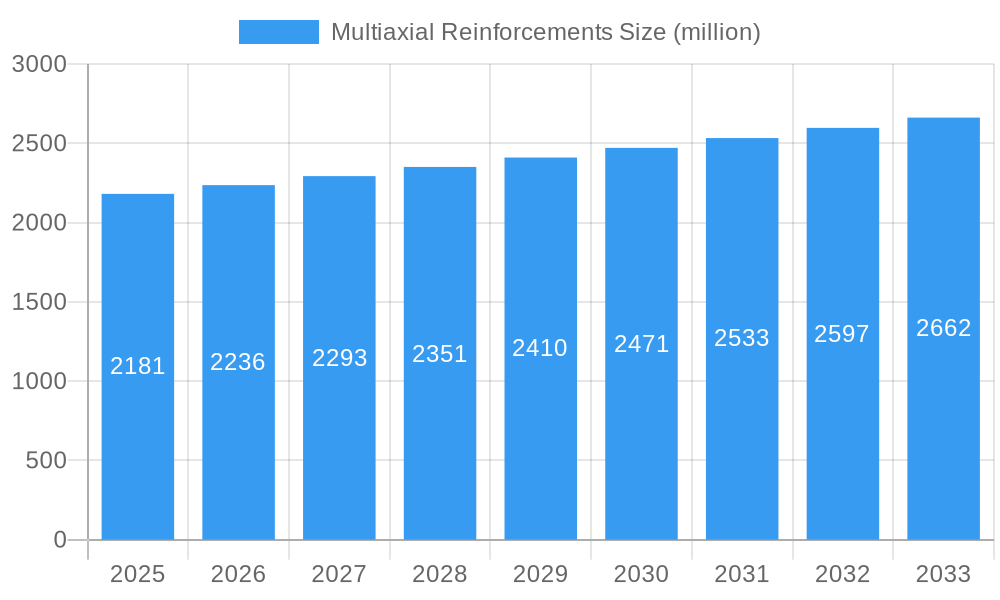
The global multiaxial reinforcements market, valued at $2181 million in 2025, is projected to experience steady growth, driven by increasing demand across key industries like aerospace, automotive, and wind energy. A compound annual growth rate (CAGR) of 2.3% from 2025 to 2033 suggests a continuous expansion, albeit at a moderate pace. This growth can be attributed to the superior mechanical properties of multiaxial fabrics, offering enhanced strength, stiffness, and dimensional stability compared to traditional unidirectional reinforcements. Furthermore, the lightweight nature of these materials is a significant advantage in applications where weight reduction is critical, such as in aircraft and electric vehicles. While the market faces some restraints, such as the relatively higher cost compared to alternative materials and the complexity involved in manufacturing processes, ongoing innovations in material science and manufacturing techniques are expected to mitigate these challenges. The market is highly fragmented, with several key players vying for market share, and regional variations in market growth will likely depend on the adoption rate in specific industries and government policies promoting lightweighting and sustainable materials.
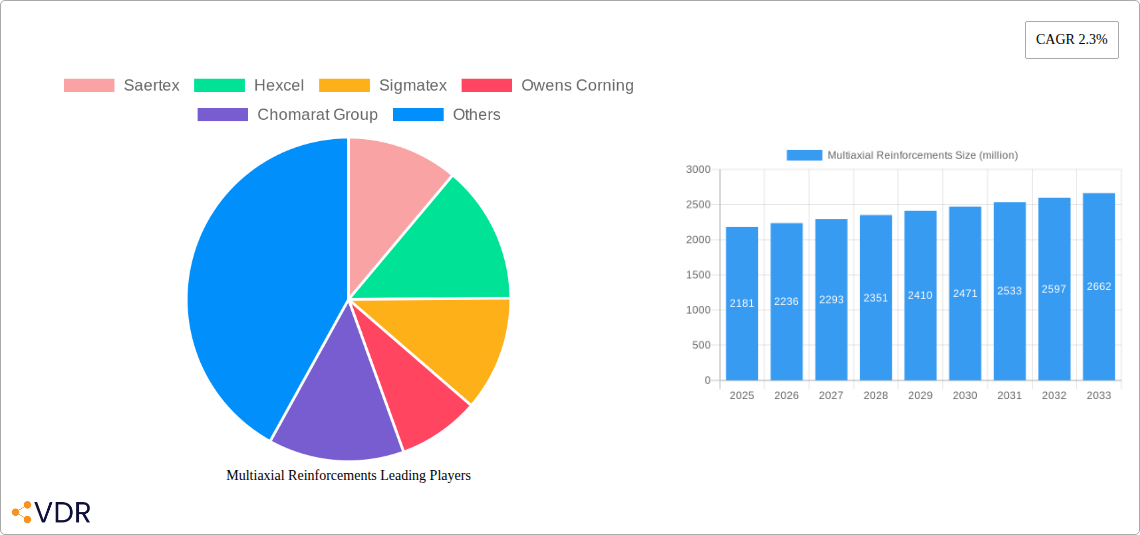
Multiaxial Reinforcements Market Size (In Billion)
The competitive landscape is characterized by both established industry giants like Owens Corning, Saint-Gobain Vetrotex, and Hexcel, and specialized manufacturers such as Saertex and Chomarat Group. These companies are engaged in continuous R&D to develop advanced multiaxial fabrics with improved performance characteristics and to expand their product portfolio to cater to the evolving needs of diverse industries. The market segmentation, although not explicitly provided, likely includes variations based on fiber type (carbon fiber, glass fiber, aramid fiber), resin system, and end-use application. Future growth will depend on factors such as technological advancements enabling further weight reduction and improved mechanical properties, expansion into emerging markets, and the continued adoption of composite materials in various industries. The projected market size in 2033 will depend on the consistency of the CAGR and any significant shifts in market dynamics.
Multiaxial Reinforcements Company Market Share
Multiaxial Reinforcements Market Report: 2019-2033
This comprehensive report provides an in-depth analysis of the Multiaxial Reinforcements market, encompassing market dynamics, growth trends, regional analysis, product landscape, key players, and future outlook. The report covers the period from 2019 to 2033, with 2025 as the base year and estimated year. The parent market is the broader composites industry, while the child market is specifically high-performance reinforcement materials. The total market size is estimated at xx million units in 2025 and is projected to reach xx million units by 2033.
Multiaxial Reinforcements Market Dynamics & Structure
This section analyzes the competitive landscape, technological advancements, regulatory influences, and market trends within the multiaxial reinforcements market. The market is moderately concentrated, with key players holding significant market share, but with numerous smaller players also contributing.
Market Concentration: The top 5 players, including Saertex, Hexcel, and Sigmatex, account for approximately xx% of the global market share in 2025. This signifies a relatively consolidated market but with opportunities for expansion and diversification for smaller players.
Technological Innovation: Continuous improvements in fiber technology (e.g., carbon fiber, aramid fiber, glass fiber), resin systems, and manufacturing processes drive innovation. Research and development investments are focused on enhancing the strength-to-weight ratio, durability, and cost-effectiveness of multiaxial reinforcements. The adoption of advanced manufacturing techniques such as automated fiber placement (AFP) and tape laying significantly influences the market.
Regulatory Frameworks: Government regulations concerning environmental sustainability and safety standards influence material composition and manufacturing processes. Regulations related to emissions and waste management are key considerations for manufacturers.
Competitive Product Substitutes: Other reinforcement materials, like unidirectional fabrics and woven fabrics, compete with multiaxial reinforcements. However, the superior performance characteristics and design flexibility of multiaxial reinforcements are expected to maintain its market dominance.
End-User Demographics: The primary end-users are in the aerospace, automotive, and wind energy sectors, driving significant demand. Growing demand for lightweight and high-strength materials in these industries fuels market growth.
M&A Trends: The past five years have witnessed xx M&A deals in the multiaxial reinforcements industry, primarily driven by strategic expansions and technology acquisitions. This consolidation trend is expected to continue, particularly among smaller players seeking to enhance their competitive positioning.
Multiaxial Reinforcements Growth Trends & Insights
The global multiaxial reinforcements market experienced significant growth during the historical period (2019-2024), primarily driven by increasing demand from the aerospace and automotive industries. The market size grew from xx million units in 2019 to xx million units in 2024, exhibiting a CAGR of xx%. The adoption rate of multiaxial reinforcements in various applications, like automotive body panels and aircraft components, significantly increased during this period, due to stringent regulations for fuel efficiency and lightweight structures. Technological advancements, like the development of more durable and high-performance materials, also boosted market growth. Consumer preference for fuel-efficient vehicles and lighter aircraft facilitated the high demand for advanced materials. Further, the increasing application of multiaxial reinforcements in wind energy is driving market expansion. The forecast period (2025-2033) projects a CAGR of xx%, driven by ongoing technological improvements and increasing applications in emerging markets. Market penetration within established industries is also anticipated to increase as multiaxial reinforcements become more cost-effective.
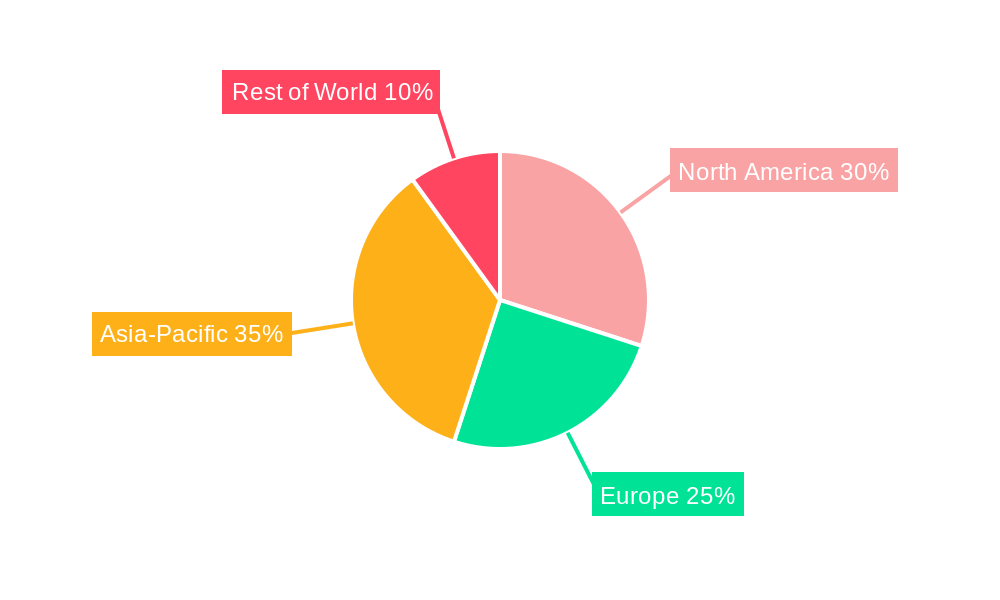
Dominant Regions, Countries, or Segments in Multiaxial Reinforcements
North America and Europe currently hold the largest market share in the multiaxial reinforcements market, driven by the significant presence of major manufacturers and substantial demand from the aerospace and automotive industries. However, the Asia-Pacific region is experiencing the fastest growth, fueled by increasing investments in infrastructure development, particularly within the wind energy and automotive sectors in China and India.
Key Drivers:
- Strong Automotive Sector Growth (Asia-Pacific): Rapid economic expansion and rising car ownership in countries like China and India are key drivers.
- Government Initiatives (Europe and North America): Government support for renewable energy (wind energy) and fuel-efficient vehicles is stimulating demand.
- Technological Advancements: Continuous improvements in material properties and manufacturing techniques are expanding applications.
Dominance Factors:
- Established Manufacturing Base (North America and Europe): High concentration of manufacturers and mature supply chains contribute to market leadership.
- High Adoption Rates (North America and Europe): Strong demand from established industries like aerospace and automotive drives market share.
- Rapid Growth Potential (Asia-Pacific): Expanding infrastructure projects and increasing investments in renewable energy are fueling significant growth. The region is expected to surpass North America in market size by 2033.
Multiaxial Reinforcements Product Landscape
Multiaxial reinforcements are available in various forms, including woven fabrics, non-crimp fabrics (NCFs), and stitched fabrics, each offering unique properties tailored to specific applications. Innovation in fiber types (carbon, glass, aramid) and resin systems continues to enhance their strength, stiffness, and durability. Recent advancements focus on improved drape properties for complex geometries and optimized designs for enhanced processability. These improvements reduce manufacturing costs and improve final product performance characteristics. The market offers products with varying degrees of stiffness, tensile strength, and elongation, allowing for customization to meet diverse end-user needs.
Key Drivers, Barriers & Challenges in Multiaxial Reinforcements
Key Drivers:
- Growing demand for lightweight and high-strength materials in the aerospace and automotive industries.
- Increasing use of multiaxial reinforcements in wind energy applications.
- Technological advancements, leading to improved product performance and cost reduction.
Challenges and Restraints:
- High raw material costs, particularly for advanced fibers like carbon fiber.
- Supply chain disruptions and geopolitical instability affecting raw material availability.
- Competition from alternative reinforcement materials, such as unidirectional fibers. This pressure is reducing profit margins by an estimated xx% per year.
Emerging Opportunities in Multiaxial Reinforcements
The market presents growth opportunities in several sectors:
- Expansion into emerging markets, particularly in Asia-Pacific, driven by infrastructure development.
- Development of novel applications in construction, marine, and sporting goods industries.
- Focus on sustainable and recyclable materials to meet environmental concerns.
Growth Accelerators in the Multiaxial Reinforcements Industry
Strategic partnerships between raw material suppliers, manufacturers, and end-users are driving innovation and accelerating market growth. Technological breakthroughs in fiber design and manufacturing processes continue to improve the cost-effectiveness and performance of multiaxial reinforcements. Government initiatives promoting renewable energy and sustainable transportation are supporting industry expansion.
Key Players Shaping the Multiaxial Reinforcements Market
- Saertex
- Hexcel
- Sigmatex
- Owens Corning
- Chomarat Group
- SGL Carbon
- Saint-Gobain Vetrotex
- METYX Composites
- Sicomin
- Karbon composites & Technology
- CA Composites
- Selcom
- Ahlstrom
- Dipex
- Plastic Reinforcement Fabrics
- SKAPS Industries
- Omnis Kompozit
Notable Milestones in Multiaxial Reinforcements Sector
- 2021-Q3: Saertex launched a new line of multiaxial fabrics optimized for automotive applications.
- 2022-Q1: Hexcel announced a significant investment in expanding its carbon fiber production capacity.
- 2023-Q2: A strategic partnership between Sigmatex and a major automotive manufacturer was formed to develop advanced lightweight materials. (Further details are confidential).
In-Depth Multiaxial Reinforcements Market Outlook
The multiaxial reinforcements market is poised for substantial growth over the next decade, driven by the increasing adoption of lightweight materials in various industries and continuous technological advancements. Strategic partnerships and investments in research and development will further accelerate market expansion. The Asia-Pacific region is expected to be a key growth driver, presenting significant opportunities for manufacturers. The focus on sustainability and the development of recyclable materials will further shape the market dynamics in the coming years. Long-term growth prospects are positive, particularly for companies that can adapt to evolving technological trends and customer needs.
Multiaxial Reinforcements Segmentation
-
1. Application
- 1.1. Automotive
- 1.2. Aerospace
- 1.3. Wind Energy
- 1.4. Marine
- 1.5. Construction
- 1.6. Others
-
2. Type
- 2.1. Biaxial Reinforcements
- 2.2. Triaxial Reinforcements
- 2.3. Quadraxial Reinforcements
- 2.4. Unidirectional (UD) Reinforcements
Multiaxial Reinforcements Segmentation By Geography
-
1. North America
- 1.1. United States
- 1.2. Canada
- 1.3. Mexico
-
2. South America
- 2.1. Brazil
- 2.2. Argentina
- 2.3. Rest of South America
-
3. Europe
- 3.1. United Kingdom
- 3.2. Germany
- 3.3. France
- 3.4. Italy
- 3.5. Spain
- 3.6. Russia
- 3.7. Benelux
- 3.8. Nordics
- 3.9. Rest of Europe
-
4. Middle East & Africa
- 4.1. Turkey
- 4.2. Israel
- 4.3. GCC
- 4.4. North Africa
- 4.5. South Africa
- 4.6. Rest of Middle East & Africa
-
5. Asia Pacific
- 5.1. China
- 5.2. India
- 5.3. Japan
- 5.4. South Korea
- 5.5. ASEAN
- 5.6. Oceania
- 5.7. Rest of Asia Pacific
Multiaxial Reinforcements Regional Market Share
Geographic Coverage of Multiaxial Reinforcements
Multiaxial Reinforcements REPORT HIGHLIGHTS
| Aspects | Details |
|---|---|
| Study Period | 2020-2034 |
| Base Year | 2025 |
| Estimated Year | 2026 |
| Forecast Period | 2026-2034 |
| Historical Period | 2020-2025 |
| Growth Rate | CAGR of 2.3% from 2020-2034 |
| Segmentation |
|
Table of Contents
- 1. Introduction
- 1.1. Research Scope
- 1.2. Market Segmentation
- 1.3. Research Methodology
- 1.4. Definitions and Assumptions
- 2. Executive Summary
- 2.1. Introduction
- 3. Market Dynamics
- 3.1. Introduction
- 3.2. Market Drivers
- 3.3. Market Restrains
- 3.4. Market Trends
- 4. Market Factor Analysis
- 4.1. Porters Five Forces
- 4.2. Supply/Value Chain
- 4.3. PESTEL analysis
- 4.4. Market Entropy
- 4.5. Patent/Trademark Analysis
- 5. Global Multiaxial Reinforcements Analysis, Insights and Forecast, 2020-2032
- 5.1. Market Analysis, Insights and Forecast - by Application
- 5.1.1. Automotive
- 5.1.2. Aerospace
- 5.1.3. Wind Energy
- 5.1.4. Marine
- 5.1.5. Construction
- 5.1.6. Others
- 5.2. Market Analysis, Insights and Forecast - by Type
- 5.2.1. Biaxial Reinforcements
- 5.2.2. Triaxial Reinforcements
- 5.2.3. Quadraxial Reinforcements
- 5.2.4. Unidirectional (UD) Reinforcements
- 5.3. Market Analysis, Insights and Forecast - by Region
- 5.3.1. North America
- 5.3.2. South America
- 5.3.3. Europe
- 5.3.4. Middle East & Africa
- 5.3.5. Asia Pacific
- 5.1. Market Analysis, Insights and Forecast - by Application
- 6. North America Multiaxial Reinforcements Analysis, Insights and Forecast, 2020-2032
- 6.1. Market Analysis, Insights and Forecast - by Application
- 6.1.1. Automotive
- 6.1.2. Aerospace
- 6.1.3. Wind Energy
- 6.1.4. Marine
- 6.1.5. Construction
- 6.1.6. Others
- 6.2. Market Analysis, Insights and Forecast - by Type
- 6.2.1. Biaxial Reinforcements
- 6.2.2. Triaxial Reinforcements
- 6.2.3. Quadraxial Reinforcements
- 6.2.4. Unidirectional (UD) Reinforcements
- 6.1. Market Analysis, Insights and Forecast - by Application
- 7. South America Multiaxial Reinforcements Analysis, Insights and Forecast, 2020-2032
- 7.1. Market Analysis, Insights and Forecast - by Application
- 7.1.1. Automotive
- 7.1.2. Aerospace
- 7.1.3. Wind Energy
- 7.1.4. Marine
- 7.1.5. Construction
- 7.1.6. Others
- 7.2. Market Analysis, Insights and Forecast - by Type
- 7.2.1. Biaxial Reinforcements
- 7.2.2. Triaxial Reinforcements
- 7.2.3. Quadraxial Reinforcements
- 7.2.4. Unidirectional (UD) Reinforcements
- 7.1. Market Analysis, Insights and Forecast - by Application
- 8. Europe Multiaxial Reinforcements Analysis, Insights and Forecast, 2020-2032
- 8.1. Market Analysis, Insights and Forecast - by Application
- 8.1.1. Automotive
- 8.1.2. Aerospace
- 8.1.3. Wind Energy
- 8.1.4. Marine
- 8.1.5. Construction
- 8.1.6. Others
- 8.2. Market Analysis, Insights and Forecast - by Type
- 8.2.1. Biaxial Reinforcements
- 8.2.2. Triaxial Reinforcements
- 8.2.3. Quadraxial Reinforcements
- 8.2.4. Unidirectional (UD) Reinforcements
- 8.1. Market Analysis, Insights and Forecast - by Application
- 9. Middle East & Africa Multiaxial Reinforcements Analysis, Insights and Forecast, 2020-2032
- 9.1. Market Analysis, Insights and Forecast - by Application
- 9.1.1. Automotive
- 9.1.2. Aerospace
- 9.1.3. Wind Energy
- 9.1.4. Marine
- 9.1.5. Construction
- 9.1.6. Others
- 9.2. Market Analysis, Insights and Forecast - by Type
- 9.2.1. Biaxial Reinforcements
- 9.2.2. Triaxial Reinforcements
- 9.2.3. Quadraxial Reinforcements
- 9.2.4. Unidirectional (UD) Reinforcements
- 9.1. Market Analysis, Insights and Forecast - by Application
- 10. Asia Pacific Multiaxial Reinforcements Analysis, Insights and Forecast, 2020-2032
- 10.1. Market Analysis, Insights and Forecast - by Application
- 10.1.1. Automotive
- 10.1.2. Aerospace
- 10.1.3. Wind Energy
- 10.1.4. Marine
- 10.1.5. Construction
- 10.1.6. Others
- 10.2. Market Analysis, Insights and Forecast - by Type
- 10.2.1. Biaxial Reinforcements
- 10.2.2. Triaxial Reinforcements
- 10.2.3. Quadraxial Reinforcements
- 10.2.4. Unidirectional (UD) Reinforcements
- 10.1. Market Analysis, Insights and Forecast - by Application
- 11. Competitive Analysis
- 11.1. Global Market Share Analysis 2025
- 11.2. Company Profiles
- 11.2.1 Saertex
- 11.2.1.1. Overview
- 11.2.1.2. Products
- 11.2.1.3. SWOT Analysis
- 11.2.1.4. Recent Developments
- 11.2.1.5. Financials (Based on Availability)
- 11.2.2 Hexcel
- 11.2.2.1. Overview
- 11.2.2.2. Products
- 11.2.2.3. SWOT Analysis
- 11.2.2.4. Recent Developments
- 11.2.2.5. Financials (Based on Availability)
- 11.2.3 Sigmatex
- 11.2.3.1. Overview
- 11.2.3.2. Products
- 11.2.3.3. SWOT Analysis
- 11.2.3.4. Recent Developments
- 11.2.3.5. Financials (Based on Availability)
- 11.2.4 Owens Corning
- 11.2.4.1. Overview
- 11.2.4.2. Products
- 11.2.4.3. SWOT Analysis
- 11.2.4.4. Recent Developments
- 11.2.4.5. Financials (Based on Availability)
- 11.2.5 Chomarat Group
- 11.2.5.1. Overview
- 11.2.5.2. Products
- 11.2.5.3. SWOT Analysis
- 11.2.5.4. Recent Developments
- 11.2.5.5. Financials (Based on Availability)
- 11.2.6 SGL Carbon
- 11.2.6.1. Overview
- 11.2.6.2. Products
- 11.2.6.3. SWOT Analysis
- 11.2.6.4. Recent Developments
- 11.2.6.5. Financials (Based on Availability)
- 11.2.7 Saint-Gobain Vetrotex
- 11.2.7.1. Overview
- 11.2.7.2. Products
- 11.2.7.3. SWOT Analysis
- 11.2.7.4. Recent Developments
- 11.2.7.5. Financials (Based on Availability)
- 11.2.8 METYX Composites
- 11.2.8.1. Overview
- 11.2.8.2. Products
- 11.2.8.3. SWOT Analysis
- 11.2.8.4. Recent Developments
- 11.2.8.5. Financials (Based on Availability)
- 11.2.9 Sicomin
- 11.2.9.1. Overview
- 11.2.9.2. Products
- 11.2.9.3. SWOT Analysis
- 11.2.9.4. Recent Developments
- 11.2.9.5. Financials (Based on Availability)
- 11.2.10 Karbon composites & Technology
- 11.2.10.1. Overview
- 11.2.10.2. Products
- 11.2.10.3. SWOT Analysis
- 11.2.10.4. Recent Developments
- 11.2.10.5. Financials (Based on Availability)
- 11.2.11 CA Composites
- 11.2.11.1. Overview
- 11.2.11.2. Products
- 11.2.11.3. SWOT Analysis
- 11.2.11.4. Recent Developments
- 11.2.11.5. Financials (Based on Availability)
- 11.2.12 Selcom
- 11.2.12.1. Overview
- 11.2.12.2. Products
- 11.2.12.3. SWOT Analysis
- 11.2.12.4. Recent Developments
- 11.2.12.5. Financials (Based on Availability)
- 11.2.13 Ahlstrom
- 11.2.13.1. Overview
- 11.2.13.2. Products
- 11.2.13.3. SWOT Analysis
- 11.2.13.4. Recent Developments
- 11.2.13.5. Financials (Based on Availability)
- 11.2.14 Dipex
- 11.2.14.1. Overview
- 11.2.14.2. Products
- 11.2.14.3. SWOT Analysis
- 11.2.14.4. Recent Developments
- 11.2.14.5. Financials (Based on Availability)
- 11.2.15 Plastic Reinforcement Fabrics
- 11.2.15.1. Overview
- 11.2.15.2. Products
- 11.2.15.3. SWOT Analysis
- 11.2.15.4. Recent Developments
- 11.2.15.5. Financials (Based on Availability)
- 11.2.16 SKAPS Industries
- 11.2.16.1. Overview
- 11.2.16.2. Products
- 11.2.16.3. SWOT Analysis
- 11.2.16.4. Recent Developments
- 11.2.16.5. Financials (Based on Availability)
- 11.2.17 Omnis Kompozit
- 11.2.17.1. Overview
- 11.2.17.2. Products
- 11.2.17.3. SWOT Analysis
- 11.2.17.4. Recent Developments
- 11.2.17.5. Financials (Based on Availability)
- 11.2.1 Saertex
List of Figures
- Figure 1: Global Multiaxial Reinforcements Revenue Breakdown (million, %) by Region 2025 & 2033
- Figure 2: North America Multiaxial Reinforcements Revenue (million), by Application 2025 & 2033
- Figure 3: North America Multiaxial Reinforcements Revenue Share (%), by Application 2025 & 2033
- Figure 4: North America Multiaxial Reinforcements Revenue (million), by Type 2025 & 2033
- Figure 5: North America Multiaxial Reinforcements Revenue Share (%), by Type 2025 & 2033
- Figure 6: North America Multiaxial Reinforcements Revenue (million), by Country 2025 & 2033
- Figure 7: North America Multiaxial Reinforcements Revenue Share (%), by Country 2025 & 2033
- Figure 8: South America Multiaxial Reinforcements Revenue (million), by Application 2025 & 2033
- Figure 9: South America Multiaxial Reinforcements Revenue Share (%), by Application 2025 & 2033
- Figure 10: South America Multiaxial Reinforcements Revenue (million), by Type 2025 & 2033
- Figure 11: South America Multiaxial Reinforcements Revenue Share (%), by Type 2025 & 2033
- Figure 12: South America Multiaxial Reinforcements Revenue (million), by Country 2025 & 2033
- Figure 13: South America Multiaxial Reinforcements Revenue Share (%), by Country 2025 & 2033
- Figure 14: Europe Multiaxial Reinforcements Revenue (million), by Application 2025 & 2033
- Figure 15: Europe Multiaxial Reinforcements Revenue Share (%), by Application 2025 & 2033
- Figure 16: Europe Multiaxial Reinforcements Revenue (million), by Type 2025 & 2033
- Figure 17: Europe Multiaxial Reinforcements Revenue Share (%), by Type 2025 & 2033
- Figure 18: Europe Multiaxial Reinforcements Revenue (million), by Country 2025 & 2033
- Figure 19: Europe Multiaxial Reinforcements Revenue Share (%), by Country 2025 & 2033
- Figure 20: Middle East & Africa Multiaxial Reinforcements Revenue (million), by Application 2025 & 2033
- Figure 21: Middle East & Africa Multiaxial Reinforcements Revenue Share (%), by Application 2025 & 2033
- Figure 22: Middle East & Africa Multiaxial Reinforcements Revenue (million), by Type 2025 & 2033
- Figure 23: Middle East & Africa Multiaxial Reinforcements Revenue Share (%), by Type 2025 & 2033
- Figure 24: Middle East & Africa Multiaxial Reinforcements Revenue (million), by Country 2025 & 2033
- Figure 25: Middle East & Africa Multiaxial Reinforcements Revenue Share (%), by Country 2025 & 2033
- Figure 26: Asia Pacific Multiaxial Reinforcements Revenue (million), by Application 2025 & 2033
- Figure 27: Asia Pacific Multiaxial Reinforcements Revenue Share (%), by Application 2025 & 2033
- Figure 28: Asia Pacific Multiaxial Reinforcements Revenue (million), by Type 2025 & 2033
- Figure 29: Asia Pacific Multiaxial Reinforcements Revenue Share (%), by Type 2025 & 2033
- Figure 30: Asia Pacific Multiaxial Reinforcements Revenue (million), by Country 2025 & 2033
- Figure 31: Asia Pacific Multiaxial Reinforcements Revenue Share (%), by Country 2025 & 2033
List of Tables
- Table 1: Global Multiaxial Reinforcements Revenue million Forecast, by Application 2020 & 2033
- Table 2: Global Multiaxial Reinforcements Revenue million Forecast, by Type 2020 & 2033
- Table 3: Global Multiaxial Reinforcements Revenue million Forecast, by Region 2020 & 2033
- Table 4: Global Multiaxial Reinforcements Revenue million Forecast, by Application 2020 & 2033
- Table 5: Global Multiaxial Reinforcements Revenue million Forecast, by Type 2020 & 2033
- Table 6: Global Multiaxial Reinforcements Revenue million Forecast, by Country 2020 & 2033
- Table 7: United States Multiaxial Reinforcements Revenue (million) Forecast, by Application 2020 & 2033
- Table 8: Canada Multiaxial Reinforcements Revenue (million) Forecast, by Application 2020 & 2033
- Table 9: Mexico Multiaxial Reinforcements Revenue (million) Forecast, by Application 2020 & 2033
- Table 10: Global Multiaxial Reinforcements Revenue million Forecast, by Application 2020 & 2033
- Table 11: Global Multiaxial Reinforcements Revenue million Forecast, by Type 2020 & 2033
- Table 12: Global Multiaxial Reinforcements Revenue million Forecast, by Country 2020 & 2033
- Table 13: Brazil Multiaxial Reinforcements Revenue (million) Forecast, by Application 2020 & 2033
- Table 14: Argentina Multiaxial Reinforcements Revenue (million) Forecast, by Application 2020 & 2033
- Table 15: Rest of South America Multiaxial Reinforcements Revenue (million) Forecast, by Application 2020 & 2033
- Table 16: Global Multiaxial Reinforcements Revenue million Forecast, by Application 2020 & 2033
- Table 17: Global Multiaxial Reinforcements Revenue million Forecast, by Type 2020 & 2033
- Table 18: Global Multiaxial Reinforcements Revenue million Forecast, by Country 2020 & 2033
- Table 19: United Kingdom Multiaxial Reinforcements Revenue (million) Forecast, by Application 2020 & 2033
- Table 20: Germany Multiaxial Reinforcements Revenue (million) Forecast, by Application 2020 & 2033
- Table 21: France Multiaxial Reinforcements Revenue (million) Forecast, by Application 2020 & 2033
- Table 22: Italy Multiaxial Reinforcements Revenue (million) Forecast, by Application 2020 & 2033
- Table 23: Spain Multiaxial Reinforcements Revenue (million) Forecast, by Application 2020 & 2033
- Table 24: Russia Multiaxial Reinforcements Revenue (million) Forecast, by Application 2020 & 2033
- Table 25: Benelux Multiaxial Reinforcements Revenue (million) Forecast, by Application 2020 & 2033
- Table 26: Nordics Multiaxial Reinforcements Revenue (million) Forecast, by Application 2020 & 2033
- Table 27: Rest of Europe Multiaxial Reinforcements Revenue (million) Forecast, by Application 2020 & 2033
- Table 28: Global Multiaxial Reinforcements Revenue million Forecast, by Application 2020 & 2033
- Table 29: Global Multiaxial Reinforcements Revenue million Forecast, by Type 2020 & 2033
- Table 30: Global Multiaxial Reinforcements Revenue million Forecast, by Country 2020 & 2033
- Table 31: Turkey Multiaxial Reinforcements Revenue (million) Forecast, by Application 2020 & 2033
- Table 32: Israel Multiaxial Reinforcements Revenue (million) Forecast, by Application 2020 & 2033
- Table 33: GCC Multiaxial Reinforcements Revenue (million) Forecast, by Application 2020 & 2033
- Table 34: North Africa Multiaxial Reinforcements Revenue (million) Forecast, by Application 2020 & 2033
- Table 35: South Africa Multiaxial Reinforcements Revenue (million) Forecast, by Application 2020 & 2033
- Table 36: Rest of Middle East & Africa Multiaxial Reinforcements Revenue (million) Forecast, by Application 2020 & 2033
- Table 37: Global Multiaxial Reinforcements Revenue million Forecast, by Application 2020 & 2033
- Table 38: Global Multiaxial Reinforcements Revenue million Forecast, by Type 2020 & 2033
- Table 39: Global Multiaxial Reinforcements Revenue million Forecast, by Country 2020 & 2033
- Table 40: China Multiaxial Reinforcements Revenue (million) Forecast, by Application 2020 & 2033
- Table 41: India Multiaxial Reinforcements Revenue (million) Forecast, by Application 2020 & 2033
- Table 42: Japan Multiaxial Reinforcements Revenue (million) Forecast, by Application 2020 & 2033
- Table 43: South Korea Multiaxial Reinforcements Revenue (million) Forecast, by Application 2020 & 2033
- Table 44: ASEAN Multiaxial Reinforcements Revenue (million) Forecast, by Application 2020 & 2033
- Table 45: Oceania Multiaxial Reinforcements Revenue (million) Forecast, by Application 2020 & 2033
- Table 46: Rest of Asia Pacific Multiaxial Reinforcements Revenue (million) Forecast, by Application 2020 & 2033
Frequently Asked Questions
1. What is the projected Compound Annual Growth Rate (CAGR) of the Multiaxial Reinforcements?
The projected CAGR is approximately 2.3%.
2. Which companies are prominent players in the Multiaxial Reinforcements?
Key companies in the market include Saertex, Hexcel, Sigmatex, Owens Corning, Chomarat Group, SGL Carbon, Saint-Gobain Vetrotex, METYX Composites, Sicomin, Karbon composites & Technology, CA Composites, Selcom, Ahlstrom, Dipex, Plastic Reinforcement Fabrics, SKAPS Industries, Omnis Kompozit.
3. What are the main segments of the Multiaxial Reinforcements?
The market segments include Application, Type.
4. Can you provide details about the market size?
The market size is estimated to be USD 2181 million as of 2022.
5. What are some drivers contributing to market growth?
N/A
6. What are the notable trends driving market growth?
N/A
7. Are there any restraints impacting market growth?
N/A
8. Can you provide examples of recent developments in the market?
N/A
9. What pricing options are available for accessing the report?
Pricing options include single-user, multi-user, and enterprise licenses priced at USD 4250.00, USD 6375.00, and USD 8500.00 respectively.
10. Is the market size provided in terms of value or volume?
The market size is provided in terms of value, measured in million.
11. Are there any specific market keywords associated with the report?
Yes, the market keyword associated with the report is "Multiaxial Reinforcements," which aids in identifying and referencing the specific market segment covered.
12. How do I determine which pricing option suits my needs best?
The pricing options vary based on user requirements and access needs. Individual users may opt for single-user licenses, while businesses requiring broader access may choose multi-user or enterprise licenses for cost-effective access to the report.
13. Are there any additional resources or data provided in the Multiaxial Reinforcements report?
While the report offers comprehensive insights, it's advisable to review the specific contents or supplementary materials provided to ascertain if additional resources or data are available.
14. How can I stay updated on further developments or reports in the Multiaxial Reinforcements?
To stay informed about further developments, trends, and reports in the Multiaxial Reinforcements, consider subscribing to industry newsletters, following relevant companies and organizations, or regularly checking reputable industry news sources and publications.
Methodology
Step 1 - Identification of Relevant Samples Size from Population Database


Step 2 - Approaches for Defining Global Market Size (Value, Volume* & Price*)

Note*: In applicable scenarios
Step 3 - Data Sources
Primary Research
- Web Analytics
- Survey Reports
- Research Institute
- Latest Research Reports
- Opinion Leaders
Secondary Research
- Annual Reports
- White Paper
- Latest Press Release
- Industry Association
- Paid Database
- Investor Presentations

Step 4 - Data Triangulation
Involves using different sources of information in order to increase the validity of a study
These sources are likely to be stakeholders in a program - participants, other researchers, program staff, other community members, and so on.
Then we put all data in single framework & apply various statistical tools to find out the dynamic on the market.
During the analysis stage, feedback from the stakeholder groups would be compared to determine areas of agreement as well as areas of divergence