

Key Insights
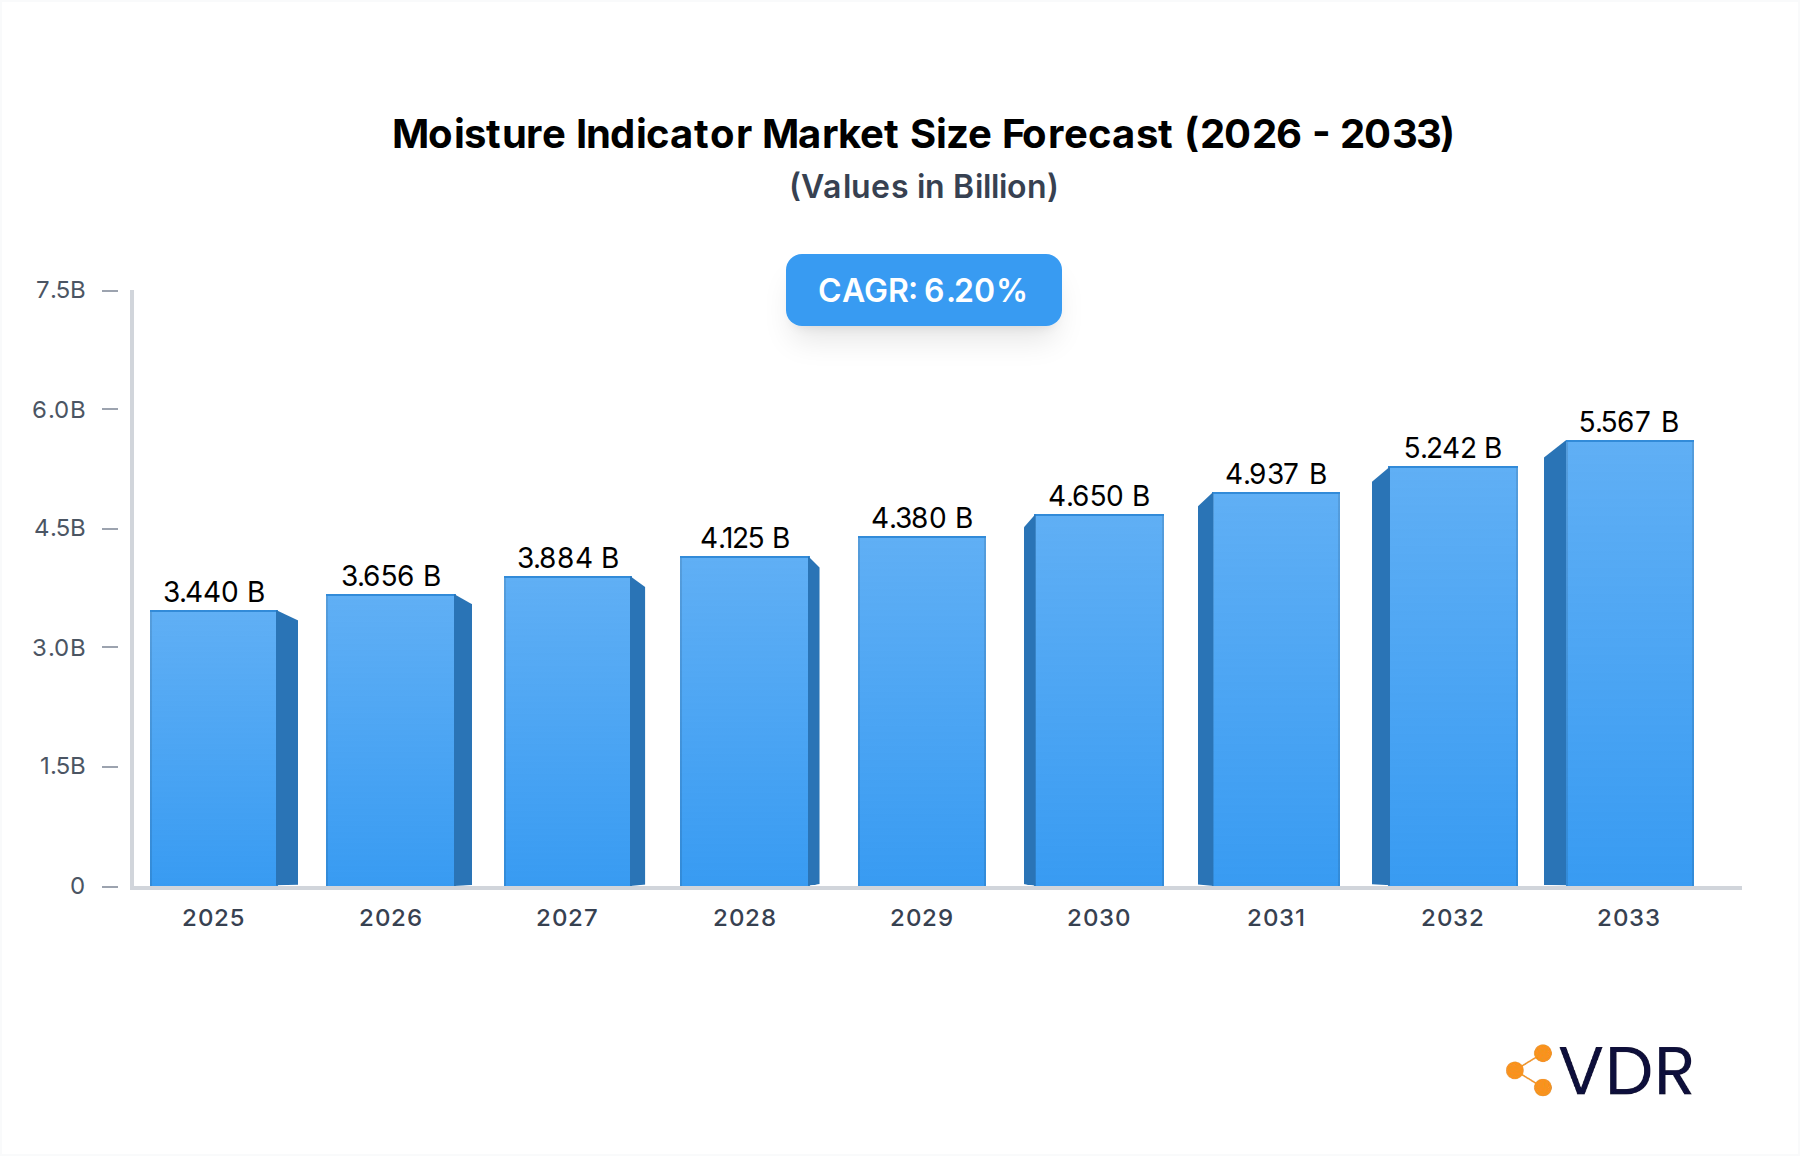
The global Moisture Indicator market is poised for significant expansion, projected to reach $3.44 billion by 2025. This robust growth is underpinned by a Compound Annual Growth Rate (CAGR) of 6.2%, indicating sustained demand and evolving market dynamics. Key drivers fueling this upward trajectory include the escalating need for efficient and reliable refrigeration systems across diverse sectors, from industrial and commercial food storage to transportation and domestic appliances. The increasing complexity of these systems, coupled with stringent regulations concerning refrigerant quality and system longevity, necessitates advanced monitoring solutions like moisture indicators. These devices play a critical role in detecting and preventing moisture ingress, a primary cause of system degradation and failure, thereby contributing to reduced maintenance costs and enhanced operational efficiency. The market's expansion is also being propelled by technological advancements, leading to the development of more sensitive, accurate, and integrated moisture indicator solutions.

Moisture Indicator Market Size (In Billion)
Emerging trends such as the growing adoption of smart technologies and IoT integration within refrigeration systems are further shaping the market landscape. Moisture indicators are evolving to offer real-time data logging, remote monitoring capabilities, and predictive maintenance insights. This shift towards proactive rather than reactive maintenance is particularly attractive to industries where system downtime translates to substantial financial losses. Furthermore, the increasing global focus on energy efficiency and environmental sustainability is indirectly benefiting the moisture indicator market, as well-maintained refrigeration systems operate more efficiently, consuming less energy and reducing their carbon footprint. While the market presents substantial opportunities, potential restraints such as the initial cost of advanced indicator systems and the need for skilled technicians for installation and maintenance could pose challenges. However, the long-term benefits in terms of system protection and operational cost savings are expected to outweigh these concerns, driving continued market growth.
Moisture Indicator Company Market Share
This in-depth report provides a comprehensive analysis of the global Moisture Indicator market, projecting its trajectory from 2019 to 2033. We delve into the intricate dynamics, growth trends, regional dominance, product landscape, key drivers, challenges, emerging opportunities, and the competitive landscape shaped by leading players. This report is meticulously designed for industry professionals, researchers, and stakeholders seeking actionable insights into the refrigeration components market, including its parent and child segments, to inform strategic decision-making and investment planning. The global market size for moisture indicators is projected to reach XX billion USD by 2033.
Moisture Indicator Market Dynamics & Structure
The global Moisture Indicator market exhibits a moderately concentrated structure, characterized by the presence of both established global players and niche regional manufacturers. Technological innovation is a primary driver, with advancements in sensor accuracy, responsiveness, and integration capabilities continuously shaping product development. Regulatory frameworks, particularly concerning refrigerant safety and environmental impact, influence product design and adoption. Competitive product substitutes, while limited in direct function, can include alternative monitoring systems or manual inspection protocols, though dedicated moisture indicators offer superior real-time and automated detection. End-user demographics vary significantly across applications, with industrial and commercial sectors demanding high reliability and precision, while domestic applications prioritize cost-effectiveness and ease of use. Mergers and acquisitions (M&A) trends, though not overtly dominant, are observed as key players strategically consolidate to expand their product portfolios, technological capabilities, and geographic reach.
- Market Concentration: Moderately concentrated with key players holding significant market share.
- Technological Innovation Drivers: Enhanced sensor technology, digital integration, miniaturization.
- Regulatory Frameworks: Environmental regulations, safety standards for refrigerants.
- Competitive Product Substitutes: Limited direct substitutes, emphasis on system integrity and manual checks.
- End-User Demographics: Industrial (high reliability), Commercial (efficiency), Domestic (cost-effectiveness).
- M&A Trends: Strategic acquisitions for portfolio expansion and market access.
Moisture Indicator Growth Trends & Insights
The global Moisture Indicator market is poised for robust growth, driven by the increasing demand for efficient and reliable refrigeration systems across various sectors. The market size is expected to witness a significant expansion, fueled by rising adoption rates in emerging economies and the continuous technological evolution of refrigeration technology. XXX provides critical insights into the market's evolution, highlighting the compound annual growth rate (CAGR) which is projected to be XX% during the forecast period. This growth is underpinned by technological disruptions, such as the development of advanced materials for moisture absorption and the integration of smart technologies for remote monitoring and predictive maintenance. Consumer behavior shifts are also playing a crucial role, with an increasing emphasis on energy efficiency, extended equipment lifespan, and reduced environmental impact, all of which are directly supported by effective moisture detection and management. Market penetration is steadily increasing as awareness of the detrimental effects of moisture in refrigeration systems grows.
Dominant Regions, Countries, or Segments in Moisture Indicator
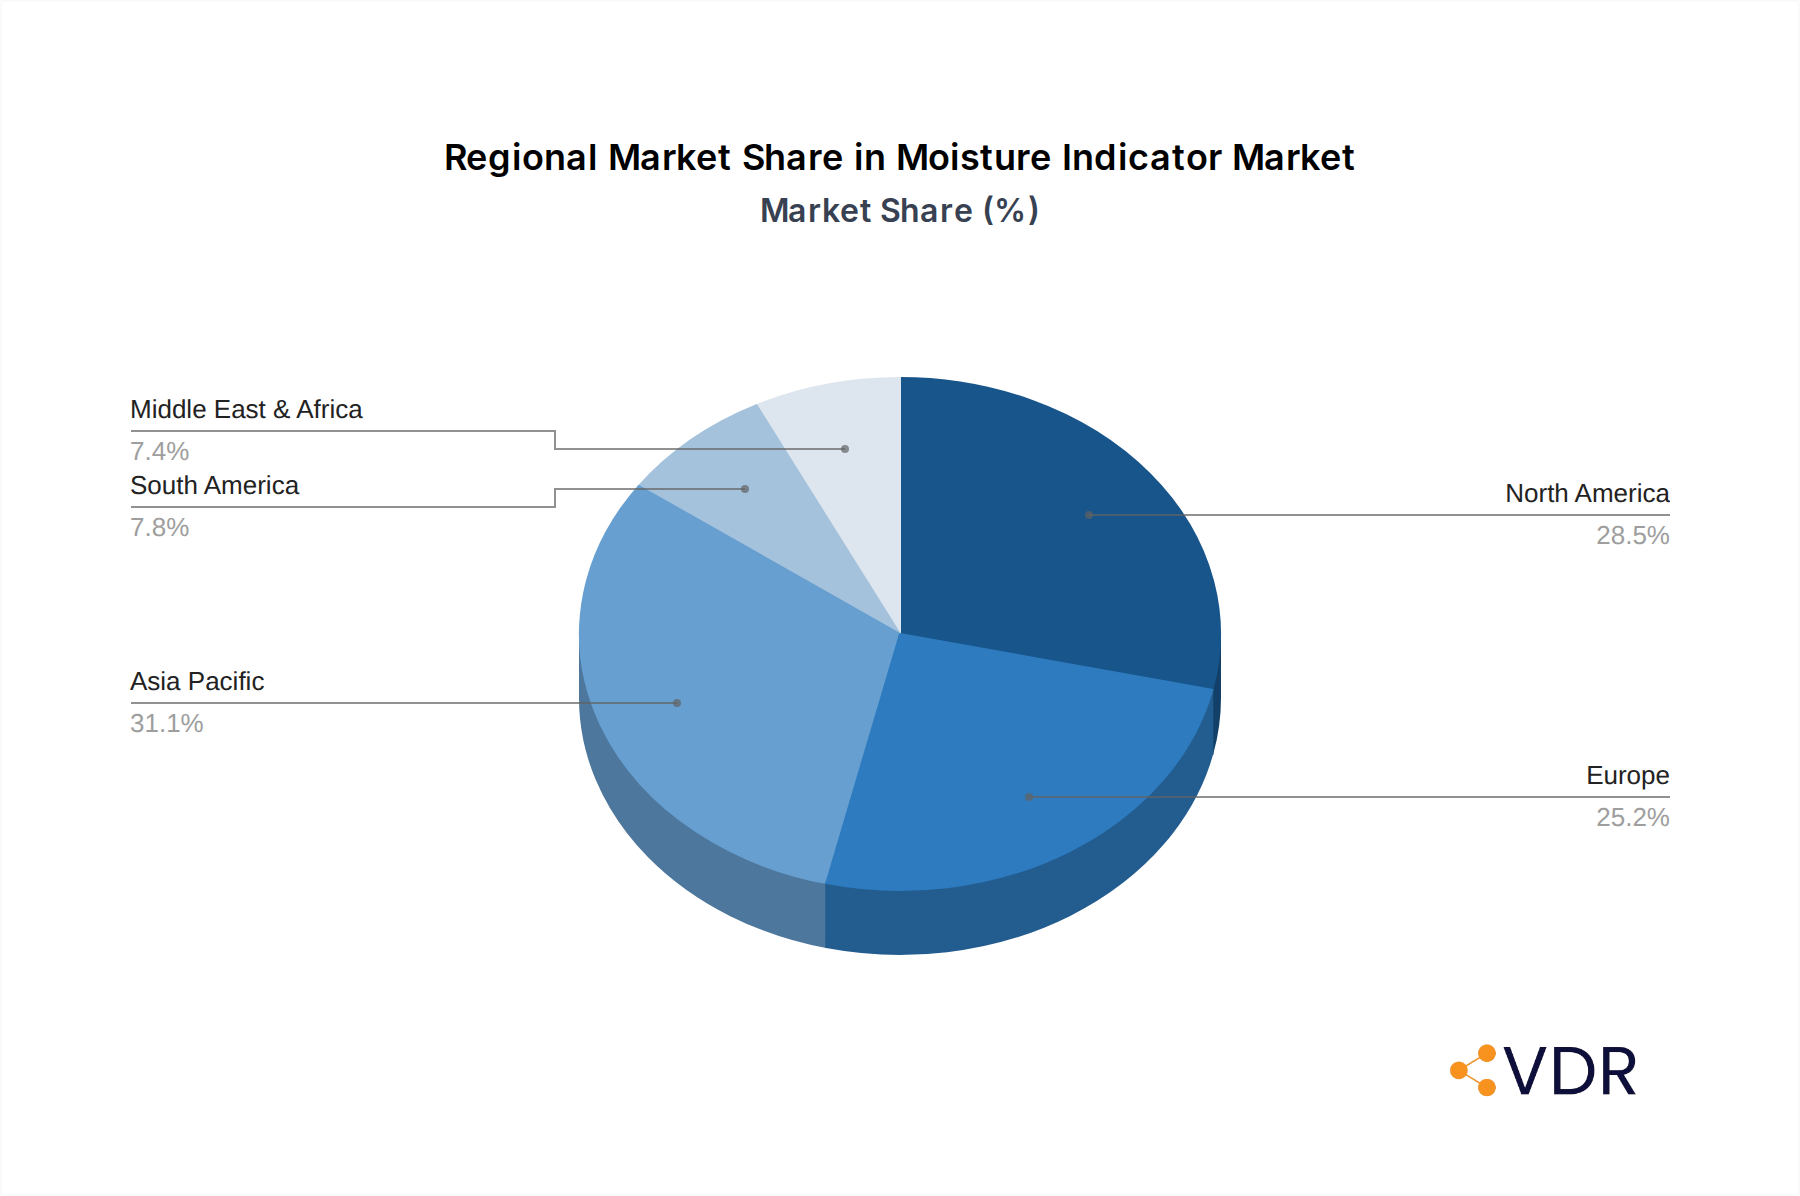
The Commercial Refrigeration application segment is identified as a dominant driver of growth in the global Moisture Indicator market. This dominance is attributable to the widespread use of refrigeration in retail, hospitality, and food service industries, where maintaining optimal temperatures is critical for product quality and safety. Furthermore, the increasing implementation of stringent food safety regulations across these sectors mandates the use of reliable monitoring systems, including moisture indicators, to ensure compliance and prevent spoilage. North America and Europe currently lead in terms of market share, owing to their well-established commercial refrigeration infrastructure and a strong focus on energy efficiency and advanced technologies. However, the Asia-Pacific region is emerging as a high-growth market, driven by rapid urbanization, increasing disposable incomes, and a burgeoning retail sector.
- Dominant Segment: Commercial Refrigeration, driven by food safety regulations and energy efficiency mandates.
- Leading Regions: North America and Europe, with strong existing infrastructure and technological adoption.
- High-Growth Region: Asia-Pacific, fueled by economic development and expanding retail sector.
- Key Drivers in Dominant Segments: Food safety compliance, energy conservation efforts, HVAC/R system reliability.
- Market Share & Growth Potential: Significant current market share in developed regions with substantial future growth potential in emerging economies.
Moisture Indicator Product Landscape
The Moisture Indicator product landscape is characterized by continuous innovation focused on enhancing detection accuracy, responsiveness, and longevity. Key product types include the Thread Type moisture indicator, offering direct integration into refrigeration lines, and the Saddle Type, providing a non-intrusive monitoring solution. Innovations are centered on developing indicators with broader operating temperature ranges, improved resistance to chemical refrigerants, and visual indicators that are easily interpretable. Advanced moisture indicators now offer enhanced performance metrics, such as faster response times to moisture ingress and longer service life, contributing to improved system reliability and reduced maintenance costs. Unique selling propositions often lie in the material science of the desiccant used and the precision of the color-changing indicator.
Key Drivers, Barriers & Challenges in Moisture Indicator
Key Drivers: The growth of the Moisture Indicator market is propelled by the increasing complexity of refrigeration systems, stringent environmental regulations mandating the use of specific refrigerants, and the growing awareness of the critical role moisture plays in system efficiency and lifespan. Technological advancements in sensor technology and the demand for energy-efficient solutions are also significant drivers.
Barriers & Challenges: Supply chain disruptions, particularly for specialized desiccant materials, can pose significant challenges. Regulatory hurdles related to the approval of new indicator technologies or materials can slow down market entry. Intense competition from both established players and emerging manufacturers, coupled with the need for continuous R&D investment, also presents challenges. Furthermore, the initial cost of high-performance moisture indicators can be a barrier for some smaller end-users, impacting market penetration in cost-sensitive segments.
Emerging Opportunities in Moisture Indicator
Emerging opportunities in the Moisture Indicator sector lie in the development of smart, IoT-enabled indicators capable of real-time data transmission and predictive analytics for proactive maintenance. The increasing adoption of natural refrigerants, which can have different moisture absorption characteristics, presents an opportunity for specialized indicator development. Furthermore, untapped markets in developing regions with expanding cold chain infrastructure offer significant growth potential. The integration of moisture indicators into broader HVAC/R system diagnostic platforms and the development of customized solutions for highly specialized industrial applications are also promising avenues.
Growth Accelerators in the Moisture Indicator Industry
Long-term growth in the Moisture Indicator industry will be accelerated by breakthroughs in material science, leading to more sensitive and durable indicator elements. Strategic partnerships between moisture indicator manufacturers and refrigeration system OEMs will foster integrated solutions and wider adoption. Market expansion strategies targeting emerging economies with growing cold chain requirements and investments in research and development for next-generation, connected moisture monitoring solutions will further propel growth.
Key Players Shaping the Moisture Indicator Market
- Parker Hannifin
- Robertshaw
- Plumberstar
- Castel
- Danfoss
- Miracle
- Mueller Refrigeration
- Henry Schein
- YuanBo Engineering
- GMC Refrigerazione
- Refrigera Industriale Srl
- Hawco Air
Notable Milestones in Moisture Indicator Sector
- 2019: Increased focus on environmentally friendly refrigerants driving demand for compatible moisture indicators.
- 2020: Global supply chain disruptions impacting raw material availability for desiccants.
- 2021: Introduction of advanced visual indicator technologies with enhanced sensitivity.
- 2022: Growing trend towards integrated diagnostic systems in commercial refrigeration.
- 2023: Expansion of moisture indicator applications in specialized industrial cooling systems.
- 2024: Significant investment in R&D for smart, IoT-enabled moisture monitoring solutions.
In-Depth Moisture Indicator Market Outlook
The Moisture Indicator market is set for a promising future, driven by ongoing technological advancements and the indispensable need for reliable refrigeration systems. Growth accelerators such as the development of smart, connected indicators for predictive maintenance and the increasing demand for solutions compatible with next-generation refrigerants will define the market. Strategic partnerships and expansion into underserved emerging markets will further solidify this growth trajectory. The outlook remains highly positive, with significant potential for innovation and market penetration.
Moisture Indicator Segmentation
-
1. Application
- 1.1. Industrial Refrigeration
- 1.2. Transport Refrigeration
- 1.3. Domestic Refrigeration
- 1.4. Commercial Refrigeration
- 1.5. Others
-
2. Types
- 2.1. Thread Type
- 2.2. Saddle Type
Moisture Indicator Segmentation By Geography
-
1. North America
- 1.1. United States
- 1.2. Canada
- 1.3. Mexico
-
2. South America
- 2.1. Brazil
- 2.2. Argentina
- 2.3. Rest of South America
-
3. Europe
- 3.1. United Kingdom
- 3.2. Germany
- 3.3. France
- 3.4. Italy
- 3.5. Spain
- 3.6. Russia
- 3.7. Benelux
- 3.8. Nordics
- 3.9. Rest of Europe
-
4. Middle East & Africa
- 4.1. Turkey
- 4.2. Israel
- 4.3. GCC
- 4.4. North Africa
- 4.5. South Africa
- 4.6. Rest of Middle East & Africa
-
5. Asia Pacific
- 5.1. China
- 5.2. India
- 5.3. Japan
- 5.4. South Korea
- 5.5. ASEAN
- 5.6. Oceania
- 5.7. Rest of Asia Pacific
Moisture Indicator Regional Market Share
Geographic Coverage of Moisture Indicator
Moisture Indicator REPORT HIGHLIGHTS
| Aspects | Details |
|---|---|
| Study Period | 2020-2034 |
| Base Year | 2025 |
| Estimated Year | 2026 |
| Forecast Period | 2026-2034 |
| Historical Period | 2020-2025 |
| Growth Rate | CAGR of 6.2% from 2020-2034 |
| Segmentation |
|
Table of Contents
- 1. Introduction
- 1.1. Research Scope
- 1.2. Market Segmentation
- 1.3. Research Methodology
- 1.4. Definitions and Assumptions
- 2. Executive Summary
- 2.1. Introduction
- 3. Market Dynamics
- 3.1. Introduction
- 3.2. Market Drivers
- 3.3. Market Restrains
- 3.4. Market Trends
- 4. Market Factor Analysis
- 4.1. Porters Five Forces
- 4.2. Supply/Value Chain
- 4.3. PESTEL analysis
- 4.4. Market Entropy
- 4.5. Patent/Trademark Analysis
- 5. Global Moisture Indicator Analysis, Insights and Forecast, 2020-2032
- 5.1. Market Analysis, Insights and Forecast - by Application
- 5.1.1. Industrial Refrigeration
- 5.1.2. Transport Refrigeration
- 5.1.3. Domestic Refrigeration
- 5.1.4. Commercial Refrigeration
- 5.1.5. Others
- 5.2. Market Analysis, Insights and Forecast - by Types
- 5.2.1. Thread Type
- 5.2.2. Saddle Type
- 5.3. Market Analysis, Insights and Forecast - by Region
- 5.3.1. North America
- 5.3.2. South America
- 5.3.3. Europe
- 5.3.4. Middle East & Africa
- 5.3.5. Asia Pacific
- 5.1. Market Analysis, Insights and Forecast - by Application
- 6. North America Moisture Indicator Analysis, Insights and Forecast, 2020-2032
- 6.1. Market Analysis, Insights and Forecast - by Application
- 6.1.1. Industrial Refrigeration
- 6.1.2. Transport Refrigeration
- 6.1.3. Domestic Refrigeration
- 6.1.4. Commercial Refrigeration
- 6.1.5. Others
- 6.2. Market Analysis, Insights and Forecast - by Types
- 6.2.1. Thread Type
- 6.2.2. Saddle Type
- 6.1. Market Analysis, Insights and Forecast - by Application
- 7. South America Moisture Indicator Analysis, Insights and Forecast, 2020-2032
- 7.1. Market Analysis, Insights and Forecast - by Application
- 7.1.1. Industrial Refrigeration
- 7.1.2. Transport Refrigeration
- 7.1.3. Domestic Refrigeration
- 7.1.4. Commercial Refrigeration
- 7.1.5. Others
- 7.2. Market Analysis, Insights and Forecast - by Types
- 7.2.1. Thread Type
- 7.2.2. Saddle Type
- 7.1. Market Analysis, Insights and Forecast - by Application
- 8. Europe Moisture Indicator Analysis, Insights and Forecast, 2020-2032
- 8.1. Market Analysis, Insights and Forecast - by Application
- 8.1.1. Industrial Refrigeration
- 8.1.2. Transport Refrigeration
- 8.1.3. Domestic Refrigeration
- 8.1.4. Commercial Refrigeration
- 8.1.5. Others
- 8.2. Market Analysis, Insights and Forecast - by Types
- 8.2.1. Thread Type
- 8.2.2. Saddle Type
- 8.1. Market Analysis, Insights and Forecast - by Application
- 9. Middle East & Africa Moisture Indicator Analysis, Insights and Forecast, 2020-2032
- 9.1. Market Analysis, Insights and Forecast - by Application
- 9.1.1. Industrial Refrigeration
- 9.1.2. Transport Refrigeration
- 9.1.3. Domestic Refrigeration
- 9.1.4. Commercial Refrigeration
- 9.1.5. Others
- 9.2. Market Analysis, Insights and Forecast - by Types
- 9.2.1. Thread Type
- 9.2.2. Saddle Type
- 9.1. Market Analysis, Insights and Forecast - by Application
- 10. Asia Pacific Moisture Indicator Analysis, Insights and Forecast, 2020-2032
- 10.1. Market Analysis, Insights and Forecast - by Application
- 10.1.1. Industrial Refrigeration
- 10.1.2. Transport Refrigeration
- 10.1.3. Domestic Refrigeration
- 10.1.4. Commercial Refrigeration
- 10.1.5. Others
- 10.2. Market Analysis, Insights and Forecast - by Types
- 10.2.1. Thread Type
- 10.2.2. Saddle Type
- 10.1. Market Analysis, Insights and Forecast - by Application
- 11. Competitive Analysis
- 11.1. Global Market Share Analysis 2025
- 11.2. Company Profiles
- 11.2.1 Parker Hannifin
- 11.2.1.1. Overview
- 11.2.1.2. Products
- 11.2.1.3. SWOT Analysis
- 11.2.1.4. Recent Developments
- 11.2.1.5. Financials (Based on Availability)
- 11.2.2 Robertshaw
- 11.2.2.1. Overview
- 11.2.2.2. Products
- 11.2.2.3. SWOT Analysis
- 11.2.2.4. Recent Developments
- 11.2.2.5. Financials (Based on Availability)
- 11.2.3 Plumberstar
- 11.2.3.1. Overview
- 11.2.3.2. Products
- 11.2.3.3. SWOT Analysis
- 11.2.3.4. Recent Developments
- 11.2.3.5. Financials (Based on Availability)
- 11.2.4 Castel
- 11.2.4.1. Overview
- 11.2.4.2. Products
- 11.2.4.3. SWOT Analysis
- 11.2.4.4. Recent Developments
- 11.2.4.5. Financials (Based on Availability)
- 11.2.5 Danfoss
- 11.2.5.1. Overview
- 11.2.5.2. Products
- 11.2.5.3. SWOT Analysis
- 11.2.5.4. Recent Developments
- 11.2.5.5. Financials (Based on Availability)
- 11.2.6 Miracle
- 11.2.6.1. Overview
- 11.2.6.2. Products
- 11.2.6.3. SWOT Analysis
- 11.2.6.4. Recent Developments
- 11.2.6.5. Financials (Based on Availability)
- 11.2.7 Mueller Refrigeration
- 11.2.7.1. Overview
- 11.2.7.2. Products
- 11.2.7.3. SWOT Analysis
- 11.2.7.4. Recent Developments
- 11.2.7.5. Financials (Based on Availability)
- 11.2.8 Henry Schein
- 11.2.8.1. Overview
- 11.2.8.2. Products
- 11.2.8.3. SWOT Analysis
- 11.2.8.4. Recent Developments
- 11.2.8.5. Financials (Based on Availability)
- 11.2.9 YuanBo Engineering
- 11.2.9.1. Overview
- 11.2.9.2. Products
- 11.2.9.3. SWOT Analysis
- 11.2.9.4. Recent Developments
- 11.2.9.5. Financials (Based on Availability)
- 11.2.10 GMC Refrigerazione
- 11.2.10.1. Overview
- 11.2.10.2. Products
- 11.2.10.3. SWOT Analysis
- 11.2.10.4. Recent Developments
- 11.2.10.5. Financials (Based on Availability)
- 11.2.11 Refrigera Industriale Srl
- 11.2.11.1. Overview
- 11.2.11.2. Products
- 11.2.11.3. SWOT Analysis
- 11.2.11.4. Recent Developments
- 11.2.11.5. Financials (Based on Availability)
- 11.2.12 Hawco Air
- 11.2.12.1. Overview
- 11.2.12.2. Products
- 11.2.12.3. SWOT Analysis
- 11.2.12.4. Recent Developments
- 11.2.12.5. Financials (Based on Availability)
- 11.2.1 Parker Hannifin
List of Figures
- Figure 1: Global Moisture Indicator Revenue Breakdown (undefined, %) by Region 2025 & 2033
- Figure 2: North America Moisture Indicator Revenue (undefined), by Application 2025 & 2033
- Figure 3: North America Moisture Indicator Revenue Share (%), by Application 2025 & 2033
- Figure 4: North America Moisture Indicator Revenue (undefined), by Types 2025 & 2033
- Figure 5: North America Moisture Indicator Revenue Share (%), by Types 2025 & 2033
- Figure 6: North America Moisture Indicator Revenue (undefined), by Country 2025 & 2033
- Figure 7: North America Moisture Indicator Revenue Share (%), by Country 2025 & 2033
- Figure 8: South America Moisture Indicator Revenue (undefined), by Application 2025 & 2033
- Figure 9: South America Moisture Indicator Revenue Share (%), by Application 2025 & 2033
- Figure 10: South America Moisture Indicator Revenue (undefined), by Types 2025 & 2033
- Figure 11: South America Moisture Indicator Revenue Share (%), by Types 2025 & 2033
- Figure 12: South America Moisture Indicator Revenue (undefined), by Country 2025 & 2033
- Figure 13: South America Moisture Indicator Revenue Share (%), by Country 2025 & 2033
- Figure 14: Europe Moisture Indicator Revenue (undefined), by Application 2025 & 2033
- Figure 15: Europe Moisture Indicator Revenue Share (%), by Application 2025 & 2033
- Figure 16: Europe Moisture Indicator Revenue (undefined), by Types 2025 & 2033
- Figure 17: Europe Moisture Indicator Revenue Share (%), by Types 2025 & 2033
- Figure 18: Europe Moisture Indicator Revenue (undefined), by Country 2025 & 2033
- Figure 19: Europe Moisture Indicator Revenue Share (%), by Country 2025 & 2033
- Figure 20: Middle East & Africa Moisture Indicator Revenue (undefined), by Application 2025 & 2033
- Figure 21: Middle East & Africa Moisture Indicator Revenue Share (%), by Application 2025 & 2033
- Figure 22: Middle East & Africa Moisture Indicator Revenue (undefined), by Types 2025 & 2033
- Figure 23: Middle East & Africa Moisture Indicator Revenue Share (%), by Types 2025 & 2033
- Figure 24: Middle East & Africa Moisture Indicator Revenue (undefined), by Country 2025 & 2033
- Figure 25: Middle East & Africa Moisture Indicator Revenue Share (%), by Country 2025 & 2033
- Figure 26: Asia Pacific Moisture Indicator Revenue (undefined), by Application 2025 & 2033
- Figure 27: Asia Pacific Moisture Indicator Revenue Share (%), by Application 2025 & 2033
- Figure 28: Asia Pacific Moisture Indicator Revenue (undefined), by Types 2025 & 2033
- Figure 29: Asia Pacific Moisture Indicator Revenue Share (%), by Types 2025 & 2033
- Figure 30: Asia Pacific Moisture Indicator Revenue (undefined), by Country 2025 & 2033
- Figure 31: Asia Pacific Moisture Indicator Revenue Share (%), by Country 2025 & 2033
List of Tables
- Table 1: Global Moisture Indicator Revenue undefined Forecast, by Application 2020 & 2033
- Table 2: Global Moisture Indicator Revenue undefined Forecast, by Types 2020 & 2033
- Table 3: Global Moisture Indicator Revenue undefined Forecast, by Region 2020 & 2033
- Table 4: Global Moisture Indicator Revenue undefined Forecast, by Application 2020 & 2033
- Table 5: Global Moisture Indicator Revenue undefined Forecast, by Types 2020 & 2033
- Table 6: Global Moisture Indicator Revenue undefined Forecast, by Country 2020 & 2033
- Table 7: United States Moisture Indicator Revenue (undefined) Forecast, by Application 2020 & 2033
- Table 8: Canada Moisture Indicator Revenue (undefined) Forecast, by Application 2020 & 2033
- Table 9: Mexico Moisture Indicator Revenue (undefined) Forecast, by Application 2020 & 2033
- Table 10: Global Moisture Indicator Revenue undefined Forecast, by Application 2020 & 2033
- Table 11: Global Moisture Indicator Revenue undefined Forecast, by Types 2020 & 2033
- Table 12: Global Moisture Indicator Revenue undefined Forecast, by Country 2020 & 2033
- Table 13: Brazil Moisture Indicator Revenue (undefined) Forecast, by Application 2020 & 2033
- Table 14: Argentina Moisture Indicator Revenue (undefined) Forecast, by Application 2020 & 2033
- Table 15: Rest of South America Moisture Indicator Revenue (undefined) Forecast, by Application 2020 & 2033
- Table 16: Global Moisture Indicator Revenue undefined Forecast, by Application 2020 & 2033
- Table 17: Global Moisture Indicator Revenue undefined Forecast, by Types 2020 & 2033
- Table 18: Global Moisture Indicator Revenue undefined Forecast, by Country 2020 & 2033
- Table 19: United Kingdom Moisture Indicator Revenue (undefined) Forecast, by Application 2020 & 2033
- Table 20: Germany Moisture Indicator Revenue (undefined) Forecast, by Application 2020 & 2033
- Table 21: France Moisture Indicator Revenue (undefined) Forecast, by Application 2020 & 2033
- Table 22: Italy Moisture Indicator Revenue (undefined) Forecast, by Application 2020 & 2033
- Table 23: Spain Moisture Indicator Revenue (undefined) Forecast, by Application 2020 & 2033
- Table 24: Russia Moisture Indicator Revenue (undefined) Forecast, by Application 2020 & 2033
- Table 25: Benelux Moisture Indicator Revenue (undefined) Forecast, by Application 2020 & 2033
- Table 26: Nordics Moisture Indicator Revenue (undefined) Forecast, by Application 2020 & 2033
- Table 27: Rest of Europe Moisture Indicator Revenue (undefined) Forecast, by Application 2020 & 2033
- Table 28: Global Moisture Indicator Revenue undefined Forecast, by Application 2020 & 2033
- Table 29: Global Moisture Indicator Revenue undefined Forecast, by Types 2020 & 2033
- Table 30: Global Moisture Indicator Revenue undefined Forecast, by Country 2020 & 2033
- Table 31: Turkey Moisture Indicator Revenue (undefined) Forecast, by Application 2020 & 2033
- Table 32: Israel Moisture Indicator Revenue (undefined) Forecast, by Application 2020 & 2033
- Table 33: GCC Moisture Indicator Revenue (undefined) Forecast, by Application 2020 & 2033
- Table 34: North Africa Moisture Indicator Revenue (undefined) Forecast, by Application 2020 & 2033
- Table 35: South Africa Moisture Indicator Revenue (undefined) Forecast, by Application 2020 & 2033
- Table 36: Rest of Middle East & Africa Moisture Indicator Revenue (undefined) Forecast, by Application 2020 & 2033
- Table 37: Global Moisture Indicator Revenue undefined Forecast, by Application 2020 & 2033
- Table 38: Global Moisture Indicator Revenue undefined Forecast, by Types 2020 & 2033
- Table 39: Global Moisture Indicator Revenue undefined Forecast, by Country 2020 & 2033
- Table 40: China Moisture Indicator Revenue (undefined) Forecast, by Application 2020 & 2033
- Table 41: India Moisture Indicator Revenue (undefined) Forecast, by Application 2020 & 2033
- Table 42: Japan Moisture Indicator Revenue (undefined) Forecast, by Application 2020 & 2033
- Table 43: South Korea Moisture Indicator Revenue (undefined) Forecast, by Application 2020 & 2033
- Table 44: ASEAN Moisture Indicator Revenue (undefined) Forecast, by Application 2020 & 2033
- Table 45: Oceania Moisture Indicator Revenue (undefined) Forecast, by Application 2020 & 2033
- Table 46: Rest of Asia Pacific Moisture Indicator Revenue (undefined) Forecast, by Application 2020 & 2033
Frequently Asked Questions
1. What is the projected Compound Annual Growth Rate (CAGR) of the Moisture Indicator?
The projected CAGR is approximately 6.2%.
2. Which companies are prominent players in the Moisture Indicator?
Key companies in the market include Parker Hannifin, Robertshaw, Plumberstar, Castel, Danfoss, Miracle, Mueller Refrigeration, Henry Schein, YuanBo Engineering, GMC Refrigerazione, Refrigera Industriale Srl, Hawco Air.
3. What are the main segments of the Moisture Indicator?
The market segments include Application, Types.
4. Can you provide details about the market size?
The market size is estimated to be USD XXX N/A as of 2022.
5. What are some drivers contributing to market growth?
N/A
6. What are the notable trends driving market growth?
N/A
7. Are there any restraints impacting market growth?
N/A
8. Can you provide examples of recent developments in the market?
N/A
9. What pricing options are available for accessing the report?
Pricing options include single-user, multi-user, and enterprise licenses priced at USD 4900.00, USD 7350.00, and USD 9800.00 respectively.
10. Is the market size provided in terms of value or volume?
The market size is provided in terms of value, measured in N/A.
11. Are there any specific market keywords associated with the report?
Yes, the market keyword associated with the report is "Moisture Indicator," which aids in identifying and referencing the specific market segment covered.
12. How do I determine which pricing option suits my needs best?
The pricing options vary based on user requirements and access needs. Individual users may opt for single-user licenses, while businesses requiring broader access may choose multi-user or enterprise licenses for cost-effective access to the report.
13. Are there any additional resources or data provided in the Moisture Indicator report?
While the report offers comprehensive insights, it's advisable to review the specific contents or supplementary materials provided to ascertain if additional resources or data are available.
14. How can I stay updated on further developments or reports in the Moisture Indicator?
To stay informed about further developments, trends, and reports in the Moisture Indicator, consider subscribing to industry newsletters, following relevant companies and organizations, or regularly checking reputable industry news sources and publications.
Methodology
Step 1 - Identification of Relevant Samples Size from Population Database


Step 2 - Approaches for Defining Global Market Size (Value, Volume* & Price*)

Note*: In applicable scenarios
Step 3 - Data Sources
Primary Research
- Web Analytics
- Survey Reports
- Research Institute
- Latest Research Reports
- Opinion Leaders
Secondary Research
- Annual Reports
- White Paper
- Latest Press Release
- Industry Association
- Paid Database
- Investor Presentations

Step 4 - Data Triangulation
Involves using different sources of information in order to increase the validity of a study
These sources are likely to be stakeholders in a program - participants, other researchers, program staff, other community members, and so on.
Then we put all data in single framework & apply various statistical tools to find out the dynamic on the market.
During the analysis stage, feedback from the stakeholder groups would be compared to determine areas of agreement as well as areas of divergence