
Key Insights
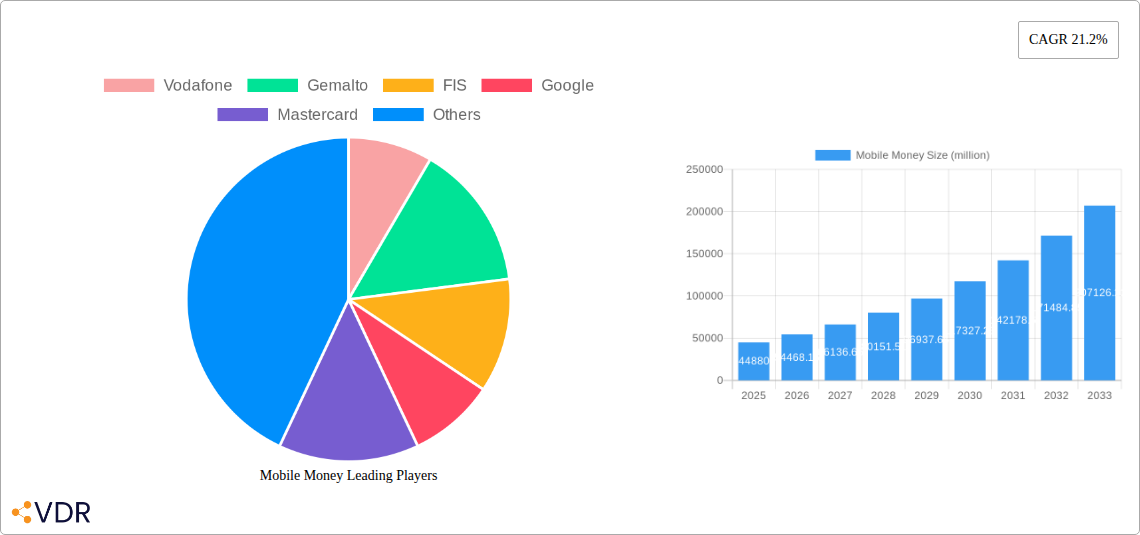
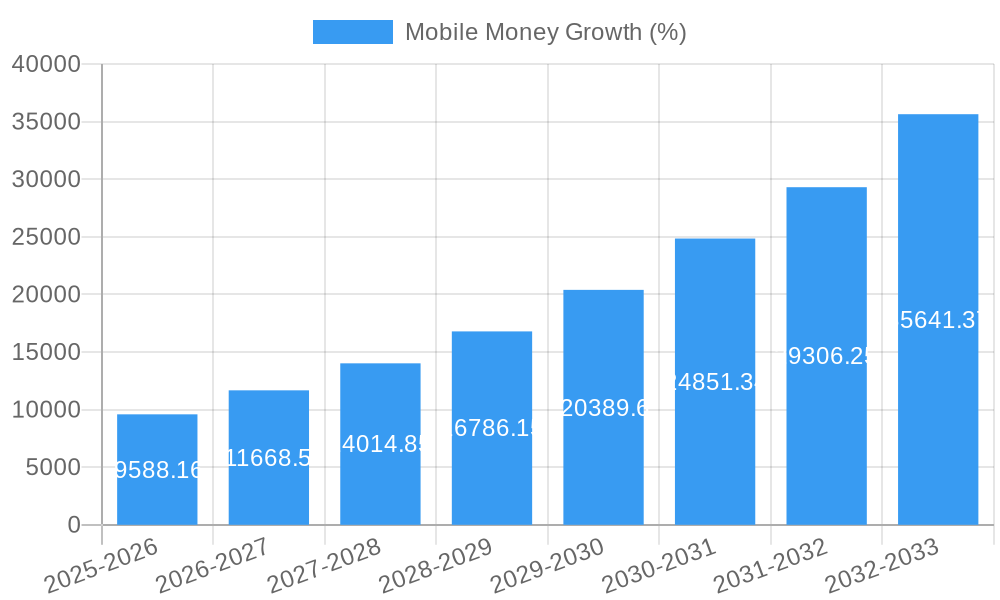
The mobile money market, valued at $44,880 million in 2025, is projected to experience robust growth, fueled by a compound annual growth rate (CAGR) of 21.2% from 2025 to 2033. This expansion is driven by several key factors. Increasing smartphone penetration, particularly in emerging economies, provides a vast and expanding user base for mobile financial services. The rising adoption of digital payment methods, driven by convenience and security concerns, further accelerates market growth. Government initiatives promoting financial inclusion and the development of robust mobile network infrastructure in underserved regions also contribute significantly. Furthermore, continuous innovation in mobile money platforms, offering enhanced functionalities such as micro-loans, insurance, and investment services, broadens the market appeal and drives user engagement. Competition amongst established players like Vodafone, Gemalto, FIS, Google, Mastercard, Bharti Airtel, Orange, Monitise, Mahindra Comviva, and PayPal fosters innovation and competitive pricing, benefiting consumers and fueling market expansion.
The market's growth trajectory is not without challenges. Security concerns related to data breaches and fraud remain a significant restraint, demanding continuous improvement in security protocols and user education. Regulatory hurdles and varying levels of technological infrastructure across different regions also pose challenges. Nevertheless, the overall outlook remains positive, driven by the inherent advantages of mobile money in addressing financial exclusion and providing convenient access to financial services, particularly in regions lacking traditional banking infrastructure. The increasing integration of mobile money with other financial technologies, such as blockchain and AI, further promises to unlock new growth opportunities and enhance the overall user experience. This convergence will likely lead to the emergence of more sophisticated and integrated financial ecosystems in the years to come.
Mobile Money Market Report: 2019-2033 - A Comprehensive Analysis
This comprehensive report provides an in-depth analysis of the global Mobile Money market, encompassing market dynamics, growth trends, regional dominance, product landscapes, key players, and future outlooks. The study period covers 2019-2033, with a base year of 2025 and a forecast period of 2025-2033. The report leverages extensive data analysis to deliver actionable insights for industry professionals, investors, and strategists seeking to navigate this rapidly evolving sector. The market is segmented by parent market (e.g., Fintech) and child market (specific mobile money applications), allowing for a granular understanding of growth drivers. The total market size in 2025 is estimated at $XX billion, projected to reach $YY billion by 2033.
Mobile Money Market Dynamics & Structure
This section analyzes the competitive landscape of the mobile money market, encompassing market concentration, technological innovation, regulatory frameworks, competitive substitutes, end-user demographics, and M&A activity. The market is characterized by a dynamic interplay of established players and emerging fintech companies.
- Market Concentration: The market exhibits a moderately concentrated structure, with key players like Vodafone, Mastercard, and PayPal holding significant market shares, while numerous regional players contribute to overall growth. In 2025, the top 5 players are estimated to hold XX% of the market share.
- Technological Innovation: Continuous technological advancements, particularly in areas like blockchain technology and AI-powered fraud detection, are driving market expansion. However, integration challenges and interoperability issues pose significant barriers to innovation.
- Regulatory Frameworks: Varying regulatory landscapes across different geographies present both opportunities and challenges. Favorable regulatory environments, such as those promoting financial inclusion, are accelerating market growth. Conversely, stringent regulations can hinder expansion in certain regions.
- Competitive Product Substitutes: Traditional banking services and other digital payment systems act as key substitutes. The mobile money industry's success hinges on offering superior convenience, affordability, and accessibility.
- End-User Demographics: Growth is predominantly fueled by the expanding base of smartphone users in emerging markets, along with increasing financial inclusion initiatives targeting underserved populations.
- M&A Trends: The mobile money sector has witnessed significant M&A activity in recent years, with strategic partnerships and acquisitions driving consolidation and expansion. An estimated XX M&A deals were concluded in the historical period (2019-2024), with a predicted increase of YY% during the forecast period.
Mobile Money Growth Trends & Insights
This section provides a detailed analysis of the market's evolution, including market size, adoption rates, technological disruptions, and consumer behavior shifts, drawing upon extensive secondary research and proprietary data analysis. The mobile money market experienced significant growth during the historical period (2019-2024), with a compound annual growth rate (CAGR) of XX%. This robust growth is projected to continue throughout the forecast period (2025-2033), fueled by increasing smartphone penetration, expanding financial inclusion initiatives, and the growing adoption of mobile payment solutions across diverse demographic segments. Market penetration is expected to increase from XX% in 2025 to YY% by 2033. Technological advancements such as near-field communication (NFC) technology and biometric authentication are further enhancing security and convenience, driving wider adoption. Consumer behavior is shifting towards cashless transactions and digital financial services, with mobile money playing a pivotal role in this transformation.
Dominant Regions, Countries, or Segments in Mobile Money
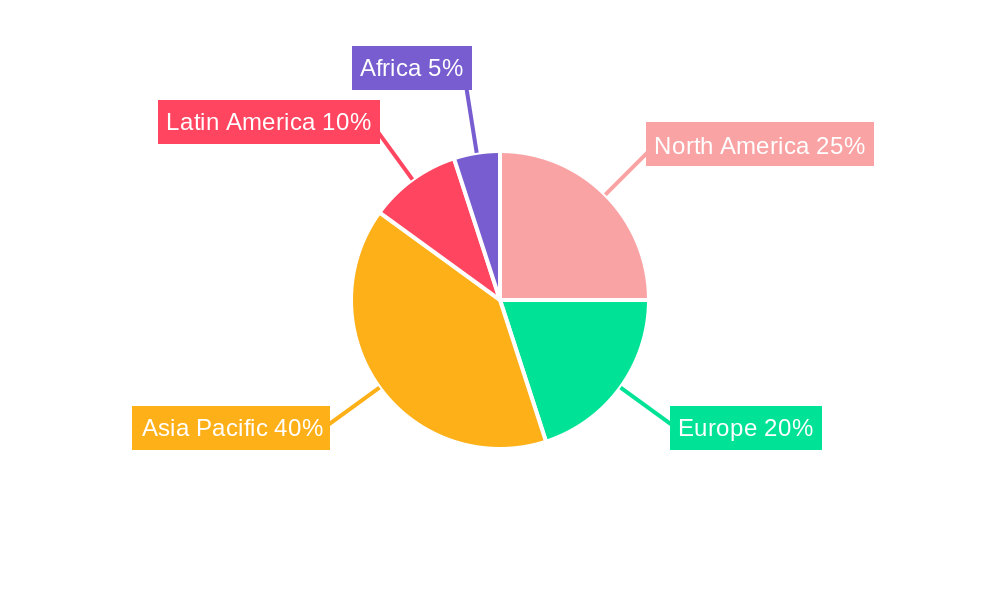
This section identifies the leading regions and segments driving market growth, analyzing dominance factors, market share, and growth potential. Sub-Saharan Africa currently dominates the global mobile money market, driven by high mobile penetration, a large unbanked population, and supportive regulatory frameworks. Key drivers in this region include:
- High Mobile Penetration: Extensive mobile network coverage provides widespread access to mobile money services.
- Financial Inclusion Initiatives: Government-led efforts to promote financial inclusion are facilitating wider adoption.
- Innovative Business Models: Local players are developing tailored mobile money solutions catering to specific needs and preferences.
Other regions, such as South Asia and Latin America, exhibit significant growth potential. Market share and growth are influenced by factors such as economic development, regulatory policies, technological infrastructure, and consumer behavior.
Mobile Money Product Landscape
The mobile money product landscape is characterized by continuous innovation, encompassing diverse offerings such as person-to-person (P2P) payments, merchant payments, bill payments, micro-loans, and savings accounts. These services are integrated within mobile applications, USSD platforms, and other channels, offering seamless access for users. Key innovations include advanced security features, such as biometric authentication and tokenization, enhancing the security and trustworthiness of mobile money transactions. The adoption of blockchain technology is also gaining traction, promising greater transparency and efficiency in cross-border payments.
Key Drivers, Barriers & Challenges in Mobile Money
Key Drivers: The mobile money market is driven by the rising adoption of smartphones, increasing financial inclusion initiatives, and the growing demand for convenient and secure payment solutions. Government regulations fostering digital payments, alongside partnerships between mobile network operators and financial institutions, further accelerate market growth.
Key Challenges: Challenges include infrastructure limitations in some regions, security concerns regarding fraud and data breaches, and regulatory complexities across different jurisdictions. The lack of interoperability between different mobile money platforms also limits the growth of the industry. These challenges, coupled with competitive pressures from established financial institutions and other digital payment providers, can affect market growth projections.
Emerging Opportunities in Mobile Money
Emerging opportunities encompass the expansion into untapped markets, particularly in rural and underserved areas. The integration of mobile money with other financial services, such as micro-loans and insurance products, presents significant potential. The emergence of innovative applications, such as mobile-based agricultural financing and supply chain management solutions, also offers considerable scope for growth. Furthermore, the increasing integration with e-commerce platforms presents a significant growth avenue for mobile money services.
Growth Accelerators in the Mobile Money Industry
Long-term growth is driven by technological advancements, strategic partnerships, and market expansion. The integration of artificial intelligence (AI) and machine learning (ML) for enhanced security and personalized services, coupled with the expansion of mobile money into new geographical markets and service offerings, will further fuel growth.
Key Players Shaping the Mobile Money Market
- Vodafone
- Gemalto
- FIS
- Mastercard
- Bharti Airtel
- Orange
- Monitise
- Mahindra Comviva
- PayPal
Notable Milestones in Mobile Money Sector
- 2020, Q2: Launch of a new mobile money service in Kenya by Safaricom.
- 2021, Q4: Partnership between Vodafone and a major bank for mobile banking services.
- 2022, Q1: Regulatory changes in Nigeria promote greater mobile money adoption.
- 2023, Q3: Google Pay integrates with a major mobile money platform in India.
(Further milestones can be added based on available data.)
In-Depth Mobile Money Market Outlook
The future of the mobile money market is promising, characterized by sustained growth driven by technological advancements and increasing financial inclusion. Strategic partnerships and expansion into underserved markets will play crucial roles in shaping the industry’s future landscape. The market is poised for considerable expansion, presenting attractive opportunities for both established players and emerging fintech companies.
Mobile Money Segmentation
-
1. Application
- 1.1. Media, Entertainment
- 1.2. Medical
- 1.3. Retail
- 1.4. Tourism
- 1.5. Hotel
- 1.6. Transportation And Logistics
- 1.7. Energy, Utilities
- 1.8. Other
-
2. Types
- 2.1. P2P
- 2.2. P2B
- 2.3. B2P
- 2.4. B2B
Mobile Money Segmentation By Geography
-
1. North America
- 1.1. United States
- 1.2. Canada
- 1.3. Mexico
-
2. South America
- 2.1. Brazil
- 2.2. Argentina
- 2.3. Rest of South America
-
3. Europe
- 3.1. United Kingdom
- 3.2. Germany
- 3.3. France
- 3.4. Italy
- 3.5. Spain
- 3.6. Russia
- 3.7. Benelux
- 3.8. Nordics
- 3.9. Rest of Europe
-
4. Middle East & Africa
- 4.1. Turkey
- 4.2. Israel
- 4.3. GCC
- 4.4. North Africa
- 4.5. South Africa
- 4.6. Rest of Middle East & Africa
-
5. Asia Pacific
- 5.1. China
- 5.2. India
- 5.3. Japan
- 5.4. South Korea
- 5.5. ASEAN
- 5.6. Oceania
- 5.7. Rest of Asia Pacific
Mobile Money REPORT HIGHLIGHTS
| Aspects | Details |
|---|---|
| Study Period | 2019-2033 |
| Base Year | 2024 |
| Estimated Year | 2025 |
| Forecast Period | 2025-2033 |
| Historical Period | 2019-2024 |
| Growth Rate | CAGR of 21.2% from 2019-2033 |
| Segmentation |
|
Table of Contents
- 1. Introduction
- 1.1. Research Scope
- 1.2. Market Segmentation
- 1.3. Research Methodology
- 1.4. Definitions and Assumptions
- 2. Executive Summary
- 2.1. Introduction
- 3. Market Dynamics
- 3.1. Introduction
- 3.2. Market Drivers
- 3.3. Market Restrains
- 3.4. Market Trends
- 4. Market Factor Analysis
- 4.1. Porters Five Forces
- 4.2. Supply/Value Chain
- 4.3. PESTEL analysis
- 4.4. Market Entropy
- 4.5. Patent/Trademark Analysis
- 5. Global Mobile Money Analysis, Insights and Forecast, 2019-2031
- 5.1. Market Analysis, Insights and Forecast - by Application
- 5.1.1. Media, Entertainment
- 5.1.2. Medical
- 5.1.3. Retail
- 5.1.4. Tourism
- 5.1.5. Hotel
- 5.1.6. Transportation And Logistics
- 5.1.7. Energy, Utilities
- 5.1.8. Other
- 5.2. Market Analysis, Insights and Forecast - by Types
- 5.2.1. P2P
- 5.2.2. P2B
- 5.2.3. B2P
- 5.2.4. B2B
- 5.3. Market Analysis, Insights and Forecast - by Region
- 5.3.1. North America
- 5.3.2. South America
- 5.3.3. Europe
- 5.3.4. Middle East & Africa
- 5.3.5. Asia Pacific
- 5.1. Market Analysis, Insights and Forecast - by Application
- 6. North America Mobile Money Analysis, Insights and Forecast, 2019-2031
- 6.1. Market Analysis, Insights and Forecast - by Application
- 6.1.1. Media, Entertainment
- 6.1.2. Medical
- 6.1.3. Retail
- 6.1.4. Tourism
- 6.1.5. Hotel
- 6.1.6. Transportation And Logistics
- 6.1.7. Energy, Utilities
- 6.1.8. Other
- 6.2. Market Analysis, Insights and Forecast - by Types
- 6.2.1. P2P
- 6.2.2. P2B
- 6.2.3. B2P
- 6.2.4. B2B
- 6.1. Market Analysis, Insights and Forecast - by Application
- 7. South America Mobile Money Analysis, Insights and Forecast, 2019-2031
- 7.1. Market Analysis, Insights and Forecast - by Application
- 7.1.1. Media, Entertainment
- 7.1.2. Medical
- 7.1.3. Retail
- 7.1.4. Tourism
- 7.1.5. Hotel
- 7.1.6. Transportation And Logistics
- 7.1.7. Energy, Utilities
- 7.1.8. Other
- 7.2. Market Analysis, Insights and Forecast - by Types
- 7.2.1. P2P
- 7.2.2. P2B
- 7.2.3. B2P
- 7.2.4. B2B
- 7.1. Market Analysis, Insights and Forecast - by Application
- 8. Europe Mobile Money Analysis, Insights and Forecast, 2019-2031
- 8.1. Market Analysis, Insights and Forecast - by Application
- 8.1.1. Media, Entertainment
- 8.1.2. Medical
- 8.1.3. Retail
- 8.1.4. Tourism
- 8.1.5. Hotel
- 8.1.6. Transportation And Logistics
- 8.1.7. Energy, Utilities
- 8.1.8. Other
- 8.2. Market Analysis, Insights and Forecast - by Types
- 8.2.1. P2P
- 8.2.2. P2B
- 8.2.3. B2P
- 8.2.4. B2B
- 8.1. Market Analysis, Insights and Forecast - by Application
- 9. Middle East & Africa Mobile Money Analysis, Insights and Forecast, 2019-2031
- 9.1. Market Analysis, Insights and Forecast - by Application
- 9.1.1. Media, Entertainment
- 9.1.2. Medical
- 9.1.3. Retail
- 9.1.4. Tourism
- 9.1.5. Hotel
- 9.1.6. Transportation And Logistics
- 9.1.7. Energy, Utilities
- 9.1.8. Other
- 9.2. Market Analysis, Insights and Forecast - by Types
- 9.2.1. P2P
- 9.2.2. P2B
- 9.2.3. B2P
- 9.2.4. B2B
- 9.1. Market Analysis, Insights and Forecast - by Application
- 10. Asia Pacific Mobile Money Analysis, Insights and Forecast, 2019-2031
- 10.1. Market Analysis, Insights and Forecast - by Application
- 10.1.1. Media, Entertainment
- 10.1.2. Medical
- 10.1.3. Retail
- 10.1.4. Tourism
- 10.1.5. Hotel
- 10.1.6. Transportation And Logistics
- 10.1.7. Energy, Utilities
- 10.1.8. Other
- 10.2. Market Analysis, Insights and Forecast - by Types
- 10.2.1. P2P
- 10.2.2. P2B
- 10.2.3. B2P
- 10.2.4. B2B
- 10.1. Market Analysis, Insights and Forecast - by Application
- 11. Competitive Analysis
- 11.1. Global Market Share Analysis 2024
- 11.2. Company Profiles
- 11.2.1 Vodafone
- 11.2.1.1. Overview
- 11.2.1.2. Products
- 11.2.1.3. SWOT Analysis
- 11.2.1.4. Recent Developments
- 11.2.1.5. Financials (Based on Availability)
- 11.2.2 Gemalto
- 11.2.2.1. Overview
- 11.2.2.2. Products
- 11.2.2.3. SWOT Analysis
- 11.2.2.4. Recent Developments
- 11.2.2.5. Financials (Based on Availability)
- 11.2.3 FIS
- 11.2.3.1. Overview
- 11.2.3.2. Products
- 11.2.3.3. SWOT Analysis
- 11.2.3.4. Recent Developments
- 11.2.3.5. Financials (Based on Availability)
- 11.2.4 Google
- 11.2.4.1. Overview
- 11.2.4.2. Products
- 11.2.4.3. SWOT Analysis
- 11.2.4.4. Recent Developments
- 11.2.4.5. Financials (Based on Availability)
- 11.2.5 Mastercard
- 11.2.5.1. Overview
- 11.2.5.2. Products
- 11.2.5.3. SWOT Analysis
- 11.2.5.4. Recent Developments
- 11.2.5.5. Financials (Based on Availability)
- 11.2.6 Bharti Airtel
- 11.2.6.1. Overview
- 11.2.6.2. Products
- 11.2.6.3. SWOT Analysis
- 11.2.6.4. Recent Developments
- 11.2.6.5. Financials (Based on Availability)
- 11.2.7 Orange
- 11.2.7.1. Overview
- 11.2.7.2. Products
- 11.2.7.3. SWOT Analysis
- 11.2.7.4. Recent Developments
- 11.2.7.5. Financials (Based on Availability)
- 11.2.8 Monitise
- 11.2.8.1. Overview
- 11.2.8.2. Products
- 11.2.8.3. SWOT Analysis
- 11.2.8.4. Recent Developments
- 11.2.8.5. Financials (Based on Availability)
- 11.2.9 Mahindra Comviva
- 11.2.9.1. Overview
- 11.2.9.2. Products
- 11.2.9.3. SWOT Analysis
- 11.2.9.4. Recent Developments
- 11.2.9.5. Financials (Based on Availability)
- 11.2.10 PayPal
- 11.2.10.1. Overview
- 11.2.10.2. Products
- 11.2.10.3. SWOT Analysis
- 11.2.10.4. Recent Developments
- 11.2.10.5. Financials (Based on Availability)
- 11.2.1 Vodafone
List of Figures
- Figure 1: Global Mobile Money Revenue Breakdown (million, %) by Region 2024 & 2032
- Figure 2: North America Mobile Money Revenue (million), by Application 2024 & 2032
- Figure 3: North America Mobile Money Revenue Share (%), by Application 2024 & 2032
- Figure 4: North America Mobile Money Revenue (million), by Types 2024 & 2032
- Figure 5: North America Mobile Money Revenue Share (%), by Types 2024 & 2032
- Figure 6: North America Mobile Money Revenue (million), by Country 2024 & 2032
- Figure 7: North America Mobile Money Revenue Share (%), by Country 2024 & 2032
- Figure 8: South America Mobile Money Revenue (million), by Application 2024 & 2032
- Figure 9: South America Mobile Money Revenue Share (%), by Application 2024 & 2032
- Figure 10: South America Mobile Money Revenue (million), by Types 2024 & 2032
- Figure 11: South America Mobile Money Revenue Share (%), by Types 2024 & 2032
- Figure 12: South America Mobile Money Revenue (million), by Country 2024 & 2032
- Figure 13: South America Mobile Money Revenue Share (%), by Country 2024 & 2032
- Figure 14: Europe Mobile Money Revenue (million), by Application 2024 & 2032
- Figure 15: Europe Mobile Money Revenue Share (%), by Application 2024 & 2032
- Figure 16: Europe Mobile Money Revenue (million), by Types 2024 & 2032
- Figure 17: Europe Mobile Money Revenue Share (%), by Types 2024 & 2032
- Figure 18: Europe Mobile Money Revenue (million), by Country 2024 & 2032
- Figure 19: Europe Mobile Money Revenue Share (%), by Country 2024 & 2032
- Figure 20: Middle East & Africa Mobile Money Revenue (million), by Application 2024 & 2032
- Figure 21: Middle East & Africa Mobile Money Revenue Share (%), by Application 2024 & 2032
- Figure 22: Middle East & Africa Mobile Money Revenue (million), by Types 2024 & 2032
- Figure 23: Middle East & Africa Mobile Money Revenue Share (%), by Types 2024 & 2032
- Figure 24: Middle East & Africa Mobile Money Revenue (million), by Country 2024 & 2032
- Figure 25: Middle East & Africa Mobile Money Revenue Share (%), by Country 2024 & 2032
- Figure 26: Asia Pacific Mobile Money Revenue (million), by Application 2024 & 2032
- Figure 27: Asia Pacific Mobile Money Revenue Share (%), by Application 2024 & 2032
- Figure 28: Asia Pacific Mobile Money Revenue (million), by Types 2024 & 2032
- Figure 29: Asia Pacific Mobile Money Revenue Share (%), by Types 2024 & 2032
- Figure 30: Asia Pacific Mobile Money Revenue (million), by Country 2024 & 2032
- Figure 31: Asia Pacific Mobile Money Revenue Share (%), by Country 2024 & 2032
List of Tables
- Table 1: Global Mobile Money Revenue million Forecast, by Region 2019 & 2032
- Table 2: Global Mobile Money Revenue million Forecast, by Application 2019 & 2032
- Table 3: Global Mobile Money Revenue million Forecast, by Types 2019 & 2032
- Table 4: Global Mobile Money Revenue million Forecast, by Region 2019 & 2032
- Table 5: Global Mobile Money Revenue million Forecast, by Application 2019 & 2032
- Table 6: Global Mobile Money Revenue million Forecast, by Types 2019 & 2032
- Table 7: Global Mobile Money Revenue million Forecast, by Country 2019 & 2032
- Table 8: United States Mobile Money Revenue (million) Forecast, by Application 2019 & 2032
- Table 9: Canada Mobile Money Revenue (million) Forecast, by Application 2019 & 2032
- Table 10: Mexico Mobile Money Revenue (million) Forecast, by Application 2019 & 2032
- Table 11: Global Mobile Money Revenue million Forecast, by Application 2019 & 2032
- Table 12: Global Mobile Money Revenue million Forecast, by Types 2019 & 2032
- Table 13: Global Mobile Money Revenue million Forecast, by Country 2019 & 2032
- Table 14: Brazil Mobile Money Revenue (million) Forecast, by Application 2019 & 2032
- Table 15: Argentina Mobile Money Revenue (million) Forecast, by Application 2019 & 2032
- Table 16: Rest of South America Mobile Money Revenue (million) Forecast, by Application 2019 & 2032
- Table 17: Global Mobile Money Revenue million Forecast, by Application 2019 & 2032
- Table 18: Global Mobile Money Revenue million Forecast, by Types 2019 & 2032
- Table 19: Global Mobile Money Revenue million Forecast, by Country 2019 & 2032
- Table 20: United Kingdom Mobile Money Revenue (million) Forecast, by Application 2019 & 2032
- Table 21: Germany Mobile Money Revenue (million) Forecast, by Application 2019 & 2032
- Table 22: France Mobile Money Revenue (million) Forecast, by Application 2019 & 2032
- Table 23: Italy Mobile Money Revenue (million) Forecast, by Application 2019 & 2032
- Table 24: Spain Mobile Money Revenue (million) Forecast, by Application 2019 & 2032
- Table 25: Russia Mobile Money Revenue (million) Forecast, by Application 2019 & 2032
- Table 26: Benelux Mobile Money Revenue (million) Forecast, by Application 2019 & 2032
- Table 27: Nordics Mobile Money Revenue (million) Forecast, by Application 2019 & 2032
- Table 28: Rest of Europe Mobile Money Revenue (million) Forecast, by Application 2019 & 2032
- Table 29: Global Mobile Money Revenue million Forecast, by Application 2019 & 2032
- Table 30: Global Mobile Money Revenue million Forecast, by Types 2019 & 2032
- Table 31: Global Mobile Money Revenue million Forecast, by Country 2019 & 2032
- Table 32: Turkey Mobile Money Revenue (million) Forecast, by Application 2019 & 2032
- Table 33: Israel Mobile Money Revenue (million) Forecast, by Application 2019 & 2032
- Table 34: GCC Mobile Money Revenue (million) Forecast, by Application 2019 & 2032
- Table 35: North Africa Mobile Money Revenue (million) Forecast, by Application 2019 & 2032
- Table 36: South Africa Mobile Money Revenue (million) Forecast, by Application 2019 & 2032
- Table 37: Rest of Middle East & Africa Mobile Money Revenue (million) Forecast, by Application 2019 & 2032
- Table 38: Global Mobile Money Revenue million Forecast, by Application 2019 & 2032
- Table 39: Global Mobile Money Revenue million Forecast, by Types 2019 & 2032
- Table 40: Global Mobile Money Revenue million Forecast, by Country 2019 & 2032
- Table 41: China Mobile Money Revenue (million) Forecast, by Application 2019 & 2032
- Table 42: India Mobile Money Revenue (million) Forecast, by Application 2019 & 2032
- Table 43: Japan Mobile Money Revenue (million) Forecast, by Application 2019 & 2032
- Table 44: South Korea Mobile Money Revenue (million) Forecast, by Application 2019 & 2032
- Table 45: ASEAN Mobile Money Revenue (million) Forecast, by Application 2019 & 2032
- Table 46: Oceania Mobile Money Revenue (million) Forecast, by Application 2019 & 2032
- Table 47: Rest of Asia Pacific Mobile Money Revenue (million) Forecast, by Application 2019 & 2032
Frequently Asked Questions
1. What is the projected Compound Annual Growth Rate (CAGR) of the Mobile Money?
The projected CAGR is approximately 21.2%.
2. Which companies are prominent players in the Mobile Money?
Key companies in the market include Vodafone, Gemalto, FIS, Google, Mastercard, Bharti Airtel, Orange, Monitise, Mahindra Comviva, PayPal.
3. What are the main segments of the Mobile Money?
The market segments include Application, Types.
4. Can you provide details about the market size?
The market size is estimated to be USD 44880 million as of 2022.
5. What are some drivers contributing to market growth?
N/A
6. What are the notable trends driving market growth?
N/A
7. Are there any restraints impacting market growth?
N/A
8. Can you provide examples of recent developments in the market?
N/A
9. What pricing options are available for accessing the report?
Pricing options include single-user, multi-user, and enterprise licenses priced at USD 2900.00, USD 4350.00, and USD 5800.00 respectively.
10. Is the market size provided in terms of value or volume?
The market size is provided in terms of value, measured in million.
11. Are there any specific market keywords associated with the report?
Yes, the market keyword associated with the report is "Mobile Money," which aids in identifying and referencing the specific market segment covered.
12. How do I determine which pricing option suits my needs best?
The pricing options vary based on user requirements and access needs. Individual users may opt for single-user licenses, while businesses requiring broader access may choose multi-user or enterprise licenses for cost-effective access to the report.
13. Are there any additional resources or data provided in the Mobile Money report?
While the report offers comprehensive insights, it's advisable to review the specific contents or supplementary materials provided to ascertain if additional resources or data are available.
14. How can I stay updated on further developments or reports in the Mobile Money?
To stay informed about further developments, trends, and reports in the Mobile Money, consider subscribing to industry newsletters, following relevant companies and organizations, or regularly checking reputable industry news sources and publications.
Methodology
Step 1 - Identification of Relevant Samples Size from Population Database


Step 2 - Approaches for Defining Global Market Size (Value, Volume* & Price*)

Note*: In applicable scenarios
Step 3 - Data Sources
Primary Research
- Web Analytics
- Survey Reports
- Research Institute
- Latest Research Reports
- Opinion Leaders
Secondary Research
- Annual Reports
- White Paper
- Latest Press Release
- Industry Association
- Paid Database
- Investor Presentations

Step 4 - Data Triangulation
Involves using different sources of information in order to increase the validity of a study
These sources are likely to be stakeholders in a program - participants, other researchers, program staff, other community members, and so on.
Then we put all data in single framework & apply various statistical tools to find out the dynamic on the market.
During the analysis stage, feedback from the stakeholder groups would be compared to determine areas of agreement as well as areas of divergence


