

Key Insights
The global Mineral Exploration Services market is poised for substantial expansion, projected to reach an estimated $4158 million by 2025. This robust growth is underpinned by a compelling CAGR of 12.4% anticipated between 2025 and 2033. A primary driver for this upward trajectory is the increasing global demand for essential minerals, fueled by burgeoning industries such as renewable energy, electric vehicles, and advanced electronics. The strategic importance of securing diverse and sustainable mineral resources is compelling governments and private enterprises alike to invest heavily in exploration activities. Technological advancements in geophysical surveying, remote sensing, and data analytics are significantly enhancing the efficiency and accuracy of mineral discovery, thereby reducing exploration risks and costs. Furthermore, supportive government policies, including streamlined permitting processes and incentives for mineral exploration, are creating a favorable investment climate. The market's expansion is also being propelled by a growing focus on discovering critical minerals, vital for the energy transition and technological innovation.
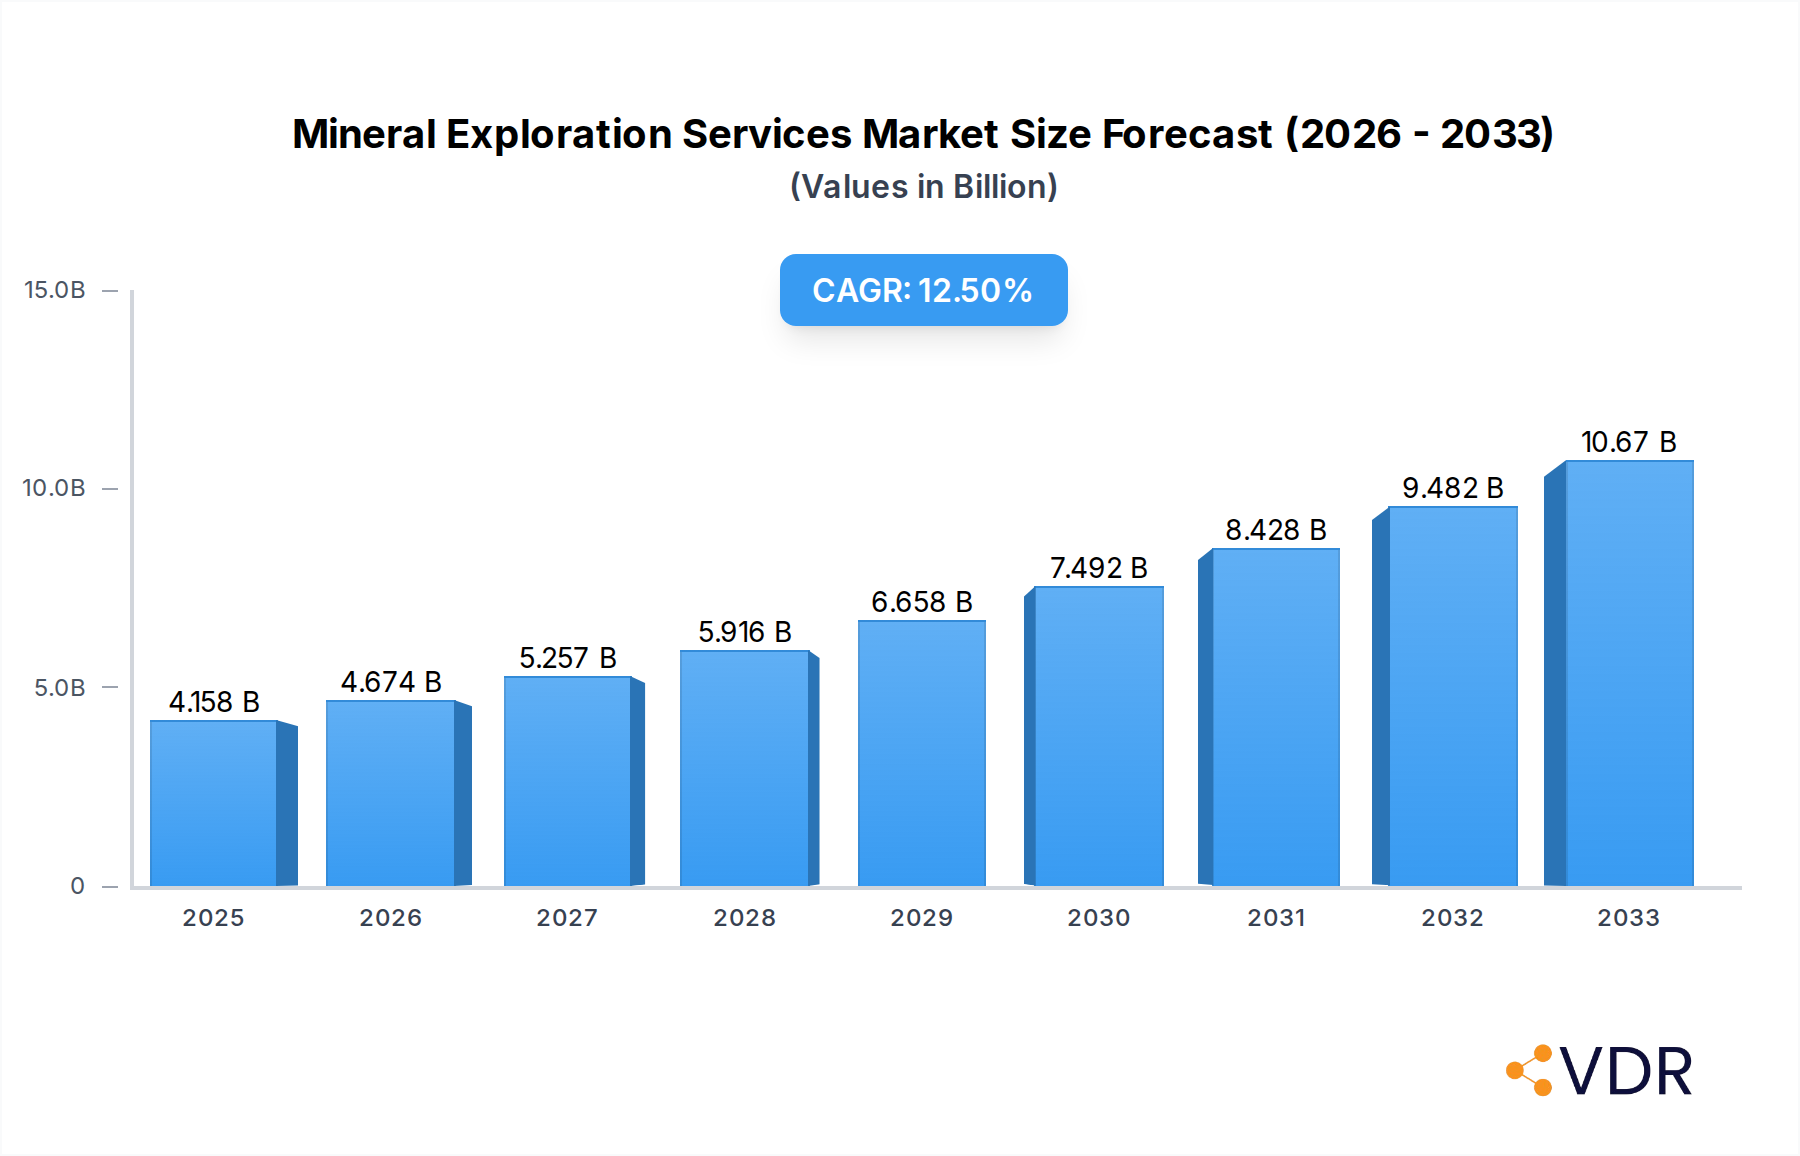
Mineral Exploration Services Market Size (In Billion)
The market's segmentation reveals a significant role for services supporting the exploration of Iron Mines and Copper Mines, reflecting their foundational importance in global industrial supply chains. However, the burgeoning demand for Rare Earth Elements, crucial for high-tech applications, is also driving substantial growth within this segment. Geographically, the Asia Pacific region, led by China and India, is emerging as a dominant force, owing to its vast mineral reserves and significant investment in mining infrastructure. North America and Europe also represent substantial markets, driven by mature exploration sectors and a strong focus on technological innovation. Key trends include the increasing adoption of AI and machine learning for predictive exploration, a heightened emphasis on environmentally responsible exploration practices, and the growing outsourcing of exploration services to specialized third-party providers. Despite this positive outlook, potential restraints such as stringent environmental regulations, fluctuating commodity prices, and geopolitical uncertainties could pose challenges to the market's unhindered growth.

Mineral Exploration Services Company Market Share
Unlocking Earth's Potential: A Comprehensive Report on the Global Mineral Exploration Services Market
This in-depth report provides a definitive analysis of the global Mineral Exploration Services market, charting its trajectory from 2019 to 2033. With a base year of 2025 and an estimated year also of 2025, the forecast period of 2025-2033 offers crucial insights into future growth drivers, technological advancements, and market dynamics. Covering historical performance from 2019-2024, this research is indispensable for stakeholders seeking to understand and capitalize on the evolving landscape of mineral discovery and resource assessment. We delve into parent and child markets, exploring the intricate relationships between global trends and specific application segments like Iron Mine, Copper Mine, Rare Earth Mine, and Others, alongside service types including Project Planning, Permitting, and Implementation, Geological and Structural Field Mapping, and Ground Geophysical Survey Design and Data Acquisition.
Mineral Exploration Services Market Dynamics & Structure
The global Mineral Exploration Services market exhibits a XX% concentration, characterized by a blend of established global leaders and emerging regional specialists. Technological innovation is a paramount driver, with advancements in AI-powered data analysis, drone-based surveying, and hyperspectral imaging revolutionizing exploration efficiency and accuracy. Regulatory frameworks, particularly concerning environmental impact assessments and permitting processes, significantly shape market entry and operational strategies. Competitive product substitutes, such as advanced remote sensing technologies, present both challenges and opportunities for traditional service providers. End-user demographics are increasingly driven by the growing demand for critical minerals essential for the green energy transition, alongside the persistent need for base metals and precious metals. Merger and acquisition (M&A) trends indicate a consolidation phase, with XX significant deals recorded in the historical period, aimed at expanding service portfolios and geographic reach.
- Market Concentration: A few key players hold substantial market share, but the landscape is fragmenting with specialized regional providers.
- Technological Innovation: Key drivers include AI for data interpretation, drone technology for surveys, and advanced geophysical techniques.
- Regulatory Frameworks: Strict environmental regulations and streamlined permitting processes influence project timelines and costs.
- Competitive Substitutes: Remote sensing and advanced geological modeling offer alternatives to traditional field-based methods.
- End-User Demographics: Demand is robust from sectors requiring base metals, precious metals, and increasingly, critical minerals for renewable energy.
- M&A Trends: Consolidation is evident, with companies seeking to acquire specialized expertise and expand their service offerings.
Mineral Exploration Services Growth Trends & Insights
The global Mineral Exploration Services market is projected to experience a robust Compound Annual Growth Rate (CAGR) of XX% from 2025 to 2033, reaching an estimated market size of USD XXX million by the end of the forecast period. This significant growth is underpinned by several critical trends, including the escalating demand for critical minerals essential for electric vehicles, battery technology, and renewable energy infrastructure. The adoption rate of advanced technologies like artificial intelligence (AI) for geological data interpretation and drone-based geophysical surveys is accelerating, leading to more efficient and cost-effective exploration activities.
Technological disruptions are continuously reshaping the industry. For instance, the integration of machine learning algorithms is enhancing the accuracy of predicting mineral deposits, thereby reducing exploration risks and costs. Furthermore, innovations in remote sensing technologies, such as hyperspectral imaging and satellite-based magnetometry, are providing higher resolution data, allowing geologists to identify potential mineral targets from a distance with unprecedented precision. These advancements are critical in unlocking resources in challenging and previously inaccessible terrains.
Consumer behavior shifts are also playing a pivotal role. Governments worldwide are increasingly recognizing the strategic importance of securing domestic mineral supplies, leading to policy reforms and incentives that encourage exploration activities. This translates into increased investment by mining companies, who in turn are seeking specialized exploration services to identify and validate new resource opportunities. The growing emphasis on sustainable and responsible mining practices is also driving the demand for exploration services that incorporate advanced environmental impact assessment tools and methodologies from the outset of a project.
Market penetration of specialized exploration services is deepening as companies recognize the return on investment from early-stage geological assessment and risk mitigation. The shift from purely discovery-focused exploration to more comprehensive resource definition and project development support is also evident. This expansion of service offerings, from initial target identification to detailed feasibility studies, contributes to the market's overall growth trajectory. The interplay of these factors—technological innovation, evolving demand, supportive policies, and strategic service expansion—creates a dynamic and rapidly expanding market for Mineral Exploration Services.
Dominant Regions, Countries, or Segments in Mineral Exploration Services
The Iron Mine segment, within the broader Application category of Mineral Exploration Services, is poised to be a dominant force in driving market growth. This dominance is propelled by several key factors, including the enduring global demand for steel in construction, infrastructure development, and manufacturing. As developing economies continue to expand, their need for iron ore remains substantial, ensuring a consistent demand for exploration services focused on identifying and delineating iron ore deposits. The segment's market share is estimated at XX% of the total application market in 2025, with a projected growth potential of XX% over the forecast period.
Within the Iron Mine segment, Australia stands out as a leading country for mineral exploration, particularly for iron ore. Its established mining industry, favorable regulatory environment, and significant known iron ore reserves make it a prime destination for exploration investment. Furthermore, the country’s commitment to technological adoption in exploration, coupled with its robust geological survey infrastructure, further solidifies its leadership position.
- Application Segment Dominance: The Iron Mine application segment is leading market growth due to sustained global demand for steel in infrastructure and manufacturing.
- Market Share: Estimated at XX% of the total application market in 2025.
- Growth Potential: Projected to grow at XX% over the forecast period.
- Geographic Leadership: Australia is a dominant country in mineral exploration, especially for iron ore, due to its established industry and significant reserves.
- Key Drivers: Robust economic policies, advanced geological infrastructure, and technological adoption.
- Service Type Trends: While all service types are crucial, Ground Geophysical Survey Design and Data Acquisition is experiencing heightened demand within the Iron Mine segment, contributing significantly to its growth. This is driven by the need for efficient subsurface exploration to identify viable ore bodies.
- Impact: Essential for pinpointing iron ore deposits efficiently.
- Economic Policies: Favorable government policies in key resource-rich nations encourage significant investment in iron ore exploration, boosting demand for associated services.
- Infrastructure Development: Ongoing global infrastructure projects directly correlate with the demand for iron ore, creating a sustained need for exploration services.
Mineral Exploration Services Product Landscape
The product landscape of Mineral Exploration Services is characterized by an increasing sophistication of integrated technology solutions and specialized analytical tools. Innovations are primarily focused on enhancing data acquisition efficiency, improving interpretation accuracy, and reducing exploration time and costs. Companies are developing advanced geophysical instruments for ground-based surveys, offering higher resolution and deeper penetration capabilities. Furthermore, software platforms leveraging AI and machine learning are becoming integral, enabling rapid analysis of vast geological datasets, including seismic, magnetic, and gravity data. Unique selling propositions often lie in the seamless integration of these diverse technologies, providing clients with end-to-end solutions from initial field mapping to detailed resource modeling.
Key Drivers, Barriers & Challenges in Mineral Exploration Services
Key Drivers:
- Rising Demand for Critical Minerals: The global transition to renewable energy and electric vehicles is fueling unprecedented demand for minerals like lithium, cobalt, and rare earth elements, directly stimulating exploration efforts.
- Technological Advancements: Innovations in AI-driven data analysis, drone technology, and advanced geophysical surveying are making exploration more efficient, accurate, and cost-effective.
- Government Initiatives and Supportive Policies: Many nations are implementing policies and incentives to encourage domestic mineral exploration and reduce reliance on imports, particularly for strategic resources.
- Global Infrastructure Development: Continued investment in global infrastructure projects necessitates a steady supply of base metals like iron and copper, driving exploration activities.
Barriers & Challenges:
- High Capital Expenditure and Risk: Mineral exploration is inherently capital-intensive and carries a high risk of failure, often requiring substantial upfront investment with no guarantee of discovery.
- Stringent Environmental Regulations: Increasingly complex and stringent environmental regulations and permitting processes can lead to delays, increased costs, and hinder project viability.
- Geopolitical Instability and Social License to Operate: Political instability in certain regions and challenges in obtaining social license to operate from local communities can pose significant obstacles to exploration projects.
- Skilled Workforce Shortages: A global shortage of experienced geologists, geophysicists, and data scientists can limit the capacity and pace of exploration activities.
- Supply Chain Disruptions: Vulnerabilities in the supply chain for exploration equipment and consumables can impact project timelines and operational efficiency.
Emerging Opportunities in Mineral Exploration Services
Emerging opportunities in the Mineral Exploration Services sector lie in the increasing focus on critical minerals required for the green economy, particularly in underexplored regions with emerging resource potential. The development of advanced AI-driven predictive modeling for mineral prospectivity is creating new avenues for more targeted and efficient exploration. Furthermore, the demand for specialized services related to carbon capture, utilization, and storage (CCUS) projects, which often intersect with geological surveys, presents an untapped market. The rise of junior exploration companies with innovative approaches also offers partnership and service provision opportunities.
Growth Accelerators in the Mineral Exploration Services Industry
Long-term growth in the Mineral Exploration Services industry is being significantly accelerated by breakthroughs in remote sensing technology, enabling wider and more detailed mapping of the Earth's surface. Strategic partnerships between exploration service providers and technology developers are crucial for integrating cutting-edge AI and machine learning capabilities into exploration workflows. Furthermore, market expansion strategies targeting emerging economies with rich, yet underdeveloped, mineral resources are critical growth accelerators. The continuous refinement of geophysical survey techniques for deeper and more complex geological formations will also sustain and amplify growth.
Key Players Shaping the Mineral Exploration Services Market
- Terrane Geoscience
- Equity Exploration
- SRK
- Aurum Global Exploration
- SGS
- SEMS Exploration Services
- Minrom
- Calibre Group
- DMT GROUP
- Longford Exploration Services
- AG Vision Mining
- Bureau Veritas
- Western Mining Services
- PT Geoservices
- HFG
- Xploration Services Greenland
- McElhanney
- GexplOre
- The MSA Group
- Fugro
- PT ANTAM Tbk
- Euro Exploration Services
- Noble Mineral Exploration
- DBM
- MTL
Notable Milestones in Mineral Exploration Services Sector
- 2021: Launch of AI-powered geological data interpretation platforms, significantly reducing analysis time by up to XX%.
- 2022: Increased adoption of drone-based magnetic and radiometric surveys, improving resolution by XX% in challenging terrains.
- 2023: Major mining companies announce significant investments in critical mineral exploration, particularly for lithium and cobalt deposits.
- 2024: Several key mergers and acquisitions consolidate market share, aimed at expanding service offerings in geophysical techniques.
- 2025 (Estimated): Introduction of hyperspectral imaging technology with enhanced mineral identification capabilities for airborne surveys.
- 2026 (Projected): Growing emphasis on ESG (Environmental, Social, and Governance) reporting integrated into exploration service packages.
In-Depth Mineral Exploration Services Market Outlook
The future outlook for the Mineral Exploration Services market is exceptionally positive, driven by the escalating global demand for minerals essential for technological advancement and the green energy transition. Growth accelerators include the continuous refinement of AI and machine learning applications for predictive geological modeling, promising more precise and cost-effective discovery. Strategic collaborations between service providers and mining majors will be paramount in navigating complex exploration projects and unlocking new resource frontiers. The industry's capacity to adapt to evolving environmental regulations and embrace sustainable exploration practices will further solidify its growth trajectory. The overall market potential remains substantial, with opportunities for innovation and expansion in both established and emerging resource-rich regions.
Mineral Exploration Services Segmentation
-
1. Application
- 1.1. Iron Mine
- 1.2. Copper Mine
- 1.3. Rare Earth Mine
- 1.4. Others
-
2. Types
- 2.1. Project Planning, Permitting, and Implementation
- 2.2. Geological and Structural Field Mapping
- 2.3. Ground Geophysical Survey Design and Data Acquisition
- 2.4. Others
Mineral Exploration Services Segmentation By Geography
-
1. North America
- 1.1. United States
- 1.2. Canada
- 1.3. Mexico
-
2. South America
- 2.1. Brazil
- 2.2. Argentina
- 2.3. Rest of South America
-
3. Europe
- 3.1. United Kingdom
- 3.2. Germany
- 3.3. France
- 3.4. Italy
- 3.5. Spain
- 3.6. Russia
- 3.7. Benelux
- 3.8. Nordics
- 3.9. Rest of Europe
-
4. Middle East & Africa
- 4.1. Turkey
- 4.2. Israel
- 4.3. GCC
- 4.4. North Africa
- 4.5. South Africa
- 4.6. Rest of Middle East & Africa
-
5. Asia Pacific
- 5.1. China
- 5.2. India
- 5.3. Japan
- 5.4. South Korea
- 5.5. ASEAN
- 5.6. Oceania
- 5.7. Rest of Asia Pacific
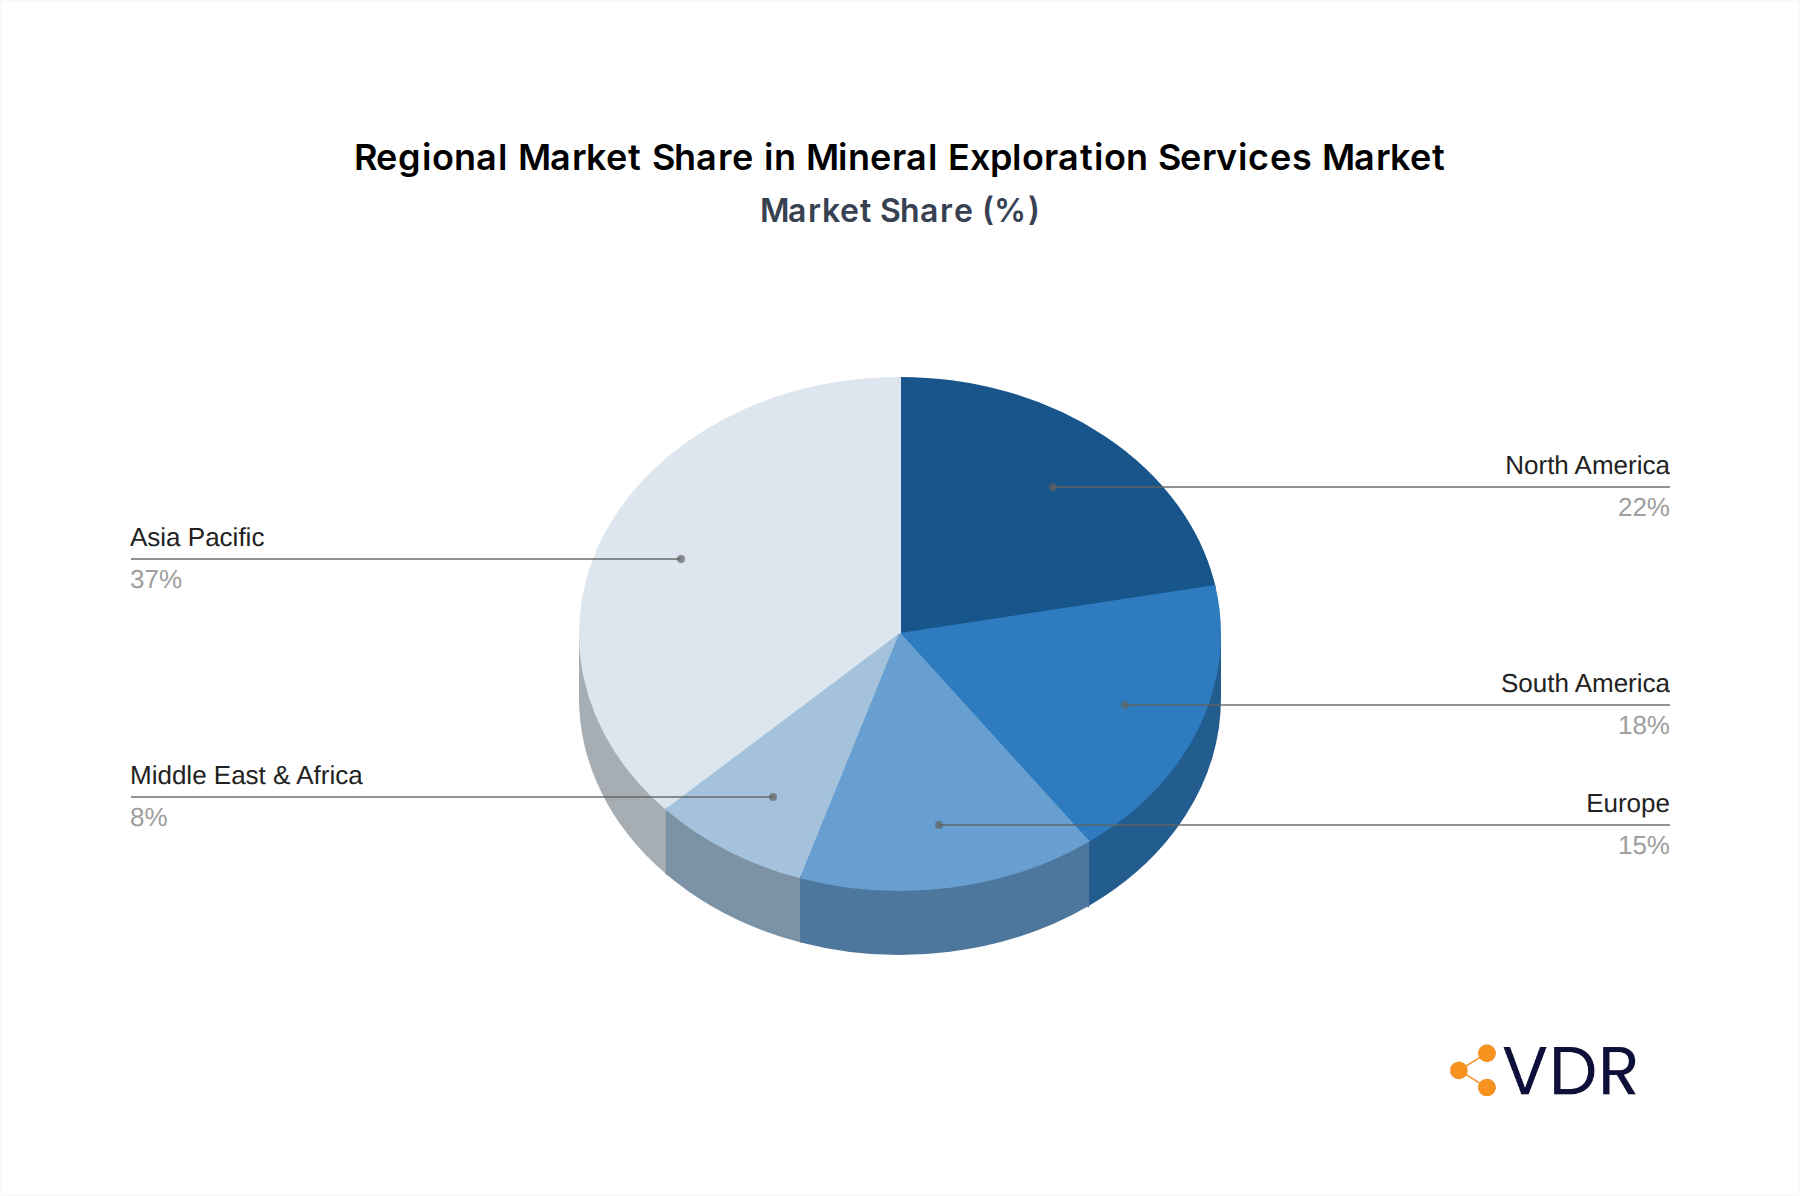
Mineral Exploration Services Regional Market Share
Geographic Coverage of Mineral Exploration Services
Mineral Exploration Services REPORT HIGHLIGHTS
| Aspects | Details |
|---|---|
| Study Period | 2020-2034 |
| Base Year | 2025 |
| Estimated Year | 2026 |
| Forecast Period | 2026-2034 |
| Historical Period | 2020-2025 |
| Growth Rate | CAGR of 12.4% from 2020-2034 |
| Segmentation |
|
Table of Contents
- 1. Introduction
- 1.1. Research Scope
- 1.2. Market Segmentation
- 1.3. Research Methodology
- 1.4. Definitions and Assumptions
- 2. Executive Summary
- 2.1. Introduction
- 3. Market Dynamics
- 3.1. Introduction
- 3.2. Market Drivers
- 3.3. Market Restrains
- 3.4. Market Trends
- 4. Market Factor Analysis
- 4.1. Porters Five Forces
- 4.2. Supply/Value Chain
- 4.3. PESTEL analysis
- 4.4. Market Entropy
- 4.5. Patent/Trademark Analysis
- 5. Global Mineral Exploration Services Analysis, Insights and Forecast, 2020-2032
- 5.1. Market Analysis, Insights and Forecast - by Application
- 5.1.1. Iron Mine
- 5.1.2. Copper Mine
- 5.1.3. Rare Earth Mine
- 5.1.4. Others
- 5.2. Market Analysis, Insights and Forecast - by Types
- 5.2.1. Project Planning, Permitting, and Implementation
- 5.2.2. Geological and Structural Field Mapping
- 5.2.3. Ground Geophysical Survey Design and Data Acquisition
- 5.2.4. Others
- 5.3. Market Analysis, Insights and Forecast - by Region
- 5.3.1. North America
- 5.3.2. South America
- 5.3.3. Europe
- 5.3.4. Middle East & Africa
- 5.3.5. Asia Pacific
- 5.1. Market Analysis, Insights and Forecast - by Application
- 6. North America Mineral Exploration Services Analysis, Insights and Forecast, 2020-2032
- 6.1. Market Analysis, Insights and Forecast - by Application
- 6.1.1. Iron Mine
- 6.1.2. Copper Mine
- 6.1.3. Rare Earth Mine
- 6.1.4. Others
- 6.2. Market Analysis, Insights and Forecast - by Types
- 6.2.1. Project Planning, Permitting, and Implementation
- 6.2.2. Geological and Structural Field Mapping
- 6.2.3. Ground Geophysical Survey Design and Data Acquisition
- 6.2.4. Others
- 6.1. Market Analysis, Insights and Forecast - by Application
- 7. South America Mineral Exploration Services Analysis, Insights and Forecast, 2020-2032
- 7.1. Market Analysis, Insights and Forecast - by Application
- 7.1.1. Iron Mine
- 7.1.2. Copper Mine
- 7.1.3. Rare Earth Mine
- 7.1.4. Others
- 7.2. Market Analysis, Insights and Forecast - by Types
- 7.2.1. Project Planning, Permitting, and Implementation
- 7.2.2. Geological and Structural Field Mapping
- 7.2.3. Ground Geophysical Survey Design and Data Acquisition
- 7.2.4. Others
- 7.1. Market Analysis, Insights and Forecast - by Application
- 8. Europe Mineral Exploration Services Analysis, Insights and Forecast, 2020-2032
- 8.1. Market Analysis, Insights and Forecast - by Application
- 8.1.1. Iron Mine
- 8.1.2. Copper Mine
- 8.1.3. Rare Earth Mine
- 8.1.4. Others
- 8.2. Market Analysis, Insights and Forecast - by Types
- 8.2.1. Project Planning, Permitting, and Implementation
- 8.2.2. Geological and Structural Field Mapping
- 8.2.3. Ground Geophysical Survey Design and Data Acquisition
- 8.2.4. Others
- 8.1. Market Analysis, Insights and Forecast - by Application
- 9. Middle East & Africa Mineral Exploration Services Analysis, Insights and Forecast, 2020-2032
- 9.1. Market Analysis, Insights and Forecast - by Application
- 9.1.1. Iron Mine
- 9.1.2. Copper Mine
- 9.1.3. Rare Earth Mine
- 9.1.4. Others
- 9.2. Market Analysis, Insights and Forecast - by Types
- 9.2.1. Project Planning, Permitting, and Implementation
- 9.2.2. Geological and Structural Field Mapping
- 9.2.3. Ground Geophysical Survey Design and Data Acquisition
- 9.2.4. Others
- 9.1. Market Analysis, Insights and Forecast - by Application
- 10. Asia Pacific Mineral Exploration Services Analysis, Insights and Forecast, 2020-2032
- 10.1. Market Analysis, Insights and Forecast - by Application
- 10.1.1. Iron Mine
- 10.1.2. Copper Mine
- 10.1.3. Rare Earth Mine
- 10.1.4. Others
- 10.2. Market Analysis, Insights and Forecast - by Types
- 10.2.1. Project Planning, Permitting, and Implementation
- 10.2.2. Geological and Structural Field Mapping
- 10.2.3. Ground Geophysical Survey Design and Data Acquisition
- 10.2.4. Others
- 10.1. Market Analysis, Insights and Forecast - by Application
- 11. Competitive Analysis
- 11.1. Global Market Share Analysis 2025
- 11.2. Company Profiles
- 11.2.1 Terrane Geoscience
- 11.2.1.1. Overview
- 11.2.1.2. Products
- 11.2.1.3. SWOT Analysis
- 11.2.1.4. Recent Developments
- 11.2.1.5. Financials (Based on Availability)
- 11.2.2 Equity Exploration
- 11.2.2.1. Overview
- 11.2.2.2. Products
- 11.2.2.3. SWOT Analysis
- 11.2.2.4. Recent Developments
- 11.2.2.5. Financials (Based on Availability)
- 11.2.3 SRK
- 11.2.3.1. Overview
- 11.2.3.2. Products
- 11.2.3.3. SWOT Analysis
- 11.2.3.4. Recent Developments
- 11.2.3.5. Financials (Based on Availability)
- 11.2.4 Aurum Global Exploration
- 11.2.4.1. Overview
- 11.2.4.2. Products
- 11.2.4.3. SWOT Analysis
- 11.2.4.4. Recent Developments
- 11.2.4.5. Financials (Based on Availability)
- 11.2.5 SGS
- 11.2.5.1. Overview
- 11.2.5.2. Products
- 11.2.5.3. SWOT Analysis
- 11.2.5.4. Recent Developments
- 11.2.5.5. Financials (Based on Availability)
- 11.2.6 SEMS Exploration Services
- 11.2.6.1. Overview
- 11.2.6.2. Products
- 11.2.6.3. SWOT Analysis
- 11.2.6.4. Recent Developments
- 11.2.6.5. Financials (Based on Availability)
- 11.2.7 Minrom
- 11.2.7.1. Overview
- 11.2.7.2. Products
- 11.2.7.3. SWOT Analysis
- 11.2.7.4. Recent Developments
- 11.2.7.5. Financials (Based on Availability)
- 11.2.8 Calibre Group
- 11.2.8.1. Overview
- 11.2.8.2. Products
- 11.2.8.3. SWOT Analysis
- 11.2.8.4. Recent Developments
- 11.2.8.5. Financials (Based on Availability)
- 11.2.9 DMT GROUP
- 11.2.9.1. Overview
- 11.2.9.2. Products
- 11.2.9.3. SWOT Analysis
- 11.2.9.4. Recent Developments
- 11.2.9.5. Financials (Based on Availability)
- 11.2.10 Longford Exploration Services
- 11.2.10.1. Overview
- 11.2.10.2. Products
- 11.2.10.3. SWOT Analysis
- 11.2.10.4. Recent Developments
- 11.2.10.5. Financials (Based on Availability)
- 11.2.11 AG Vision Mining
- 11.2.11.1. Overview
- 11.2.11.2. Products
- 11.2.11.3. SWOT Analysis
- 11.2.11.4. Recent Developments
- 11.2.11.5. Financials (Based on Availability)
- 11.2.12 Bureau Veritas
- 11.2.12.1. Overview
- 11.2.12.2. Products
- 11.2.12.3. SWOT Analysis
- 11.2.12.4. Recent Developments
- 11.2.12.5. Financials (Based on Availability)
- 11.2.13 Western Mining Services
- 11.2.13.1. Overview
- 11.2.13.2. Products
- 11.2.13.3. SWOT Analysis
- 11.2.13.4. Recent Developments
- 11.2.13.5. Financials (Based on Availability)
- 11.2.14 PT Geoservices
- 11.2.14.1. Overview
- 11.2.14.2. Products
- 11.2.14.3. SWOT Analysis
- 11.2.14.4. Recent Developments
- 11.2.14.5. Financials (Based on Availability)
- 11.2.15 HFG
- 11.2.15.1. Overview
- 11.2.15.2. Products
- 11.2.15.3. SWOT Analysis
- 11.2.15.4. Recent Developments
- 11.2.15.5. Financials (Based on Availability)
- 11.2.16 Xploration Services Greenland
- 11.2.16.1. Overview
- 11.2.16.2. Products
- 11.2.16.3. SWOT Analysis
- 11.2.16.4. Recent Developments
- 11.2.16.5. Financials (Based on Availability)
- 11.2.17 McElhanney
- 11.2.17.1. Overview
- 11.2.17.2. Products
- 11.2.17.3. SWOT Analysis
- 11.2.17.4. Recent Developments
- 11.2.17.5. Financials (Based on Availability)
- 11.2.18 GexplOre
- 11.2.18.1. Overview
- 11.2.18.2. Products
- 11.2.18.3. SWOT Analysis
- 11.2.18.4. Recent Developments
- 11.2.18.5. Financials (Based on Availability)
- 11.2.19 The MSA Group
- 11.2.19.1. Overview
- 11.2.19.2. Products
- 11.2.19.3. SWOT Analysis
- 11.2.19.4. Recent Developments
- 11.2.19.5. Financials (Based on Availability)
- 11.2.20 Fugro
- 11.2.20.1. Overview
- 11.2.20.2. Products
- 11.2.20.3. SWOT Analysis
- 11.2.20.4. Recent Developments
- 11.2.20.5. Financials (Based on Availability)
- 11.2.21 PT ANTAM Tbk
- 11.2.21.1. Overview
- 11.2.21.2. Products
- 11.2.21.3. SWOT Analysis
- 11.2.21.4. Recent Developments
- 11.2.21.5. Financials (Based on Availability)
- 11.2.22 Euro Exploration Services
- 11.2.22.1. Overview
- 11.2.22.2. Products
- 11.2.22.3. SWOT Analysis
- 11.2.22.4. Recent Developments
- 11.2.22.5. Financials (Based on Availability)
- 11.2.23 Noble Mineral Exploration
- 11.2.23.1. Overview
- 11.2.23.2. Products
- 11.2.23.3. SWOT Analysis
- 11.2.23.4. Recent Developments
- 11.2.23.5. Financials (Based on Availability)
- 11.2.24 DBM
- 11.2.24.1. Overview
- 11.2.24.2. Products
- 11.2.24.3. SWOT Analysis
- 11.2.24.4. Recent Developments
- 11.2.24.5. Financials (Based on Availability)
- 11.2.25 MTL
- 11.2.25.1. Overview
- 11.2.25.2. Products
- 11.2.25.3. SWOT Analysis
- 11.2.25.4. Recent Developments
- 11.2.25.5. Financials (Based on Availability)
- 11.2.1 Terrane Geoscience
List of Figures
- Figure 1: Global Mineral Exploration Services Revenue Breakdown (million, %) by Region 2025 & 2033
- Figure 2: North America Mineral Exploration Services Revenue (million), by Application 2025 & 2033
- Figure 3: North America Mineral Exploration Services Revenue Share (%), by Application 2025 & 2033
- Figure 4: North America Mineral Exploration Services Revenue (million), by Types 2025 & 2033
- Figure 5: North America Mineral Exploration Services Revenue Share (%), by Types 2025 & 2033
- Figure 6: North America Mineral Exploration Services Revenue (million), by Country 2025 & 2033
- Figure 7: North America Mineral Exploration Services Revenue Share (%), by Country 2025 & 2033
- Figure 8: South America Mineral Exploration Services Revenue (million), by Application 2025 & 2033
- Figure 9: South America Mineral Exploration Services Revenue Share (%), by Application 2025 & 2033
- Figure 10: South America Mineral Exploration Services Revenue (million), by Types 2025 & 2033
- Figure 11: South America Mineral Exploration Services Revenue Share (%), by Types 2025 & 2033
- Figure 12: South America Mineral Exploration Services Revenue (million), by Country 2025 & 2033
- Figure 13: South America Mineral Exploration Services Revenue Share (%), by Country 2025 & 2033
- Figure 14: Europe Mineral Exploration Services Revenue (million), by Application 2025 & 2033
- Figure 15: Europe Mineral Exploration Services Revenue Share (%), by Application 2025 & 2033
- Figure 16: Europe Mineral Exploration Services Revenue (million), by Types 2025 & 2033
- Figure 17: Europe Mineral Exploration Services Revenue Share (%), by Types 2025 & 2033
- Figure 18: Europe Mineral Exploration Services Revenue (million), by Country 2025 & 2033
- Figure 19: Europe Mineral Exploration Services Revenue Share (%), by Country 2025 & 2033
- Figure 20: Middle East & Africa Mineral Exploration Services Revenue (million), by Application 2025 & 2033
- Figure 21: Middle East & Africa Mineral Exploration Services Revenue Share (%), by Application 2025 & 2033
- Figure 22: Middle East & Africa Mineral Exploration Services Revenue (million), by Types 2025 & 2033
- Figure 23: Middle East & Africa Mineral Exploration Services Revenue Share (%), by Types 2025 & 2033
- Figure 24: Middle East & Africa Mineral Exploration Services Revenue (million), by Country 2025 & 2033
- Figure 25: Middle East & Africa Mineral Exploration Services Revenue Share (%), by Country 2025 & 2033
- Figure 26: Asia Pacific Mineral Exploration Services Revenue (million), by Application 2025 & 2033
- Figure 27: Asia Pacific Mineral Exploration Services Revenue Share (%), by Application 2025 & 2033
- Figure 28: Asia Pacific Mineral Exploration Services Revenue (million), by Types 2025 & 2033
- Figure 29: Asia Pacific Mineral Exploration Services Revenue Share (%), by Types 2025 & 2033
- Figure 30: Asia Pacific Mineral Exploration Services Revenue (million), by Country 2025 & 2033
- Figure 31: Asia Pacific Mineral Exploration Services Revenue Share (%), by Country 2025 & 2033
List of Tables
- Table 1: Global Mineral Exploration Services Revenue million Forecast, by Application 2020 & 2033
- Table 2: Global Mineral Exploration Services Revenue million Forecast, by Types 2020 & 2033
- Table 3: Global Mineral Exploration Services Revenue million Forecast, by Region 2020 & 2033
- Table 4: Global Mineral Exploration Services Revenue million Forecast, by Application 2020 & 2033
- Table 5: Global Mineral Exploration Services Revenue million Forecast, by Types 2020 & 2033
- Table 6: Global Mineral Exploration Services Revenue million Forecast, by Country 2020 & 2033
- Table 7: United States Mineral Exploration Services Revenue (million) Forecast, by Application 2020 & 2033
- Table 8: Canada Mineral Exploration Services Revenue (million) Forecast, by Application 2020 & 2033
- Table 9: Mexico Mineral Exploration Services Revenue (million) Forecast, by Application 2020 & 2033
- Table 10: Global Mineral Exploration Services Revenue million Forecast, by Application 2020 & 2033
- Table 11: Global Mineral Exploration Services Revenue million Forecast, by Types 2020 & 2033
- Table 12: Global Mineral Exploration Services Revenue million Forecast, by Country 2020 & 2033
- Table 13: Brazil Mineral Exploration Services Revenue (million) Forecast, by Application 2020 & 2033
- Table 14: Argentina Mineral Exploration Services Revenue (million) Forecast, by Application 2020 & 2033
- Table 15: Rest of South America Mineral Exploration Services Revenue (million) Forecast, by Application 2020 & 2033
- Table 16: Global Mineral Exploration Services Revenue million Forecast, by Application 2020 & 2033
- Table 17: Global Mineral Exploration Services Revenue million Forecast, by Types 2020 & 2033
- Table 18: Global Mineral Exploration Services Revenue million Forecast, by Country 2020 & 2033
- Table 19: United Kingdom Mineral Exploration Services Revenue (million) Forecast, by Application 2020 & 2033
- Table 20: Germany Mineral Exploration Services Revenue (million) Forecast, by Application 2020 & 2033
- Table 21: France Mineral Exploration Services Revenue (million) Forecast, by Application 2020 & 2033
- Table 22: Italy Mineral Exploration Services Revenue (million) Forecast, by Application 2020 & 2033
- Table 23: Spain Mineral Exploration Services Revenue (million) Forecast, by Application 2020 & 2033
- Table 24: Russia Mineral Exploration Services Revenue (million) Forecast, by Application 2020 & 2033
- Table 25: Benelux Mineral Exploration Services Revenue (million) Forecast, by Application 2020 & 2033
- Table 26: Nordics Mineral Exploration Services Revenue (million) Forecast, by Application 2020 & 2033
- Table 27: Rest of Europe Mineral Exploration Services Revenue (million) Forecast, by Application 2020 & 2033
- Table 28: Global Mineral Exploration Services Revenue million Forecast, by Application 2020 & 2033
- Table 29: Global Mineral Exploration Services Revenue million Forecast, by Types 2020 & 2033
- Table 30: Global Mineral Exploration Services Revenue million Forecast, by Country 2020 & 2033
- Table 31: Turkey Mineral Exploration Services Revenue (million) Forecast, by Application 2020 & 2033
- Table 32: Israel Mineral Exploration Services Revenue (million) Forecast, by Application 2020 & 2033
- Table 33: GCC Mineral Exploration Services Revenue (million) Forecast, by Application 2020 & 2033
- Table 34: North Africa Mineral Exploration Services Revenue (million) Forecast, by Application 2020 & 2033
- Table 35: South Africa Mineral Exploration Services Revenue (million) Forecast, by Application 2020 & 2033
- Table 36: Rest of Middle East & Africa Mineral Exploration Services Revenue (million) Forecast, by Application 2020 & 2033
- Table 37: Global Mineral Exploration Services Revenue million Forecast, by Application 2020 & 2033
- Table 38: Global Mineral Exploration Services Revenue million Forecast, by Types 2020 & 2033
- Table 39: Global Mineral Exploration Services Revenue million Forecast, by Country 2020 & 2033
- Table 40: China Mineral Exploration Services Revenue (million) Forecast, by Application 2020 & 2033
- Table 41: India Mineral Exploration Services Revenue (million) Forecast, by Application 2020 & 2033
- Table 42: Japan Mineral Exploration Services Revenue (million) Forecast, by Application 2020 & 2033
- Table 43: South Korea Mineral Exploration Services Revenue (million) Forecast, by Application 2020 & 2033
- Table 44: ASEAN Mineral Exploration Services Revenue (million) Forecast, by Application 2020 & 2033
- Table 45: Oceania Mineral Exploration Services Revenue (million) Forecast, by Application 2020 & 2033
- Table 46: Rest of Asia Pacific Mineral Exploration Services Revenue (million) Forecast, by Application 2020 & 2033
Frequently Asked Questions
1. What is the projected Compound Annual Growth Rate (CAGR) of the Mineral Exploration Services?
The projected CAGR is approximately 12.4%.
2. Which companies are prominent players in the Mineral Exploration Services?
Key companies in the market include Terrane Geoscience, Equity Exploration, SRK, Aurum Global Exploration, SGS, SEMS Exploration Services, Minrom, Calibre Group, DMT GROUP, Longford Exploration Services, AG Vision Mining, Bureau Veritas, Western Mining Services, PT Geoservices, HFG, Xploration Services Greenland, McElhanney, GexplOre, The MSA Group, Fugro, PT ANTAM Tbk, Euro Exploration Services, Noble Mineral Exploration, DBM, MTL.
3. What are the main segments of the Mineral Exploration Services?
The market segments include Application, Types.
4. Can you provide details about the market size?
The market size is estimated to be USD 4158 million as of 2022.
5. What are some drivers contributing to market growth?
N/A
6. What are the notable trends driving market growth?
N/A
7. Are there any restraints impacting market growth?
N/A
8. Can you provide examples of recent developments in the market?
N/A
9. What pricing options are available for accessing the report?
Pricing options include single-user, multi-user, and enterprise licenses priced at USD 3350.00, USD 5025.00, and USD 6700.00 respectively.
10. Is the market size provided in terms of value or volume?
The market size is provided in terms of value, measured in million.
11. Are there any specific market keywords associated with the report?
Yes, the market keyword associated with the report is "Mineral Exploration Services," which aids in identifying and referencing the specific market segment covered.
12. How do I determine which pricing option suits my needs best?
The pricing options vary based on user requirements and access needs. Individual users may opt for single-user licenses, while businesses requiring broader access may choose multi-user or enterprise licenses for cost-effective access to the report.
13. Are there any additional resources or data provided in the Mineral Exploration Services report?
While the report offers comprehensive insights, it's advisable to review the specific contents or supplementary materials provided to ascertain if additional resources or data are available.
14. How can I stay updated on further developments or reports in the Mineral Exploration Services?
To stay informed about further developments, trends, and reports in the Mineral Exploration Services, consider subscribing to industry newsletters, following relevant companies and organizations, or regularly checking reputable industry news sources and publications.
Methodology
Step 1 - Identification of Relevant Samples Size from Population Database


Step 2 - Approaches for Defining Global Market Size (Value, Volume* & Price*)

Note*: In applicable scenarios
Step 3 - Data Sources
Primary Research
- Web Analytics
- Survey Reports
- Research Institute
- Latest Research Reports
- Opinion Leaders
Secondary Research
- Annual Reports
- White Paper
- Latest Press Release
- Industry Association
- Paid Database
- Investor Presentations

Step 4 - Data Triangulation
Involves using different sources of information in order to increase the validity of a study
These sources are likely to be stakeholders in a program - participants, other researchers, program staff, other community members, and so on.
Then we put all data in single framework & apply various statistical tools to find out the dynamic on the market.
During the analysis stage, feedback from the stakeholder groups would be compared to determine areas of agreement as well as areas of divergence