

Key Insights
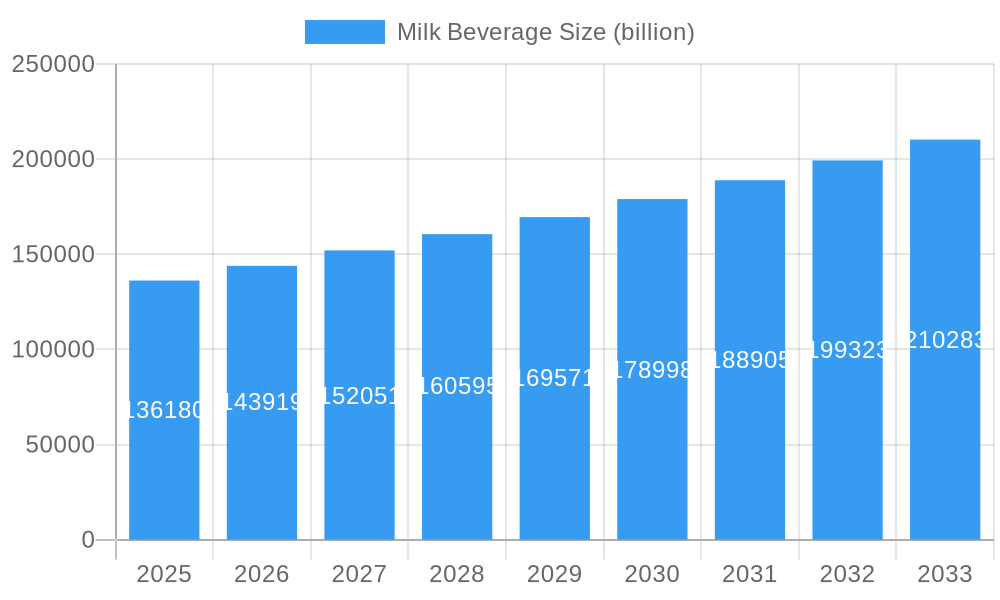
The global milk beverage market is projected for robust expansion, reaching an estimated $136.18 billion in 2025, with a compelling Compound Annual Growth Rate (CAGR) of 5.66% expected to continue through 2033. This significant growth is propelled by a confluence of evolving consumer preferences and expanding distribution channels. A primary driver is the increasing demand for healthier and functional beverages, with consumers actively seeking milk-based drinks fortified with vitamins, minerals, and probiotics, as well as lactose-free and plant-based alternatives to traditional dairy. The surging popularity of e-commerce and third-party online shopping platforms has democratized access to a wider array of milk beverage products, catering to diverse dietary needs and taste preferences, thereby contributing substantially to market penetration. Furthermore, the rising disposable incomes in emerging economies are fueling consumption, as consumers are more willing to invest in premium and specialized milk-based products.
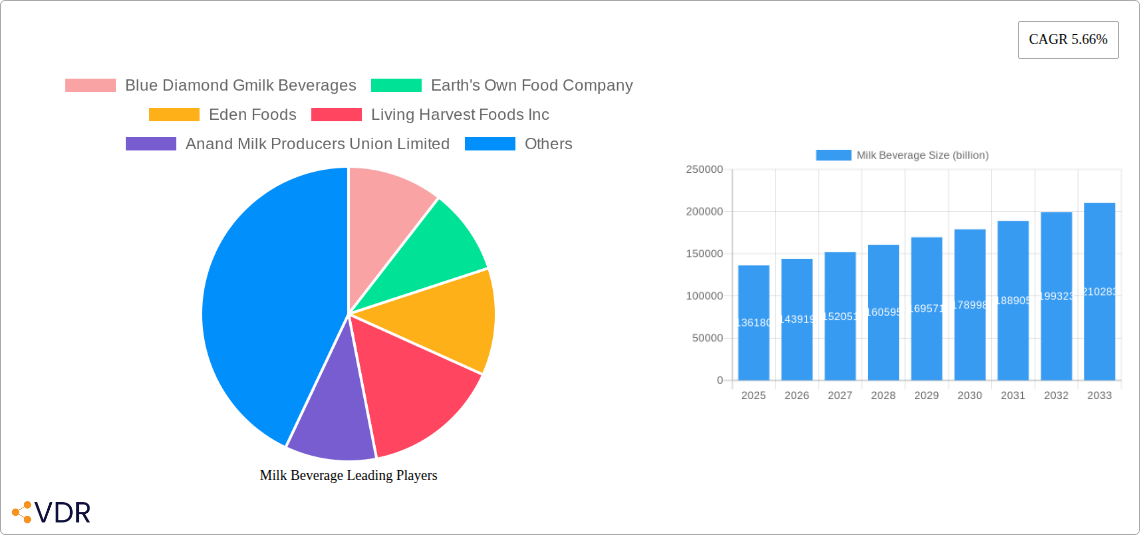
Milk Beverage Market Size (In Billion)
Key market trends underscore the growing significance of innovative product formulations and sustainable packaging. The demand for neutral milk drinks, which serve as a versatile base for various recipes and beverages, remains strong, while sour milk drinks like kefir and yogurt-based beverages are witnessing a surge in popularity due to their perceived health benefits and unique flavor profiles. Hypermarkets and supermarkets continue to be dominant sales channels, offering convenience and a wide selection, but specialty stores and fresh e-commerce platforms are rapidly gaining traction, particularly for niche and premium offerings. Challenges, such as fluctuating raw material prices and increasing competition from alternative beverage categories, are present, but the market's inherent adaptability and innovation capabilities are expected to mitigate these restraints. Companies are actively investing in research and development to launch novel products that align with consumer wellness aspirations and environmental consciousness, ensuring sustained market vitality.
Milk Beverage Company Market Share
Milk Beverage Market: Comprehensive Industry Analysis & Future Outlook (2019-2033)
This in-depth report provides an authoritative overview of the global Milk Beverage market, meticulously analyzing its dynamics, growth trajectories, and future potential from 2019 to 2033. Delving into parent and child market segments, this report offers critical insights for industry professionals, investors, and stakeholders seeking to navigate this evolving landscape. With a base year of 2025 and a forecast period extending to 2033, this analysis leverages high-traffic keywords to maximize SEO visibility and engagement. All quantitative values are presented in billions of units, ensuring clarity and consistency.
Milk Beverage Market Dynamics & Structure
The global Milk Beverage market is characterized by a dynamic interplay of factors shaping its structure and growth. Market concentration varies across regions, with established players dominating mature economies while emerging economies present opportunities for new entrants. Technological innovation remains a pivotal driver, particularly in product formulation, packaging, and processing, leading to enhanced shelf-life and nutritional profiles. Regulatory frameworks, though sometimes complex, are increasingly focused on food safety, labeling accuracy, and promoting healthier beverage options, indirectly influencing product development. Competitive product substitutes, including plant-based alternatives and functional beverages, exert continuous pressure, pushing milk beverage manufacturers to innovate and differentiate. End-user demographics are shifting, with growing demand for lactose-free, low-sugar, and fortified milk beverages catering to health-conscious consumers and specific dietary needs. Mergers and acquisitions (M&A) trends reflect strategic consolidations and vertical integrations aimed at expanding market reach, acquiring novel technologies, and optimizing supply chains.
- Market Concentration: Varies by region, with consolidated markets in North America and Europe, and fragmented markets in Asia-Pacific.
- Technological Innovation: Focus on UHT processing, aseptic packaging, and development of novel ingredients for improved taste and nutrition.
- Regulatory Frameworks: Stringent food safety standards and evolving labeling requirements in key markets.
- Competitive Substitutes: Increasing market penetration of plant-based milk alternatives impacting traditional milk beverage market share.
- End-User Demographics: Growing demand for health-focused variants like protein-enriched and vitamin-fortified milk beverages.
- M&A Trends: Strategic acquisitions of smaller, innovative brands and expansion into emerging markets.
Milk Beverage Growth Trends & Insights
The Milk Beverage market is poised for significant growth, driven by a confluence of evolving consumer preferences and advancements in product development. The market size has witnessed steady expansion, propelled by increasing disposable incomes in developing nations and a heightened awareness of the nutritional benefits associated with milk consumption. Adoption rates for specialized milk beverages, such as those fortified with vitamins and minerals or catering to specific dietary needs like lactose intolerance, have surged. Technological disruptions, including improved pasteurization techniques and innovative packaging solutions, are enhancing product appeal and extending market reach. Consumer behavior shifts are profoundly influencing this market, with a growing emphasis on health and wellness, leading to a preference for natural, minimally processed, and nutrient-dense options. The convenience offered by ready-to-drink milk beverages and their perceived health advantages over sugary alternatives further contribute to their rising popularity. The global milk beverage market is projected to expand at a Compound Annual Growth Rate (CAGR) of approximately 4.5% during the forecast period, reaching an estimated market size of $XXX billion by 2033. This growth is further fueled by increasing urbanization and the expansion of modern retail formats, providing wider accessibility to a diverse range of milk beverage products.
- Market Size Evolution: Projected to reach $XXX billion by 2033, with a CAGR of ~4.5%.
- Adoption Rates: High for specialized variants like lactose-free and fortified milk beverages.
- Technological Disruptions: Innovations in processing and packaging are enhancing product appeal and accessibility.
- Consumer Behavior Shifts: Growing demand for health-conscious, natural, and nutrient-rich beverage options.
- Market Penetration: Increasing penetration driven by expanding distribution channels and rising consumer awareness.
Dominant Regions, Countries, or Segments in Milk Beverage
The Hypermarkets and Supermarkets segment within the Application category is emerging as a dominant force driving growth in the global Milk Beverage market. This dominance is attributable to several key factors, including unparalleled product visibility, extensive shelf space, and the ability to cater to a broad spectrum of consumer needs. Hypermarkets and supermarkets provide consumers with a convenient one-stop shopping experience, offering a wide variety of milk beverage types, brands, and formats under one roof. The increasing presence of these retail giants in both developed and developing economies, coupled with their sophisticated supply chain management, ensures wider accessibility and consistent availability of milk beverages. Furthermore, strategic promotional activities, bulk purchasing options, and loyalty programs offered by these retail outlets significantly influence consumer purchasing decisions, thereby accelerating market growth within this segment.
The Neutral Milk Drink category, within the Type segment, also plays a pivotal role in market expansion. Neutral milk drinks, encompassing traditional pasteurized milk and UHT milk, form the bedrock of the milk beverage industry. Their widespread consumption across all age groups, owing to their essential role in daily nutrition and versatility in culinary applications, ensures a consistent and substantial demand. The ongoing efforts by manufacturers to enhance the nutritional profile of neutral milk drinks through fortification and the introduction of lactose-free options are further bolstering their appeal and market share.
Geographically, Asia-Pacific stands out as the most dominant region. This leadership is driven by a burgeoning population, rapid economic development, rising disposable incomes, and a growing health-conscious consumer base. Countries like China and India, with their vast populations and increasing adoption of Western dietary habits, represent significant markets for milk beverages. Government initiatives promoting dairy consumption and improvements in cold chain infrastructure are also critical contributors to this regional dominance. The region's extensive distribution networks, coupled with the increasing penetration of modern retail formats and e-commerce platforms, ensure that milk beverages are readily available to a vast consumer base.
- Dominant Application Segment: Hypermarkets and Supermarkets, driven by extensive product availability and consumer convenience.
- Dominant Type Segment: Neutral Milk Drink, owing to widespread appeal and nutritional importance.
- Dominant Region: Asia-Pacific, propelled by population growth, economic development, and rising health awareness.
- Key Drivers in Asia-Pacific:
- Rapid economic growth leading to increased purchasing power.
- Young demographic profile with growing demand for nutritious beverages.
- Expanding middle class adopting diverse dietary habits.
- Government support for the dairy industry and nutritional awareness campaigns.
- Improvements in cold chain logistics and retail infrastructure.
- Key Drivers in Asia-Pacific:
- Market Share within Dominant Segments: Hypermarkets and Supermarkets contribute to approximately 40% of the total milk beverage sales, while Neutral Milk Drinks account for over 60% of the volume.
Milk Beverage Product Landscape
The product landscape for milk beverages is continuously evolving, marked by a strong emphasis on innovation and diversification. Manufacturers are actively developing a wide array of products, from traditional pasteurized and UHT milk to specialized, fortified, and functional beverages. Key innovations include lactose-free variants, protein-enriched milk drinks, and those infused with vitamins, minerals, and prebiotics to cater to specific health and wellness trends. Packaging advancements, such as aseptic cartons and resealable bottles, enhance convenience and extend shelf-life, broadening consumer appeal. Performance metrics are increasingly focused on nutritional value, taste profiles, and sustainable sourcing.
Key Drivers, Barriers & Challenges in Milk Beverage
The Milk Beverage market is propelled by several key drivers. Growing health consciousness among consumers, leading to increased demand for nutrient-rich beverages, is a primary catalyst. The perceived health benefits of milk, including its calcium and protein content, remain a significant draw. Technological advancements in processing and packaging, such as UHT treatment and aseptic filling, have expanded shelf-life and distribution reach, making milk beverages more accessible.
Conversely, several barriers and challenges can impede market growth. The increasing popularity of plant-based milk alternatives, perceived by some consumers as healthier or more sustainable, poses a significant competitive threat. Fluctuations in raw milk prices can impact production costs and profitability for manufacturers. Stringent regulations regarding food safety and labeling in various regions can also present compliance challenges and increase operational costs.
- Key Drivers:
- Rising health and wellness trends.
- Perceived nutritional benefits of milk.
- Advancements in processing and packaging technology.
- Expanding distribution channels.
- Key Barriers & Challenges:
- Growing competition from plant-based alternatives.
- Volatility in raw milk prices.
- Stringent regulatory compliance.
- Supply chain disruptions.
- Consumer concerns regarding lactose intolerance and animal welfare.
Emerging Opportunities in Milk Beverage
Emerging opportunities in the Milk Beverage sector lie in the development of highly specialized and functional beverages. There is a growing demand for milk drinks fortified with specific nutrients targeting different life stages, such as infant nutrition or senior health. The expansion into untapped markets in developing economies, where dairy consumption is traditionally lower but rising, presents significant growth potential. Innovations in sustainable packaging and ethical sourcing are also gaining traction, appealing to environmentally conscious consumers.
- Untapped Markets: Expansion into developing economies with rising disposable incomes.
- Innovative Applications: Development of milk beverages tailored for specific health needs (e.g., bone health, immune support).
- Evolving Consumer Preferences: Focus on natural ingredients, reduced sugar content, and clean labels.
Growth Accelerators in the Milk Beverage Industry
Several catalysts are accelerating growth in the Milk Beverage industry. Technological breakthroughs in areas like precision fermentation and advanced nutrient delivery systems are enabling the creation of novel and highly functional milk beverages. Strategic partnerships between dairy producers, ingredient suppliers, and beverage companies are fostering innovation and expanding market reach. Furthermore, aggressive market expansion strategies by leading players into emerging economies, coupled with effective marketing campaigns highlighting health benefits, are significantly driving long-term growth.
Key Players Shaping the Milk Beverage Market
- Blue Diamond Gmilk Beverages
- Earth's Own Food Company
- Eden Foods
- Living Harvest Foods Inc
- Anand Milk Producers Union Limited
- South East Bottling & Beverage
- Krafts Foods Group
- Arla Foods
- Yili Industrial Group
- Mengniu Dairy
- Beijing Sanyuan Foods
- Shijiazhuang Junlebao Dairy
- Bright Food (Group)
- Wei Chuan Foods Corporation
- Groupe Danone
- Lifeway Foods
- Amul Dairy
- Parag Milk Foods
- The Hain Celestial Group
- Sassy Lassi
- Fresh Made Dairy
- Nourish Kefir
- Best of Farms
- Babushka Kefir
- Valio Eesti AS
- Moringa Milk Industry
Notable Milestones in Milk Beverage Sector
- 2019: Launch of a new line of protein-fortified milk drinks by Arla Foods, targeting active consumers.
- 2020: Amul Dairy introduces organic milk beverages, responding to growing consumer demand for natural products.
- 2021: Mengniu Dairy significantly increases investment in R&D for dairy-based functional beverages in China.
- 2022: Groupe Danone acquires a minority stake in a leading plant-based beverage company to diversify its portfolio.
- 2023: Yili Industrial Group announces expansion plans into Southeast Asian markets for its milk beverage products.
- 2024: Krafts Foods Group launches a range of reduced-sugar milk beverages in response to health trends.
In-Depth Milk Beverage Market Outlook
The future outlook for the Milk Beverage market remains robust, fueled by sustained innovation and evolving consumer priorities. Growth accelerators such as the continuous development of nutritionally enhanced products, strategic market penetration into high-growth emerging economies, and the adoption of sustainable practices are expected to drive market expansion. Companies that can effectively leverage technological advancements to create differentiated, health-focused, and convenient milk beverage options will be well-positioned for success. The increasing integration of e-commerce and modern retail channels will further enhance accessibility, solidifying the milk beverage market's position as a significant player in the global beverage industry.
Milk Beverage Segmentation
-
1. Application
- 1.1. Third-party Online Shopping Platform
- 1.2. Fresh E-commerce
- 1.3. Hypermarkets and Supermarkets
- 1.4. Specialty Stores
- 1.5. Restaurant
- 1.6. Convenience Stores
- 1.7. Others
-
2. Type
- 2.1. Neutral Milk Drink
- 2.2. Sour Milk Drink
Milk Beverage Segmentation By Geography
-
1. North America
- 1.1. United States
- 1.2. Canada
- 1.3. Mexico
-
2. South America
- 2.1. Brazil
- 2.2. Argentina
- 2.3. Rest of South America
-
3. Europe
- 3.1. United Kingdom
- 3.2. Germany
- 3.3. France
- 3.4. Italy
- 3.5. Spain
- 3.6. Russia
- 3.7. Benelux
- 3.8. Nordics
- 3.9. Rest of Europe
-
4. Middle East & Africa
- 4.1. Turkey
- 4.2. Israel
- 4.3. GCC
- 4.4. North Africa
- 4.5. South Africa
- 4.6. Rest of Middle East & Africa
-
5. Asia Pacific
- 5.1. China
- 5.2. India
- 5.3. Japan
- 5.4. South Korea
- 5.5. ASEAN
- 5.6. Oceania
- 5.7. Rest of Asia Pacific
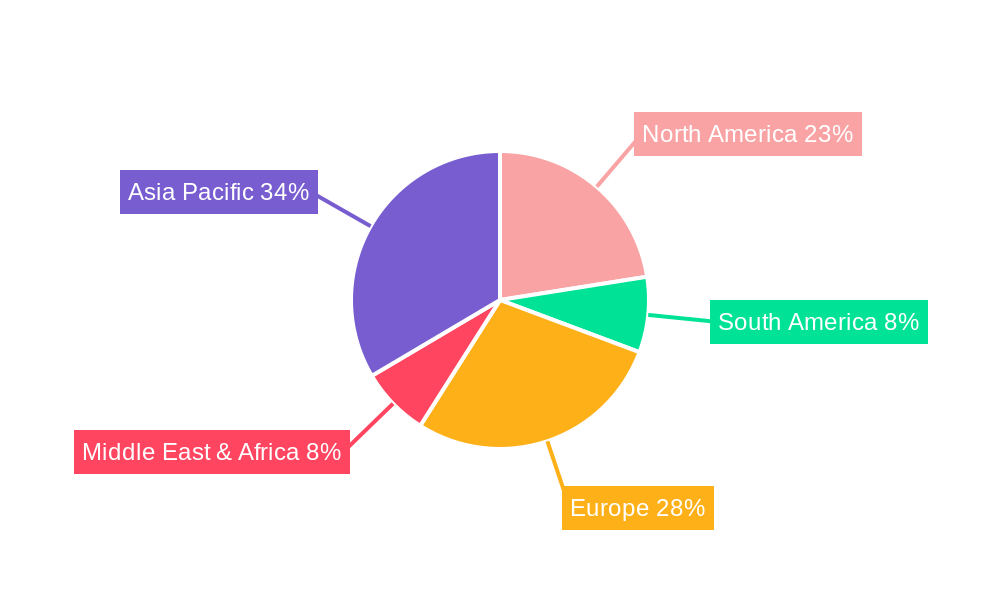
Milk Beverage Regional Market Share
Geographic Coverage of Milk Beverage
Milk Beverage REPORT HIGHLIGHTS
| Aspects | Details |
|---|---|
| Study Period | 2020-2034 |
| Base Year | 2025 |
| Estimated Year | 2026 |
| Forecast Period | 2026-2034 |
| Historical Period | 2020-2025 |
| Growth Rate | CAGR of 5.66% from 2020-2034 |
| Segmentation |
|
Table of Contents
- 1. Introduction
- 1.1. Research Scope
- 1.2. Market Segmentation
- 1.3. Research Methodology
- 1.4. Definitions and Assumptions
- 2. Executive Summary
- 2.1. Introduction
- 3. Market Dynamics
- 3.1. Introduction
- 3.2. Market Drivers
- 3.3. Market Restrains
- 3.4. Market Trends
- 4. Market Factor Analysis
- 4.1. Porters Five Forces
- 4.2. Supply/Value Chain
- 4.3. PESTEL analysis
- 4.4. Market Entropy
- 4.5. Patent/Trademark Analysis
- 5. Global Milk Beverage Analysis, Insights and Forecast, 2020-2032
- 5.1. Market Analysis, Insights and Forecast - by Application
- 5.1.1. Third-party Online Shopping Platform
- 5.1.2. Fresh E-commerce
- 5.1.3. Hypermarkets and Supermarkets
- 5.1.4. Specialty Stores
- 5.1.5. Restaurant
- 5.1.6. Convenience Stores
- 5.1.7. Others
- 5.2. Market Analysis, Insights and Forecast - by Type
- 5.2.1. Neutral Milk Drink
- 5.2.2. Sour Milk Drink
- 5.3. Market Analysis, Insights and Forecast - by Region
- 5.3.1. North America
- 5.3.2. South America
- 5.3.3. Europe
- 5.3.4. Middle East & Africa
- 5.3.5. Asia Pacific
- 5.1. Market Analysis, Insights and Forecast - by Application
- 6. North America Milk Beverage Analysis, Insights and Forecast, 2020-2032
- 6.1. Market Analysis, Insights and Forecast - by Application
- 6.1.1. Third-party Online Shopping Platform
- 6.1.2. Fresh E-commerce
- 6.1.3. Hypermarkets and Supermarkets
- 6.1.4. Specialty Stores
- 6.1.5. Restaurant
- 6.1.6. Convenience Stores
- 6.1.7. Others
- 6.2. Market Analysis, Insights and Forecast - by Type
- 6.2.1. Neutral Milk Drink
- 6.2.2. Sour Milk Drink
- 6.1. Market Analysis, Insights and Forecast - by Application
- 7. South America Milk Beverage Analysis, Insights and Forecast, 2020-2032
- 7.1. Market Analysis, Insights and Forecast - by Application
- 7.1.1. Third-party Online Shopping Platform
- 7.1.2. Fresh E-commerce
- 7.1.3. Hypermarkets and Supermarkets
- 7.1.4. Specialty Stores
- 7.1.5. Restaurant
- 7.1.6. Convenience Stores
- 7.1.7. Others
- 7.2. Market Analysis, Insights and Forecast - by Type
- 7.2.1. Neutral Milk Drink
- 7.2.2. Sour Milk Drink
- 7.1. Market Analysis, Insights and Forecast - by Application
- 8. Europe Milk Beverage Analysis, Insights and Forecast, 2020-2032
- 8.1. Market Analysis, Insights and Forecast - by Application
- 8.1.1. Third-party Online Shopping Platform
- 8.1.2. Fresh E-commerce
- 8.1.3. Hypermarkets and Supermarkets
- 8.1.4. Specialty Stores
- 8.1.5. Restaurant
- 8.1.6. Convenience Stores
- 8.1.7. Others
- 8.2. Market Analysis, Insights and Forecast - by Type
- 8.2.1. Neutral Milk Drink
- 8.2.2. Sour Milk Drink
- 8.1. Market Analysis, Insights and Forecast - by Application
- 9. Middle East & Africa Milk Beverage Analysis, Insights and Forecast, 2020-2032
- 9.1. Market Analysis, Insights and Forecast - by Application
- 9.1.1. Third-party Online Shopping Platform
- 9.1.2. Fresh E-commerce
- 9.1.3. Hypermarkets and Supermarkets
- 9.1.4. Specialty Stores
- 9.1.5. Restaurant
- 9.1.6. Convenience Stores
- 9.1.7. Others
- 9.2. Market Analysis, Insights and Forecast - by Type
- 9.2.1. Neutral Milk Drink
- 9.2.2. Sour Milk Drink
- 9.1. Market Analysis, Insights and Forecast - by Application
- 10. Asia Pacific Milk Beverage Analysis, Insights and Forecast, 2020-2032
- 10.1. Market Analysis, Insights and Forecast - by Application
- 10.1.1. Third-party Online Shopping Platform
- 10.1.2. Fresh E-commerce
- 10.1.3. Hypermarkets and Supermarkets
- 10.1.4. Specialty Stores
- 10.1.5. Restaurant
- 10.1.6. Convenience Stores
- 10.1.7. Others
- 10.2. Market Analysis, Insights and Forecast - by Type
- 10.2.1. Neutral Milk Drink
- 10.2.2. Sour Milk Drink
- 10.1. Market Analysis, Insights and Forecast - by Application
- 11. Competitive Analysis
- 11.1. Global Market Share Analysis 2025
- 11.2. Company Profiles
- 11.2.1 Blue Diamond Gmilk Beverages
- 11.2.1.1. Overview
- 11.2.1.2. Products
- 11.2.1.3. SWOT Analysis
- 11.2.1.4. Recent Developments
- 11.2.1.5. Financials (Based on Availability)
- 11.2.2 Earth's Own Food Company
- 11.2.2.1. Overview
- 11.2.2.2. Products
- 11.2.2.3. SWOT Analysis
- 11.2.2.4. Recent Developments
- 11.2.2.5. Financials (Based on Availability)
- 11.2.3 Eden Foods
- 11.2.3.1. Overview
- 11.2.3.2. Products
- 11.2.3.3. SWOT Analysis
- 11.2.3.4. Recent Developments
- 11.2.3.5. Financials (Based on Availability)
- 11.2.4 Living Harvest Foods Inc
- 11.2.4.1. Overview
- 11.2.4.2. Products
- 11.2.4.3. SWOT Analysis
- 11.2.4.4. Recent Developments
- 11.2.4.5. Financials (Based on Availability)
- 11.2.5 Anand Milk Producers Union Limited
- 11.2.5.1. Overview
- 11.2.5.2. Products
- 11.2.5.3. SWOT Analysis
- 11.2.5.4. Recent Developments
- 11.2.5.5. Financials (Based on Availability)
- 11.2.6 South East Bottling & Beverage
- 11.2.6.1. Overview
- 11.2.6.2. Products
- 11.2.6.3. SWOT Analysis
- 11.2.6.4. Recent Developments
- 11.2.6.5. Financials (Based on Availability)
- 11.2.7 Krafts Foods Group
- 11.2.7.1. Overview
- 11.2.7.2. Products
- 11.2.7.3. SWOT Analysis
- 11.2.7.4. Recent Developments
- 11.2.7.5. Financials (Based on Availability)
- 11.2.8 Arla Foods
- 11.2.8.1. Overview
- 11.2.8.2. Products
- 11.2.8.3. SWOT Analysis
- 11.2.8.4. Recent Developments
- 11.2.8.5. Financials (Based on Availability)
- 11.2.9 Yili Industrial Group
- 11.2.9.1. Overview
- 11.2.9.2. Products
- 11.2.9.3. SWOT Analysis
- 11.2.9.4. Recent Developments
- 11.2.9.5. Financials (Based on Availability)
- 11.2.10 Mengniu Dairy
- 11.2.10.1. Overview
- 11.2.10.2. Products
- 11.2.10.3. SWOT Analysis
- 11.2.10.4. Recent Developments
- 11.2.10.5. Financials (Based on Availability)
- 11.2.11 Beijing Sanyuan Foods
- 11.2.11.1. Overview
- 11.2.11.2. Products
- 11.2.11.3. SWOT Analysis
- 11.2.11.4. Recent Developments
- 11.2.11.5. Financials (Based on Availability)
- 11.2.12 Shijiazhuang Junlebao Dairy
- 11.2.12.1. Overview
- 11.2.12.2. Products
- 11.2.12.3. SWOT Analysis
- 11.2.12.4. Recent Developments
- 11.2.12.5. Financials (Based on Availability)
- 11.2.13 Bright Food (Group)
- 11.2.13.1. Overview
- 11.2.13.2. Products
- 11.2.13.3. SWOT Analysis
- 11.2.13.4. Recent Developments
- 11.2.13.5. Financials (Based on Availability)
- 11.2.14 Wei Chuan Foods Corporation
- 11.2.14.1. Overview
- 11.2.14.2. Products
- 11.2.14.3. SWOT Analysis
- 11.2.14.4. Recent Developments
- 11.2.14.5. Financials (Based on Availability)
- 11.2.15 Groupe Danone
- 11.2.15.1. Overview
- 11.2.15.2. Products
- 11.2.15.3. SWOT Analysis
- 11.2.15.4. Recent Developments
- 11.2.15.5. Financials (Based on Availability)
- 11.2.16 Lifeway Foods
- 11.2.16.1. Overview
- 11.2.16.2. Products
- 11.2.16.3. SWOT Analysis
- 11.2.16.4. Recent Developments
- 11.2.16.5. Financials (Based on Availability)
- 11.2.17 Amul Dairy
- 11.2.17.1. Overview
- 11.2.17.2. Products
- 11.2.17.3. SWOT Analysis
- 11.2.17.4. Recent Developments
- 11.2.17.5. Financials (Based on Availability)
- 11.2.18 Parag Milk Foods
- 11.2.18.1. Overview
- 11.2.18.2. Products
- 11.2.18.3. SWOT Analysis
- 11.2.18.4. Recent Developments
- 11.2.18.5. Financials (Based on Availability)
- 11.2.19 The Hain Celestial Group
- 11.2.19.1. Overview
- 11.2.19.2. Products
- 11.2.19.3. SWOT Analysis
- 11.2.19.4. Recent Developments
- 11.2.19.5. Financials (Based on Availability)
- 11.2.20 Sassy Lassi
- 11.2.20.1. Overview
- 11.2.20.2. Products
- 11.2.20.3. SWOT Analysis
- 11.2.20.4. Recent Developments
- 11.2.20.5. Financials (Based on Availability)
- 11.2.21 Fresh Made Dairy
- 11.2.21.1. Overview
- 11.2.21.2. Products
- 11.2.21.3. SWOT Analysis
- 11.2.21.4. Recent Developments
- 11.2.21.5. Financials (Based on Availability)
- 11.2.22 Nourish Kefir
- 11.2.22.1. Overview
- 11.2.22.2. Products
- 11.2.22.3. SWOT Analysis
- 11.2.22.4. Recent Developments
- 11.2.22.5. Financials (Based on Availability)
- 11.2.23 Best of Farms
- 11.2.23.1. Overview
- 11.2.23.2. Products
- 11.2.23.3. SWOT Analysis
- 11.2.23.4. Recent Developments
- 11.2.23.5. Financials (Based on Availability)
- 11.2.24 Babushka Kefir
- 11.2.24.1. Overview
- 11.2.24.2. Products
- 11.2.24.3. SWOT Analysis
- 11.2.24.4. Recent Developments
- 11.2.24.5. Financials (Based on Availability)
- 11.2.25 Valio Eesti AS
- 11.2.25.1. Overview
- 11.2.25.2. Products
- 11.2.25.3. SWOT Analysis
- 11.2.25.4. Recent Developments
- 11.2.25.5. Financials (Based on Availability)
- 11.2.26 Moringa Milk Industry
- 11.2.26.1. Overview
- 11.2.26.2. Products
- 11.2.26.3. SWOT Analysis
- 11.2.26.4. Recent Developments
- 11.2.26.5. Financials (Based on Availability)
- 11.2.1 Blue Diamond Gmilk Beverages
List of Figures
- Figure 1: Global Milk Beverage Revenue Breakdown (billion, %) by Region 2025 & 2033
- Figure 2: Global Milk Beverage Volume Breakdown (K, %) by Region 2025 & 2033
- Figure 3: North America Milk Beverage Revenue (billion), by Application 2025 & 2033
- Figure 4: North America Milk Beverage Volume (K), by Application 2025 & 2033
- Figure 5: North America Milk Beverage Revenue Share (%), by Application 2025 & 2033
- Figure 6: North America Milk Beverage Volume Share (%), by Application 2025 & 2033
- Figure 7: North America Milk Beverage Revenue (billion), by Type 2025 & 2033
- Figure 8: North America Milk Beverage Volume (K), by Type 2025 & 2033
- Figure 9: North America Milk Beverage Revenue Share (%), by Type 2025 & 2033
- Figure 10: North America Milk Beverage Volume Share (%), by Type 2025 & 2033
- Figure 11: North America Milk Beverage Revenue (billion), by Country 2025 & 2033
- Figure 12: North America Milk Beverage Volume (K), by Country 2025 & 2033
- Figure 13: North America Milk Beverage Revenue Share (%), by Country 2025 & 2033
- Figure 14: North America Milk Beverage Volume Share (%), by Country 2025 & 2033
- Figure 15: South America Milk Beverage Revenue (billion), by Application 2025 & 2033
- Figure 16: South America Milk Beverage Volume (K), by Application 2025 & 2033
- Figure 17: South America Milk Beverage Revenue Share (%), by Application 2025 & 2033
- Figure 18: South America Milk Beverage Volume Share (%), by Application 2025 & 2033
- Figure 19: South America Milk Beverage Revenue (billion), by Type 2025 & 2033
- Figure 20: South America Milk Beverage Volume (K), by Type 2025 & 2033
- Figure 21: South America Milk Beverage Revenue Share (%), by Type 2025 & 2033
- Figure 22: South America Milk Beverage Volume Share (%), by Type 2025 & 2033
- Figure 23: South America Milk Beverage Revenue (billion), by Country 2025 & 2033
- Figure 24: South America Milk Beverage Volume (K), by Country 2025 & 2033
- Figure 25: South America Milk Beverage Revenue Share (%), by Country 2025 & 2033
- Figure 26: South America Milk Beverage Volume Share (%), by Country 2025 & 2033
- Figure 27: Europe Milk Beverage Revenue (billion), by Application 2025 & 2033
- Figure 28: Europe Milk Beverage Volume (K), by Application 2025 & 2033
- Figure 29: Europe Milk Beverage Revenue Share (%), by Application 2025 & 2033
- Figure 30: Europe Milk Beverage Volume Share (%), by Application 2025 & 2033
- Figure 31: Europe Milk Beverage Revenue (billion), by Type 2025 & 2033
- Figure 32: Europe Milk Beverage Volume (K), by Type 2025 & 2033
- Figure 33: Europe Milk Beverage Revenue Share (%), by Type 2025 & 2033
- Figure 34: Europe Milk Beverage Volume Share (%), by Type 2025 & 2033
- Figure 35: Europe Milk Beverage Revenue (billion), by Country 2025 & 2033
- Figure 36: Europe Milk Beverage Volume (K), by Country 2025 & 2033
- Figure 37: Europe Milk Beverage Revenue Share (%), by Country 2025 & 2033
- Figure 38: Europe Milk Beverage Volume Share (%), by Country 2025 & 2033
- Figure 39: Middle East & Africa Milk Beverage Revenue (billion), by Application 2025 & 2033
- Figure 40: Middle East & Africa Milk Beverage Volume (K), by Application 2025 & 2033
- Figure 41: Middle East & Africa Milk Beverage Revenue Share (%), by Application 2025 & 2033
- Figure 42: Middle East & Africa Milk Beverage Volume Share (%), by Application 2025 & 2033
- Figure 43: Middle East & Africa Milk Beverage Revenue (billion), by Type 2025 & 2033
- Figure 44: Middle East & Africa Milk Beverage Volume (K), by Type 2025 & 2033
- Figure 45: Middle East & Africa Milk Beverage Revenue Share (%), by Type 2025 & 2033
- Figure 46: Middle East & Africa Milk Beverage Volume Share (%), by Type 2025 & 2033
- Figure 47: Middle East & Africa Milk Beverage Revenue (billion), by Country 2025 & 2033
- Figure 48: Middle East & Africa Milk Beverage Volume (K), by Country 2025 & 2033
- Figure 49: Middle East & Africa Milk Beverage Revenue Share (%), by Country 2025 & 2033
- Figure 50: Middle East & Africa Milk Beverage Volume Share (%), by Country 2025 & 2033
- Figure 51: Asia Pacific Milk Beverage Revenue (billion), by Application 2025 & 2033
- Figure 52: Asia Pacific Milk Beverage Volume (K), by Application 2025 & 2033
- Figure 53: Asia Pacific Milk Beverage Revenue Share (%), by Application 2025 & 2033
- Figure 54: Asia Pacific Milk Beverage Volume Share (%), by Application 2025 & 2033
- Figure 55: Asia Pacific Milk Beverage Revenue (billion), by Type 2025 & 2033
- Figure 56: Asia Pacific Milk Beverage Volume (K), by Type 2025 & 2033
- Figure 57: Asia Pacific Milk Beverage Revenue Share (%), by Type 2025 & 2033
- Figure 58: Asia Pacific Milk Beverage Volume Share (%), by Type 2025 & 2033
- Figure 59: Asia Pacific Milk Beverage Revenue (billion), by Country 2025 & 2033
- Figure 60: Asia Pacific Milk Beverage Volume (K), by Country 2025 & 2033
- Figure 61: Asia Pacific Milk Beverage Revenue Share (%), by Country 2025 & 2033
- Figure 62: Asia Pacific Milk Beverage Volume Share (%), by Country 2025 & 2033
List of Tables
- Table 1: Global Milk Beverage Revenue billion Forecast, by Application 2020 & 2033
- Table 2: Global Milk Beverage Volume K Forecast, by Application 2020 & 2033
- Table 3: Global Milk Beverage Revenue billion Forecast, by Type 2020 & 2033
- Table 4: Global Milk Beverage Volume K Forecast, by Type 2020 & 2033
- Table 5: Global Milk Beverage Revenue billion Forecast, by Region 2020 & 2033
- Table 6: Global Milk Beverage Volume K Forecast, by Region 2020 & 2033
- Table 7: Global Milk Beverage Revenue billion Forecast, by Application 2020 & 2033
- Table 8: Global Milk Beverage Volume K Forecast, by Application 2020 & 2033
- Table 9: Global Milk Beverage Revenue billion Forecast, by Type 2020 & 2033
- Table 10: Global Milk Beverage Volume K Forecast, by Type 2020 & 2033
- Table 11: Global Milk Beverage Revenue billion Forecast, by Country 2020 & 2033
- Table 12: Global Milk Beverage Volume K Forecast, by Country 2020 & 2033
- Table 13: United States Milk Beverage Revenue (billion) Forecast, by Application 2020 & 2033
- Table 14: United States Milk Beverage Volume (K) Forecast, by Application 2020 & 2033
- Table 15: Canada Milk Beverage Revenue (billion) Forecast, by Application 2020 & 2033
- Table 16: Canada Milk Beverage Volume (K) Forecast, by Application 2020 & 2033
- Table 17: Mexico Milk Beverage Revenue (billion) Forecast, by Application 2020 & 2033
- Table 18: Mexico Milk Beverage Volume (K) Forecast, by Application 2020 & 2033
- Table 19: Global Milk Beverage Revenue billion Forecast, by Application 2020 & 2033
- Table 20: Global Milk Beverage Volume K Forecast, by Application 2020 & 2033
- Table 21: Global Milk Beverage Revenue billion Forecast, by Type 2020 & 2033
- Table 22: Global Milk Beverage Volume K Forecast, by Type 2020 & 2033
- Table 23: Global Milk Beverage Revenue billion Forecast, by Country 2020 & 2033
- Table 24: Global Milk Beverage Volume K Forecast, by Country 2020 & 2033
- Table 25: Brazil Milk Beverage Revenue (billion) Forecast, by Application 2020 & 2033
- Table 26: Brazil Milk Beverage Volume (K) Forecast, by Application 2020 & 2033
- Table 27: Argentina Milk Beverage Revenue (billion) Forecast, by Application 2020 & 2033
- Table 28: Argentina Milk Beverage Volume (K) Forecast, by Application 2020 & 2033
- Table 29: Rest of South America Milk Beverage Revenue (billion) Forecast, by Application 2020 & 2033
- Table 30: Rest of South America Milk Beverage Volume (K) Forecast, by Application 2020 & 2033
- Table 31: Global Milk Beverage Revenue billion Forecast, by Application 2020 & 2033
- Table 32: Global Milk Beverage Volume K Forecast, by Application 2020 & 2033
- Table 33: Global Milk Beverage Revenue billion Forecast, by Type 2020 & 2033
- Table 34: Global Milk Beverage Volume K Forecast, by Type 2020 & 2033
- Table 35: Global Milk Beverage Revenue billion Forecast, by Country 2020 & 2033
- Table 36: Global Milk Beverage Volume K Forecast, by Country 2020 & 2033
- Table 37: United Kingdom Milk Beverage Revenue (billion) Forecast, by Application 2020 & 2033
- Table 38: United Kingdom Milk Beverage Volume (K) Forecast, by Application 2020 & 2033
- Table 39: Germany Milk Beverage Revenue (billion) Forecast, by Application 2020 & 2033
- Table 40: Germany Milk Beverage Volume (K) Forecast, by Application 2020 & 2033
- Table 41: France Milk Beverage Revenue (billion) Forecast, by Application 2020 & 2033
- Table 42: France Milk Beverage Volume (K) Forecast, by Application 2020 & 2033
- Table 43: Italy Milk Beverage Revenue (billion) Forecast, by Application 2020 & 2033
- Table 44: Italy Milk Beverage Volume (K) Forecast, by Application 2020 & 2033
- Table 45: Spain Milk Beverage Revenue (billion) Forecast, by Application 2020 & 2033
- Table 46: Spain Milk Beverage Volume (K) Forecast, by Application 2020 & 2033
- Table 47: Russia Milk Beverage Revenue (billion) Forecast, by Application 2020 & 2033
- Table 48: Russia Milk Beverage Volume (K) Forecast, by Application 2020 & 2033
- Table 49: Benelux Milk Beverage Revenue (billion) Forecast, by Application 2020 & 2033
- Table 50: Benelux Milk Beverage Volume (K) Forecast, by Application 2020 & 2033
- Table 51: Nordics Milk Beverage Revenue (billion) Forecast, by Application 2020 & 2033
- Table 52: Nordics Milk Beverage Volume (K) Forecast, by Application 2020 & 2033
- Table 53: Rest of Europe Milk Beverage Revenue (billion) Forecast, by Application 2020 & 2033
- Table 54: Rest of Europe Milk Beverage Volume (K) Forecast, by Application 2020 & 2033
- Table 55: Global Milk Beverage Revenue billion Forecast, by Application 2020 & 2033
- Table 56: Global Milk Beverage Volume K Forecast, by Application 2020 & 2033
- Table 57: Global Milk Beverage Revenue billion Forecast, by Type 2020 & 2033
- Table 58: Global Milk Beverage Volume K Forecast, by Type 2020 & 2033
- Table 59: Global Milk Beverage Revenue billion Forecast, by Country 2020 & 2033
- Table 60: Global Milk Beverage Volume K Forecast, by Country 2020 & 2033
- Table 61: Turkey Milk Beverage Revenue (billion) Forecast, by Application 2020 & 2033
- Table 62: Turkey Milk Beverage Volume (K) Forecast, by Application 2020 & 2033
- Table 63: Israel Milk Beverage Revenue (billion) Forecast, by Application 2020 & 2033
- Table 64: Israel Milk Beverage Volume (K) Forecast, by Application 2020 & 2033
- Table 65: GCC Milk Beverage Revenue (billion) Forecast, by Application 2020 & 2033
- Table 66: GCC Milk Beverage Volume (K) Forecast, by Application 2020 & 2033
- Table 67: North Africa Milk Beverage Revenue (billion) Forecast, by Application 2020 & 2033
- Table 68: North Africa Milk Beverage Volume (K) Forecast, by Application 2020 & 2033
- Table 69: South Africa Milk Beverage Revenue (billion) Forecast, by Application 2020 & 2033
- Table 70: South Africa Milk Beverage Volume (K) Forecast, by Application 2020 & 2033
- Table 71: Rest of Middle East & Africa Milk Beverage Revenue (billion) Forecast, by Application 2020 & 2033
- Table 72: Rest of Middle East & Africa Milk Beverage Volume (K) Forecast, by Application 2020 & 2033
- Table 73: Global Milk Beverage Revenue billion Forecast, by Application 2020 & 2033
- Table 74: Global Milk Beverage Volume K Forecast, by Application 2020 & 2033
- Table 75: Global Milk Beverage Revenue billion Forecast, by Type 2020 & 2033
- Table 76: Global Milk Beverage Volume K Forecast, by Type 2020 & 2033
- Table 77: Global Milk Beverage Revenue billion Forecast, by Country 2020 & 2033
- Table 78: Global Milk Beverage Volume K Forecast, by Country 2020 & 2033
- Table 79: China Milk Beverage Revenue (billion) Forecast, by Application 2020 & 2033
- Table 80: China Milk Beverage Volume (K) Forecast, by Application 2020 & 2033
- Table 81: India Milk Beverage Revenue (billion) Forecast, by Application 2020 & 2033
- Table 82: India Milk Beverage Volume (K) Forecast, by Application 2020 & 2033
- Table 83: Japan Milk Beverage Revenue (billion) Forecast, by Application 2020 & 2033
- Table 84: Japan Milk Beverage Volume (K) Forecast, by Application 2020 & 2033
- Table 85: South Korea Milk Beverage Revenue (billion) Forecast, by Application 2020 & 2033
- Table 86: South Korea Milk Beverage Volume (K) Forecast, by Application 2020 & 2033
- Table 87: ASEAN Milk Beverage Revenue (billion) Forecast, by Application 2020 & 2033
- Table 88: ASEAN Milk Beverage Volume (K) Forecast, by Application 2020 & 2033
- Table 89: Oceania Milk Beverage Revenue (billion) Forecast, by Application 2020 & 2033
- Table 90: Oceania Milk Beverage Volume (K) Forecast, by Application 2020 & 2033
- Table 91: Rest of Asia Pacific Milk Beverage Revenue (billion) Forecast, by Application 2020 & 2033
- Table 92: Rest of Asia Pacific Milk Beverage Volume (K) Forecast, by Application 2020 & 2033
Frequently Asked Questions
1. What is the projected Compound Annual Growth Rate (CAGR) of the Milk Beverage?
The projected CAGR is approximately 5.66%.
2. Which companies are prominent players in the Milk Beverage?
Key companies in the market include Blue Diamond Gmilk Beverages, Earth's Own Food Company, Eden Foods, Living Harvest Foods Inc, Anand Milk Producers Union Limited, South East Bottling & Beverage, Krafts Foods Group, Arla Foods, Yili Industrial Group, Mengniu Dairy, Beijing Sanyuan Foods, Shijiazhuang Junlebao Dairy, Bright Food (Group), Wei Chuan Foods Corporation, Groupe Danone, Lifeway Foods, Amul Dairy, Parag Milk Foods, The Hain Celestial Group, Sassy Lassi, Fresh Made Dairy, Nourish Kefir, Best of Farms, Babushka Kefir, Valio Eesti AS, Moringa Milk Industry.
3. What are the main segments of the Milk Beverage?
The market segments include Application, Type.
4. Can you provide details about the market size?
The market size is estimated to be USD 136.18 billion as of 2022.
5. What are some drivers contributing to market growth?
N/A
6. What are the notable trends driving market growth?
N/A
7. Are there any restraints impacting market growth?
N/A
8. Can you provide examples of recent developments in the market?
N/A
9. What pricing options are available for accessing the report?
Pricing options include single-user, multi-user, and enterprise licenses priced at USD 3950.00, USD 5925.00, and USD 7900.00 respectively.
10. Is the market size provided in terms of value or volume?
The market size is provided in terms of value, measured in billion and volume, measured in K.
11. Are there any specific market keywords associated with the report?
Yes, the market keyword associated with the report is "Milk Beverage," which aids in identifying and referencing the specific market segment covered.
12. How do I determine which pricing option suits my needs best?
The pricing options vary based on user requirements and access needs. Individual users may opt for single-user licenses, while businesses requiring broader access may choose multi-user or enterprise licenses for cost-effective access to the report.
13. Are there any additional resources or data provided in the Milk Beverage report?
While the report offers comprehensive insights, it's advisable to review the specific contents or supplementary materials provided to ascertain if additional resources or data are available.
14. How can I stay updated on further developments or reports in the Milk Beverage?
To stay informed about further developments, trends, and reports in the Milk Beverage, consider subscribing to industry newsletters, following relevant companies and organizations, or regularly checking reputable industry news sources and publications.
Methodology
Step 1 - Identification of Relevant Samples Size from Population Database


Step 2 - Approaches for Defining Global Market Size (Value, Volume* & Price*)

Note*: In applicable scenarios
Step 3 - Data Sources
Primary Research
- Web Analytics
- Survey Reports
- Research Institute
- Latest Research Reports
- Opinion Leaders
Secondary Research
- Annual Reports
- White Paper
- Latest Press Release
- Industry Association
- Paid Database
- Investor Presentations

Step 4 - Data Triangulation
Involves using different sources of information in order to increase the validity of a study
These sources are likely to be stakeholders in a program - participants, other researchers, program staff, other community members, and so on.
Then we put all data in single framework & apply various statistical tools to find out the dynamic on the market.
During the analysis stage, feedback from the stakeholder groups would be compared to determine areas of agreement as well as areas of divergence