

Key Insights
The global military satellite market, projected to reach $36 billion by 2025, is set for significant expansion with a Compound Annual Growth Rate (CAGR) of 10% from 2025 to 2033. This growth is driven by escalating geopolitical tensions, necessitating enhanced surveillance and intelligence capabilities. Technological advancements in satellite miniaturization, sensor technology, and data processing are enabling more sophisticated and cost-effective solutions. The rise of smaller satellite constellations offers improved coverage and resilience. Growth is particularly strong in the 10-100kg satellite segment due to reduced launch costs and increased maneuverability. While Geostationary Earth Orbit (GEO) satellites provide continuous coverage, Low Earth Orbit (LEO) constellations are gaining traction for their superior imaging resolution and rapid data transmission. Leading industry players, including Lockheed Martin, Raytheon, Airbus, and national space agencies, are actively innovating and forming strategic partnerships.
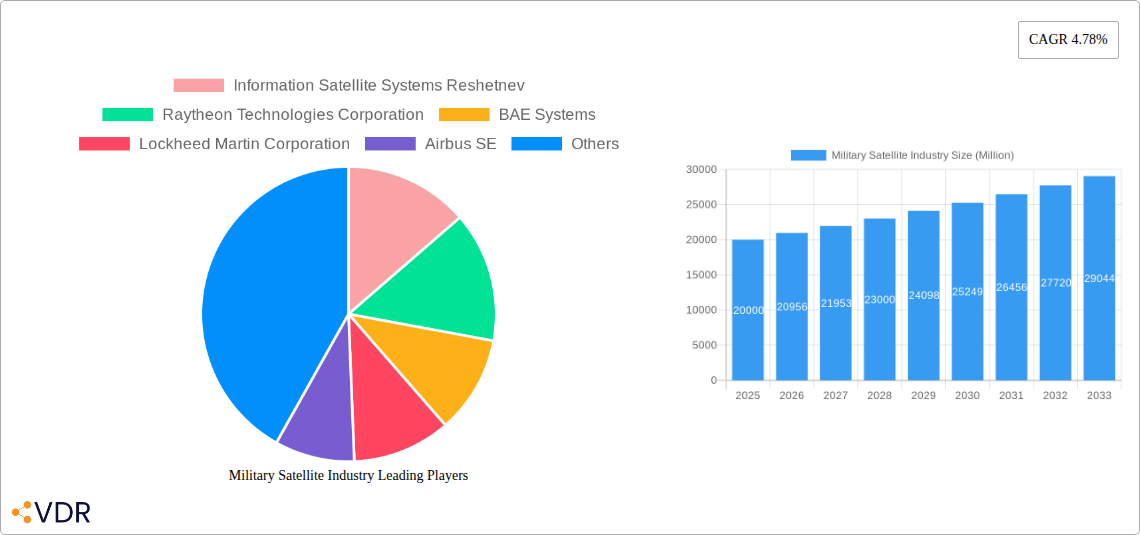
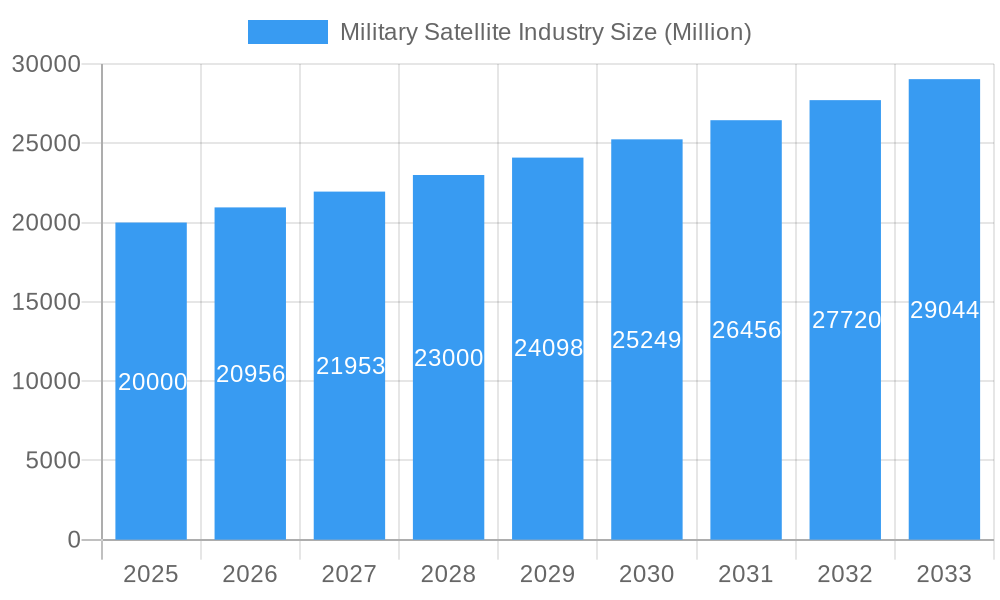
Military Satellite Industry Market Size (In Billion)
Challenges such as high development and launch costs, satellite vulnerability to cyber and physical threats, and increasing space situational awareness complexity are being mitigated by advancements in cybersecurity, resilient satellite design, and international collaboration. The market is segmented by satellite mass (under 10kg to over 1000kg), orbit class (GEO, LEO, MEO), and application (communication, earth observation, navigation, space observation). The ongoing trend towards miniaturization is expected to increase satellite deployment, further driving market expansion. Enhanced satellite resilience and cybersecurity will remain critical for future growth, alongside emerging applications like space-based missile defense systems.
Military Satellite Industry Company Market Share
This report offers a comprehensive analysis of the military satellite industry, detailing market dynamics, growth trends, key players, and future projections. The study encompasses the period from 2019 to 2033, with 2025 serving as the base year for forecasts extending to 2033. Market segmentation includes satellite mass, orbit class, satellite subsystem, and application, providing actionable insights for strategic planning. Market value is reported in billions.
Military Satellite Industry Market Dynamics & Structure
The military satellite market is characterized by high concentration among a few key players, intense competition, and significant technological advancements driving innovation. The market is heavily influenced by governmental spending and defense budgets. Mergers and acquisitions (M&A) activity plays a significant role in shaping the competitive landscape.
- Market Concentration: The market is concentrated, with a few major players holding a substantial market share (estimated at xx%). Smaller companies often specialize in niche areas, such as small satellite subsystems.
- Technological Innovation: Miniaturization, enhanced payload capabilities, and improved resilience to threats are key drivers of innovation. The development of advanced materials and propulsion systems is crucial.
- Regulatory Frameworks: Stringent export controls, licensing requirements, and international space treaties significantly impact market operations. Compliance is paramount.
- Competitive Product Substitutes: Although direct substitutes are limited, advancements in alternative technologies such as drones and ground-based systems can create competitive pressure.
- End-User Demographics: Primarily driven by military and defense agencies of major global powers, with increasing involvement from emerging nations.
- M&A Trends: The market has witnessed several significant M&A activities in the past five years, with an estimated xx deals valued at xx million in the last 5 years. These deals have primarily involved consolidation among larger players and acquisition of smaller technology companies. Innovation barriers include high R&D costs, lengthy development cycles, and stringent testing requirements.
Military Satellite Industry Growth Trends & Insights
The global military satellite market is experiencing robust growth, driven by increased demand for enhanced surveillance, communication, and navigation capabilities. Technological advancements, particularly in miniaturization and improved sensor technology, fuel this growth. The market's expansion is fueled by rising defense budgets globally and strategic geopolitical factors. Increased adoption of small satellites is contributing to market expansion and lowering the barrier of entry for certain segments.
- Market Size Evolution: The market size is projected to grow from xx million in 2019 to xx million in 2025, and xx million in 2033, exhibiting a CAGR of xx%.
- Adoption Rates: Adoption is increasing at xx% annually, driven by increased recognition of operational and strategic benefits by government and military agencies.
- Technological Disruptions: Increased use of AI and Machine Learning (ML) for data processing, improved navigation systems, and the development of more resilient satellite designs contribute to market transformation.
- Consumer Behavior Shifts: The preference is shifting towards smaller, more agile satellites, necessitating modular designs and advanced automation.
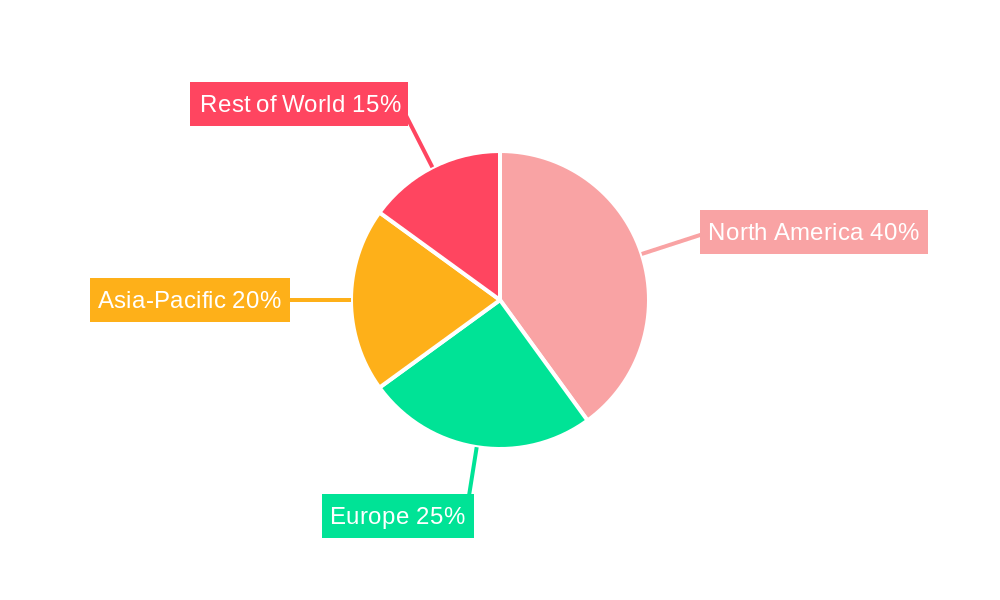
Dominant Regions, Countries, or Segments in Military Satellite Industry
The North American region holds the largest market share (xx%) owing to high defense spending and technological advancements. However, the Asia-Pacific region demonstrates the highest growth potential (xx% CAGR), driven by increasing military modernization efforts and strategic investments. Within the segment breakdown, the demand for LEO and MEO satellites is escalating at a faster pace than GEO satellites, with communication and Earth observation applications leading the market.
- Leading Region: North America. Key Drivers: high defense budgets, robust technological capabilities, and established space infrastructure.
- Highest Growth Potential Region: Asia-Pacific. Key Drivers: increasing defense modernization, strategic geopolitical importance, and government investments in space programs.
- Dominant Satellite Mass Segment: 100-500 kg. Drivers: Balance of performance and cost-effectiveness.
- Dominant Orbit Class: LEO (low earth orbit). Drivers: reduced latency, improved imagery resolution, and cost-effectiveness for constellations.
- Dominant Satellite Subsystem: Satellite Bus & Subsystems. Drivers: Crucial for overall satellite functionality, integration complexity, and high value added.
- Dominant Application: Communication. Drivers: Critical for military command and control, intelligence gathering, and strategic operations.
Military Satellite Industry Product Landscape
The market offers diverse products, ranging from large, high-capacity GEO satellites to constellations of smaller LEO satellites. Recent innovations focus on enhanced payload capacity, improved agility, anti-jamming technologies, and enhanced data processing. The unique selling propositions include miniaturization, improved reliability, cost reduction, and enhanced performance due to advanced technologies.
Key Drivers, Barriers & Challenges in Military Satellite Industry
Key Drivers:
- Increasing defense budgets globally.
- Growing need for enhanced surveillance capabilities.
- Advancements in satellite technology.
- Growing adoption of space-based assets for military applications.
Key Challenges:
- High development and launch costs.
- Stringent regulatory frameworks and licensing requirements.
- Competition from other technologies (e.g., drones).
- Supply chain disruptions negatively impacting production timelines and costs by an estimated xx%.
Emerging Opportunities in Military Satellite Industry
- Growing demand for small satellites for cost-effective constellations.
- Increased focus on resilient and secure satellite networks.
- Adoption of AI and ML for advanced data processing and analytics.
- Growing need for secure communication and data transfer.
Growth Accelerators in the Military Satellite Industry Industry
Technological breakthroughs in propulsion systems, miniaturization, and sensor technologies are key catalysts. Strategic partnerships between government agencies and private companies accelerate innovation and market penetration. Expansion into new applications, such as space-based missile defense systems, will further drive growth.
Key Players Shaping the Military Satellite Industry Market
- Information Satellite Systems Reshetnev
- Raytheon Technologies Corporation
- BAE Systems
- Lockheed Martin Corporation
- Airbus SE
- Viasat Inc
- China Aerospace Science and Technology Corporation (CASC)
- General Dynamics
- Thales
- Elbit Systems
- ROSCOSMOS
- Indian Space Research Organisation (ISRO)
Notable Milestones in Military Satellite Industry Sector
- February 2023: Blue Canyon Technologies LLC, a subsidiary of Raytheon Technologies, provided critical hardware for 114 small payloads on the Transporter-6 launch. This highlights the growing market for small satellite components.
- February 2023: Blue Canyon Technologies LLC, a subsidiary of Raytheon Technologies, provided critical hardware components for several of the smallsat missions aboard the Transporter-6 launch, contributing to the increasing adoption of small satellites in military applications.
- January 2023: Raytheon Intelligence & Space was awarded a contract to develop a prototype missile tracking system for the US Space Force. This signifies a strategic investment in space-based missile defense.
In-Depth Military Satellite Industry Market Outlook
The military satellite market holds significant future potential driven by continuous technological advancements, rising defense budgets, and expanding applications. Strategic partnerships and government initiatives will further accelerate growth. The market is expected to witness increasing adoption of innovative technologies such as AI and ML, fostering significant opportunities for companies specializing in advanced satellite technology.
Military Satellite Industry Segmentation
-
1. Satellite Mass
- 1.1. 10-100kg
- 1.2. 100-500kg
- 1.3. 500-1000kg
- 1.4. Below 10 Kg
- 1.5. above 1000kg
-
2. Orbit Class
- 2.1. GEO
- 2.2. LEO
- 2.3. MEO
-
3. Satellite Subsystem
- 3.1. Propulsion Hardware and Propellant
- 3.2. Satellite Bus & Subsystems
- 3.3. Solar Array & Power Hardware
- 3.4. Structures, Harness & Mechanisms
-
4. Application
- 4.1. Communication
- 4.2. Earth Observation
- 4.3. Navigation
- 4.4. Space Observation
- 4.5. Others
Military Satellite Industry Segmentation By Geography
-
1. North America
- 1.1. United States
- 1.2. Canada
- 1.3. Mexico
-
2. South America
- 2.1. Brazil
- 2.2. Argentina
- 2.3. Rest of South America
-
3. Europe
- 3.1. United Kingdom
- 3.2. Germany
- 3.3. France
- 3.4. Italy
- 3.5. Spain
- 3.6. Russia
- 3.7. Benelux
- 3.8. Nordics
- 3.9. Rest of Europe
-
4. Middle East & Africa
- 4.1. Turkey
- 4.2. Israel
- 4.3. GCC
- 4.4. North Africa
- 4.5. South Africa
- 4.6. Rest of Middle East & Africa
-
5. Asia Pacific
- 5.1. China
- 5.2. India
- 5.3. Japan
- 5.4. South Korea
- 5.5. ASEAN
- 5.6. Oceania
- 5.7. Rest of Asia Pacific
Military Satellite Industry Regional Market Share
Geographic Coverage of Military Satellite Industry
Military Satellite Industry REPORT HIGHLIGHTS
| Aspects | Details |
|---|---|
| Study Period | 2020-2034 |
| Base Year | 2025 |
| Estimated Year | 2026 |
| Forecast Period | 2026-2034 |
| Historical Period | 2020-2025 |
| Growth Rate | CAGR of 10% from 2020-2034 |
| Segmentation |
|
Table of Contents
- 1. Introduction
- 1.1. Research Scope
- 1.2. Market Segmentation
- 1.3. Research Objective
- 1.4. Definitions and Assumptions
- 2. Executive Summary
- 2.1. Market Snapshot
- 3. Market Dynamics
- 3.1. Market Drivers
- 3.2. Market Restrains
- 3.3. Market Trends
- 3.4. Market Opportunities
- 4. Market Factor Analysis
- 4.1. Porters Five Forces
- 4.1.1. Bargaining Power of Suppliers
- 4.1.2. Bargaining Power of Buyers
- 4.1.3. Threat of New Entrants
- 4.1.4. Threat of Substitutes
- 4.1.5. Competitive Rivalry
- 4.2. PESTEL analysis
- 4.3. BCG Analysis
- 4.3.1. Stars (High Growth, High Market Share)
- 4.3.2. Cash Cows (Low Growth, High Market Share)
- 4.3.3. Question Mark (High Growth, Low Market Share)
- 4.3.4. Dogs (Low Growth, Low Market Share)
- 4.4. Ansoff Matrix Analysis
- 4.5. Supply Chain Analysis
- 4.6. Regulatory Landscape
- 4.7. Current Market Potential and Opportunity Assessment (TAM–SAM–SOM Framework)
- 4.8. VDR Analyst Note
- 4.1. Porters Five Forces
- 5. Market Analysis, Insights and Forecast 2021-2033
- 5.1. Market Analysis, Insights and Forecast - by Satellite Mass
- 5.1.1. 10-100kg
- 5.1.2. 100-500kg
- 5.1.3. 500-1000kg
- 5.1.4. Below 10 Kg
- 5.1.5. above 1000kg
- 5.2. Market Analysis, Insights and Forecast - by Orbit Class
- 5.2.1. GEO
- 5.2.2. LEO
- 5.2.3. MEO
- 5.3. Market Analysis, Insights and Forecast - by Satellite Subsystem
- 5.3.1. Propulsion Hardware and Propellant
- 5.3.2. Satellite Bus & Subsystems
- 5.3.3. Solar Array & Power Hardware
- 5.3.4. Structures, Harness & Mechanisms
- 5.4. Market Analysis, Insights and Forecast - by Application
- 5.4.1. Communication
- 5.4.2. Earth Observation
- 5.4.3. Navigation
- 5.4.4. Space Observation
- 5.4.5. Others
- 5.5. Market Analysis, Insights and Forecast - by Region
- 5.5.1. North America
- 5.5.2. South America
- 5.5.3. Europe
- 5.5.4. Middle East & Africa
- 5.5.5. Asia Pacific
- 5.1. Market Analysis, Insights and Forecast - by Satellite Mass
- 6. Global Military Satellite Industry Analysis, Insights and Forecast, 2021-2033
- 6.1. Market Analysis, Insights and Forecast - by Satellite Mass
- 6.1.1. 10-100kg
- 6.1.2. 100-500kg
- 6.1.3. 500-1000kg
- 6.1.4. Below 10 Kg
- 6.1.5. above 1000kg
- 6.2. Market Analysis, Insights and Forecast - by Orbit Class
- 6.2.1. GEO
- 6.2.2. LEO
- 6.2.3. MEO
- 6.3. Market Analysis, Insights and Forecast - by Satellite Subsystem
- 6.3.1. Propulsion Hardware and Propellant
- 6.3.2. Satellite Bus & Subsystems
- 6.3.3. Solar Array & Power Hardware
- 6.3.4. Structures, Harness & Mechanisms
- 6.4. Market Analysis, Insights and Forecast - by Application
- 6.4.1. Communication
- 6.4.2. Earth Observation
- 6.4.3. Navigation
- 6.4.4. Space Observation
- 6.4.5. Others
- 6.1. Market Analysis, Insights and Forecast - by Satellite Mass
- 7. North America Military Satellite Industry Analysis, Insights and Forecast, 2021-2033
- 7.1. Market Analysis, Insights and Forecast - by Satellite Mass
- 7.1.1. 10-100kg
- 7.1.2. 100-500kg
- 7.1.3. 500-1000kg
- 7.1.4. Below 10 Kg
- 7.1.5. above 1000kg
- 7.2. Market Analysis, Insights and Forecast - by Orbit Class
- 7.2.1. GEO
- 7.2.2. LEO
- 7.2.3. MEO
- 7.3. Market Analysis, Insights and Forecast - by Satellite Subsystem
- 7.3.1. Propulsion Hardware and Propellant
- 7.3.2. Satellite Bus & Subsystems
- 7.3.3. Solar Array & Power Hardware
- 7.3.4. Structures, Harness & Mechanisms
- 7.4. Market Analysis, Insights and Forecast - by Application
- 7.4.1. Communication
- 7.4.2. Earth Observation
- 7.4.3. Navigation
- 7.4.4. Space Observation
- 7.4.5. Others
- 7.1. Market Analysis, Insights and Forecast - by Satellite Mass
- 8. South America Military Satellite Industry Analysis, Insights and Forecast, 2021-2033
- 8.1. Market Analysis, Insights and Forecast - by Satellite Mass
- 8.1.1. 10-100kg
- 8.1.2. 100-500kg
- 8.1.3. 500-1000kg
- 8.1.4. Below 10 Kg
- 8.1.5. above 1000kg
- 8.2. Market Analysis, Insights and Forecast - by Orbit Class
- 8.2.1. GEO
- 8.2.2. LEO
- 8.2.3. MEO
- 8.3. Market Analysis, Insights and Forecast - by Satellite Subsystem
- 8.3.1. Propulsion Hardware and Propellant
- 8.3.2. Satellite Bus & Subsystems
- 8.3.3. Solar Array & Power Hardware
- 8.3.4. Structures, Harness & Mechanisms
- 8.4. Market Analysis, Insights and Forecast - by Application
- 8.4.1. Communication
- 8.4.2. Earth Observation
- 8.4.3. Navigation
- 8.4.4. Space Observation
- 8.4.5. Others
- 8.1. Market Analysis, Insights and Forecast - by Satellite Mass
- 9. Europe Military Satellite Industry Analysis, Insights and Forecast, 2021-2033
- 9.1. Market Analysis, Insights and Forecast - by Satellite Mass
- 9.1.1. 10-100kg
- 9.1.2. 100-500kg
- 9.1.3. 500-1000kg
- 9.1.4. Below 10 Kg
- 9.1.5. above 1000kg
- 9.2. Market Analysis, Insights and Forecast - by Orbit Class
- 9.2.1. GEO
- 9.2.2. LEO
- 9.2.3. MEO
- 9.3. Market Analysis, Insights and Forecast - by Satellite Subsystem
- 9.3.1. Propulsion Hardware and Propellant
- 9.3.2. Satellite Bus & Subsystems
- 9.3.3. Solar Array & Power Hardware
- 9.3.4. Structures, Harness & Mechanisms
- 9.4. Market Analysis, Insights and Forecast - by Application
- 9.4.1. Communication
- 9.4.2. Earth Observation
- 9.4.3. Navigation
- 9.4.4. Space Observation
- 9.4.5. Others
- 9.1. Market Analysis, Insights and Forecast - by Satellite Mass
- 10. Middle East & Africa Military Satellite Industry Analysis, Insights and Forecast, 2021-2033
- 10.1. Market Analysis, Insights and Forecast - by Satellite Mass
- 10.1.1. 10-100kg
- 10.1.2. 100-500kg
- 10.1.3. 500-1000kg
- 10.1.4. Below 10 Kg
- 10.1.5. above 1000kg
- 10.2. Market Analysis, Insights and Forecast - by Orbit Class
- 10.2.1. GEO
- 10.2.2. LEO
- 10.2.3. MEO
- 10.3. Market Analysis, Insights and Forecast - by Satellite Subsystem
- 10.3.1. Propulsion Hardware and Propellant
- 10.3.2. Satellite Bus & Subsystems
- 10.3.3. Solar Array & Power Hardware
- 10.3.4. Structures, Harness & Mechanisms
- 10.4. Market Analysis, Insights and Forecast - by Application
- 10.4.1. Communication
- 10.4.2. Earth Observation
- 10.4.3. Navigation
- 10.4.4. Space Observation
- 10.4.5. Others
- 10.1. Market Analysis, Insights and Forecast - by Satellite Mass
- 11. Asia Pacific Military Satellite Industry Analysis, Insights and Forecast, 2021-2033
- 11.1. Market Analysis, Insights and Forecast - by Satellite Mass
- 11.1.1. 10-100kg
- 11.1.2. 100-500kg
- 11.1.3. 500-1000kg
- 11.1.4. Below 10 Kg
- 11.1.5. above 1000kg
- 11.2. Market Analysis, Insights and Forecast - by Orbit Class
- 11.2.1. GEO
- 11.2.2. LEO
- 11.2.3. MEO
- 11.3. Market Analysis, Insights and Forecast - by Satellite Subsystem
- 11.3.1. Propulsion Hardware and Propellant
- 11.3.2. Satellite Bus & Subsystems
- 11.3.3. Solar Array & Power Hardware
- 11.3.4. Structures, Harness & Mechanisms
- 11.4. Market Analysis, Insights and Forecast - by Application
- 11.4.1. Communication
- 11.4.2. Earth Observation
- 11.4.3. Navigation
- 11.4.4. Space Observation
- 11.4.5. Others
- 11.1. Market Analysis, Insights and Forecast - by Satellite Mass
- 12. Competitive Analysis
- 12.1. Company Profiles
- 12.1.1 Information Satellite Systems Reshetnev
- 12.1.1.1. Company Overview
- 12.1.1.2. Products
- 12.1.1.3. Company Financials
- 12.1.1.4. SWOT Analysis
- 12.1.2 Raytheon Technologies Corporation
- 12.1.2.1. Company Overview
- 12.1.2.2. Products
- 12.1.2.3. Company Financials
- 12.1.2.4. SWOT Analysis
- 12.1.3 BAE Systems
- 12.1.3.1. Company Overview
- 12.1.3.2. Products
- 12.1.3.3. Company Financials
- 12.1.3.4. SWOT Analysis
- 12.1.4 Lockheed Martin Corporation
- 12.1.4.1. Company Overview
- 12.1.4.2. Products
- 12.1.4.3. Company Financials
- 12.1.4.4. SWOT Analysis
- 12.1.5 Airbus SE
- 12.1.5.1. Company Overview
- 12.1.5.2. Products
- 12.1.5.3. Company Financials
- 12.1.5.4. SWOT Analysis
- 12.1.6 Viasat Inc
- 12.1.6.1. Company Overview
- 12.1.6.2. Products
- 12.1.6.3. Company Financials
- 12.1.6.4. SWOT Analysis
- 12.1.7 China Aerospace Science and Technology Corporation (CASC)
- 12.1.7.1. Company Overview
- 12.1.7.2. Products
- 12.1.7.3. Company Financials
- 12.1.7.4. SWOT Analysis
- 12.1.8 General Dynamics
- 12.1.8.1. Company Overview
- 12.1.8.2. Products
- 12.1.8.3. Company Financials
- 12.1.8.4. SWOT Analysis
- 12.1.9 Thales
- 12.1.9.1. Company Overview
- 12.1.9.2. Products
- 12.1.9.3. Company Financials
- 12.1.9.4. SWOT Analysis
- 12.1.10 Elbit Systems
- 12.1.10.1. Company Overview
- 12.1.10.2. Products
- 12.1.10.3. Company Financials
- 12.1.10.4. SWOT Analysis
- 12.1.11 ROSCOSMOS
- 12.1.11.1. Company Overview
- 12.1.11.2. Products
- 12.1.11.3. Company Financials
- 12.1.11.4. SWOT Analysis
- 12.1.12 Indian Space Research Organisation (ISRO)
- 12.1.12.1. Company Overview
- 12.1.12.2. Products
- 12.1.12.3. Company Financials
- 12.1.12.4. SWOT Analysis
- 12.1.1 Information Satellite Systems Reshetnev
- 12.2. Market Entropy
- 12.2.1 Company's Key Areas Served
- 12.2.2 Recent Developments
- 12.3. Company Market Share Analysis 2025
- 12.3.1 Top 5 Companies Market Share Analysis
- 12.3.2 Top 3 Companies Market Share Analysis
- 12.4. List of Potential Customers
- 13. Research Methodology
List of Figures
- Figure 1: Global Military Satellite Industry Revenue Breakdown (billion, %) by Region 2025 & 2033
- Figure 2: North America Military Satellite Industry Revenue (billion), by Satellite Mass 2025 & 2033
- Figure 3: North America Military Satellite Industry Revenue Share (%), by Satellite Mass 2025 & 2033
- Figure 4: North America Military Satellite Industry Revenue (billion), by Orbit Class 2025 & 2033
- Figure 5: North America Military Satellite Industry Revenue Share (%), by Orbit Class 2025 & 2033
- Figure 6: North America Military Satellite Industry Revenue (billion), by Satellite Subsystem 2025 & 2033
- Figure 7: North America Military Satellite Industry Revenue Share (%), by Satellite Subsystem 2025 & 2033
- Figure 8: North America Military Satellite Industry Revenue (billion), by Application 2025 & 2033
- Figure 9: North America Military Satellite Industry Revenue Share (%), by Application 2025 & 2033
- Figure 10: North America Military Satellite Industry Revenue (billion), by Country 2025 & 2033
- Figure 11: North America Military Satellite Industry Revenue Share (%), by Country 2025 & 2033
- Figure 12: South America Military Satellite Industry Revenue (billion), by Satellite Mass 2025 & 2033
- Figure 13: South America Military Satellite Industry Revenue Share (%), by Satellite Mass 2025 & 2033
- Figure 14: South America Military Satellite Industry Revenue (billion), by Orbit Class 2025 & 2033
- Figure 15: South America Military Satellite Industry Revenue Share (%), by Orbit Class 2025 & 2033
- Figure 16: South America Military Satellite Industry Revenue (billion), by Satellite Subsystem 2025 & 2033
- Figure 17: South America Military Satellite Industry Revenue Share (%), by Satellite Subsystem 2025 & 2033
- Figure 18: South America Military Satellite Industry Revenue (billion), by Application 2025 & 2033
- Figure 19: South America Military Satellite Industry Revenue Share (%), by Application 2025 & 2033
- Figure 20: South America Military Satellite Industry Revenue (billion), by Country 2025 & 2033
- Figure 21: South America Military Satellite Industry Revenue Share (%), by Country 2025 & 2033
- Figure 22: Europe Military Satellite Industry Revenue (billion), by Satellite Mass 2025 & 2033
- Figure 23: Europe Military Satellite Industry Revenue Share (%), by Satellite Mass 2025 & 2033
- Figure 24: Europe Military Satellite Industry Revenue (billion), by Orbit Class 2025 & 2033
- Figure 25: Europe Military Satellite Industry Revenue Share (%), by Orbit Class 2025 & 2033
- Figure 26: Europe Military Satellite Industry Revenue (billion), by Satellite Subsystem 2025 & 2033
- Figure 27: Europe Military Satellite Industry Revenue Share (%), by Satellite Subsystem 2025 & 2033
- Figure 28: Europe Military Satellite Industry Revenue (billion), by Application 2025 & 2033
- Figure 29: Europe Military Satellite Industry Revenue Share (%), by Application 2025 & 2033
- Figure 30: Europe Military Satellite Industry Revenue (billion), by Country 2025 & 2033
- Figure 31: Europe Military Satellite Industry Revenue Share (%), by Country 2025 & 2033
- Figure 32: Middle East & Africa Military Satellite Industry Revenue (billion), by Satellite Mass 2025 & 2033
- Figure 33: Middle East & Africa Military Satellite Industry Revenue Share (%), by Satellite Mass 2025 & 2033
- Figure 34: Middle East & Africa Military Satellite Industry Revenue (billion), by Orbit Class 2025 & 2033
- Figure 35: Middle East & Africa Military Satellite Industry Revenue Share (%), by Orbit Class 2025 & 2033
- Figure 36: Middle East & Africa Military Satellite Industry Revenue (billion), by Satellite Subsystem 2025 & 2033
- Figure 37: Middle East & Africa Military Satellite Industry Revenue Share (%), by Satellite Subsystem 2025 & 2033
- Figure 38: Middle East & Africa Military Satellite Industry Revenue (billion), by Application 2025 & 2033
- Figure 39: Middle East & Africa Military Satellite Industry Revenue Share (%), by Application 2025 & 2033
- Figure 40: Middle East & Africa Military Satellite Industry Revenue (billion), by Country 2025 & 2033
- Figure 41: Middle East & Africa Military Satellite Industry Revenue Share (%), by Country 2025 & 2033
- Figure 42: Asia Pacific Military Satellite Industry Revenue (billion), by Satellite Mass 2025 & 2033
- Figure 43: Asia Pacific Military Satellite Industry Revenue Share (%), by Satellite Mass 2025 & 2033
- Figure 44: Asia Pacific Military Satellite Industry Revenue (billion), by Orbit Class 2025 & 2033
- Figure 45: Asia Pacific Military Satellite Industry Revenue Share (%), by Orbit Class 2025 & 2033
- Figure 46: Asia Pacific Military Satellite Industry Revenue (billion), by Satellite Subsystem 2025 & 2033
- Figure 47: Asia Pacific Military Satellite Industry Revenue Share (%), by Satellite Subsystem 2025 & 2033
- Figure 48: Asia Pacific Military Satellite Industry Revenue (billion), by Application 2025 & 2033
- Figure 49: Asia Pacific Military Satellite Industry Revenue Share (%), by Application 2025 & 2033
- Figure 50: Asia Pacific Military Satellite Industry Revenue (billion), by Country 2025 & 2033
- Figure 51: Asia Pacific Military Satellite Industry Revenue Share (%), by Country 2025 & 2033
List of Tables
- Table 1: Global Military Satellite Industry Revenue billion Forecast, by Satellite Mass 2020 & 2033
- Table 2: Global Military Satellite Industry Revenue billion Forecast, by Orbit Class 2020 & 2033
- Table 3: Global Military Satellite Industry Revenue billion Forecast, by Satellite Subsystem 2020 & 2033
- Table 4: Global Military Satellite Industry Revenue billion Forecast, by Application 2020 & 2033
- Table 5: Global Military Satellite Industry Revenue billion Forecast, by Region 2020 & 2033
- Table 6: Global Military Satellite Industry Revenue billion Forecast, by Satellite Mass 2020 & 2033
- Table 7: Global Military Satellite Industry Revenue billion Forecast, by Orbit Class 2020 & 2033
- Table 8: Global Military Satellite Industry Revenue billion Forecast, by Satellite Subsystem 2020 & 2033
- Table 9: Global Military Satellite Industry Revenue billion Forecast, by Application 2020 & 2033
- Table 10: Global Military Satellite Industry Revenue billion Forecast, by Country 2020 & 2033
- Table 11: United States Military Satellite Industry Revenue (billion) Forecast, by Application 2020 & 2033
- Table 12: Canada Military Satellite Industry Revenue (billion) Forecast, by Application 2020 & 2033
- Table 13: Mexico Military Satellite Industry Revenue (billion) Forecast, by Application 2020 & 2033
- Table 14: Global Military Satellite Industry Revenue billion Forecast, by Satellite Mass 2020 & 2033
- Table 15: Global Military Satellite Industry Revenue billion Forecast, by Orbit Class 2020 & 2033
- Table 16: Global Military Satellite Industry Revenue billion Forecast, by Satellite Subsystem 2020 & 2033
- Table 17: Global Military Satellite Industry Revenue billion Forecast, by Application 2020 & 2033
- Table 18: Global Military Satellite Industry Revenue billion Forecast, by Country 2020 & 2033
- Table 19: Brazil Military Satellite Industry Revenue (billion) Forecast, by Application 2020 & 2033
- Table 20: Argentina Military Satellite Industry Revenue (billion) Forecast, by Application 2020 & 2033
- Table 21: Rest of South America Military Satellite Industry Revenue (billion) Forecast, by Application 2020 & 2033
- Table 22: Global Military Satellite Industry Revenue billion Forecast, by Satellite Mass 2020 & 2033
- Table 23: Global Military Satellite Industry Revenue billion Forecast, by Orbit Class 2020 & 2033
- Table 24: Global Military Satellite Industry Revenue billion Forecast, by Satellite Subsystem 2020 & 2033
- Table 25: Global Military Satellite Industry Revenue billion Forecast, by Application 2020 & 2033
- Table 26: Global Military Satellite Industry Revenue billion Forecast, by Country 2020 & 2033
- Table 27: United Kingdom Military Satellite Industry Revenue (billion) Forecast, by Application 2020 & 2033
- Table 28: Germany Military Satellite Industry Revenue (billion) Forecast, by Application 2020 & 2033
- Table 29: France Military Satellite Industry Revenue (billion) Forecast, by Application 2020 & 2033
- Table 30: Italy Military Satellite Industry Revenue (billion) Forecast, by Application 2020 & 2033
- Table 31: Spain Military Satellite Industry Revenue (billion) Forecast, by Application 2020 & 2033
- Table 32: Russia Military Satellite Industry Revenue (billion) Forecast, by Application 2020 & 2033
- Table 33: Benelux Military Satellite Industry Revenue (billion) Forecast, by Application 2020 & 2033
- Table 34: Nordics Military Satellite Industry Revenue (billion) Forecast, by Application 2020 & 2033
- Table 35: Rest of Europe Military Satellite Industry Revenue (billion) Forecast, by Application 2020 & 2033
- Table 36: Global Military Satellite Industry Revenue billion Forecast, by Satellite Mass 2020 & 2033
- Table 37: Global Military Satellite Industry Revenue billion Forecast, by Orbit Class 2020 & 2033
- Table 38: Global Military Satellite Industry Revenue billion Forecast, by Satellite Subsystem 2020 & 2033
- Table 39: Global Military Satellite Industry Revenue billion Forecast, by Application 2020 & 2033
- Table 40: Global Military Satellite Industry Revenue billion Forecast, by Country 2020 & 2033
- Table 41: Turkey Military Satellite Industry Revenue (billion) Forecast, by Application 2020 & 2033
- Table 42: Israel Military Satellite Industry Revenue (billion) Forecast, by Application 2020 & 2033
- Table 43: GCC Military Satellite Industry Revenue (billion) Forecast, by Application 2020 & 2033
- Table 44: North Africa Military Satellite Industry Revenue (billion) Forecast, by Application 2020 & 2033
- Table 45: South Africa Military Satellite Industry Revenue (billion) Forecast, by Application 2020 & 2033
- Table 46: Rest of Middle East & Africa Military Satellite Industry Revenue (billion) Forecast, by Application 2020 & 2033
- Table 47: Global Military Satellite Industry Revenue billion Forecast, by Satellite Mass 2020 & 2033
- Table 48: Global Military Satellite Industry Revenue billion Forecast, by Orbit Class 2020 & 2033
- Table 49: Global Military Satellite Industry Revenue billion Forecast, by Satellite Subsystem 2020 & 2033
- Table 50: Global Military Satellite Industry Revenue billion Forecast, by Application 2020 & 2033
- Table 51: Global Military Satellite Industry Revenue billion Forecast, by Country 2020 & 2033
- Table 52: China Military Satellite Industry Revenue (billion) Forecast, by Application 2020 & 2033
- Table 53: India Military Satellite Industry Revenue (billion) Forecast, by Application 2020 & 2033
- Table 54: Japan Military Satellite Industry Revenue (billion) Forecast, by Application 2020 & 2033
- Table 55: South Korea Military Satellite Industry Revenue (billion) Forecast, by Application 2020 & 2033
- Table 56: ASEAN Military Satellite Industry Revenue (billion) Forecast, by Application 2020 & 2033
- Table 57: Oceania Military Satellite Industry Revenue (billion) Forecast, by Application 2020 & 2033
- Table 58: Rest of Asia Pacific Military Satellite Industry Revenue (billion) Forecast, by Application 2020 & 2033
Frequently Asked Questions
1. What is the projected Compound Annual Growth Rate (CAGR) of the Military Satellite Industry?
The projected CAGR is approximately 10%.
2. Which companies are prominent players in the Military Satellite Industry?
Key companies in the market include Information Satellite Systems Reshetnev, Raytheon Technologies Corporation, BAE Systems, Lockheed Martin Corporation, Airbus SE, Viasat Inc, China Aerospace Science and Technology Corporation (CASC), General Dynamics, Thales, Elbit Systems, ROSCOSMOS, Indian Space Research Organisation (ISRO).
3. What are the main segments of the Military Satellite Industry?
The market segments include Satellite Mass, Orbit Class, Satellite Subsystem, Application.
4. Can you provide details about the market size?
The market size is estimated to be USD 36 billion as of 2022.
5. What are some drivers contributing to market growth?
N/A
6. What are the notable trends driving market growth?
OTHER KEY INDUSTRY TRENDS COVERED IN THE REPORT.
7. Are there any restraints impacting market growth?
N/A
8. Can you provide examples of recent developments in the market?
February 2023: Blue Canyon Technologies LLC, a subsidiary of Raytheon Technologies, provided critical hardware components for several of the SmallSat missions aboard the Transporter-6 launch that pitched 114 small payloads into polar orbit.February 2023: Blue Canyon Technologies LLC, a subsidiary of Raytheon Technologies, provided critical hardware components for several of the smallsat missions aboard the Transporter-6 launch, which pitched 114 small payloads into polar orbit.January 2023: Raytheon Intelligence & Space was awarded a major contract to develop a prototype missile tracking system for the US Space Force. MTC is the service's first missile tracking system for medium earth orbit. Under this contract, Raytheon Intelligence & Space will act as the main contractor, developing and delivering a state-of-the-art space vehicle, missile tracking mission payload, and command and control elements for ground and data processing missions.
9. What pricing options are available for accessing the report?
Pricing options include single-user, multi-user, and enterprise licenses priced at USD 3800, USD 4500, and USD 5800 respectively.
10. Is the market size provided in terms of value or volume?
The market size is provided in terms of value, measured in billion.
11. Are there any specific market keywords associated with the report?
Yes, the market keyword associated with the report is "Military Satellite Industry," which aids in identifying and referencing the specific market segment covered.
12. How do I determine which pricing option suits my needs best?
The pricing options vary based on user requirements and access needs. Individual users may opt for single-user licenses, while businesses requiring broader access may choose multi-user or enterprise licenses for cost-effective access to the report.
13. Are there any additional resources or data provided in the Military Satellite Industry report?
While the report offers comprehensive insights, it's advisable to review the specific contents or supplementary materials provided to ascertain if additional resources or data are available.
14. How can I stay updated on further developments or reports in the Military Satellite Industry?
To stay informed about further developments, trends, and reports in the Military Satellite Industry, consider subscribing to industry newsletters, following relevant companies and organizations, or regularly checking reputable industry news sources and publications.
Methodology
Step 1 - Identification of Relevant Samples Size from Population Database


Step 2 - Approaches for Defining Global Market Size (Value, Volume* & Price*)

Note*: In applicable scenarios
Step 3 - Data Sources
Primary Research
- Web Analytics
- Survey Reports
- Research Institute
- Latest Research Reports
- Opinion Leaders
Secondary Research
- Annual Reports
- White Paper
- Latest Press Release
- Industry Association
- Paid Database
- Investor Presentations

Step 4 - Data Triangulation
Involves using different sources of information in order to increase the validity of a study
These sources are likely to be stakeholders in a program - participants, other researchers, program staff, other community members, and so on.
Then we put all data in single framework & apply various statistical tools to find out the dynamic on the market.
During the analysis stage, feedback from the stakeholder groups would be compared to determine areas of agreement as well as areas of divergence