
Key Insights
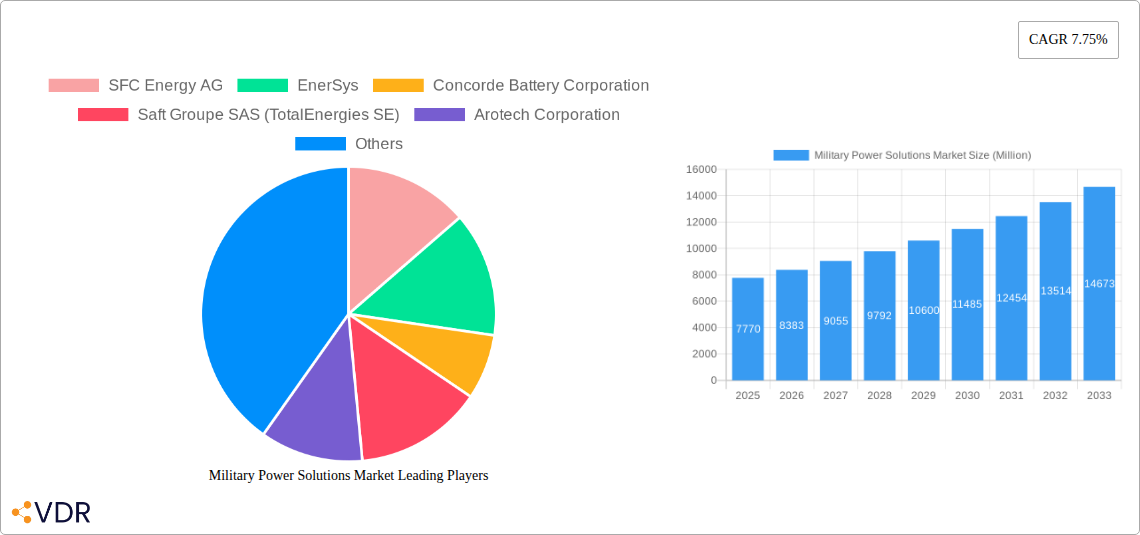
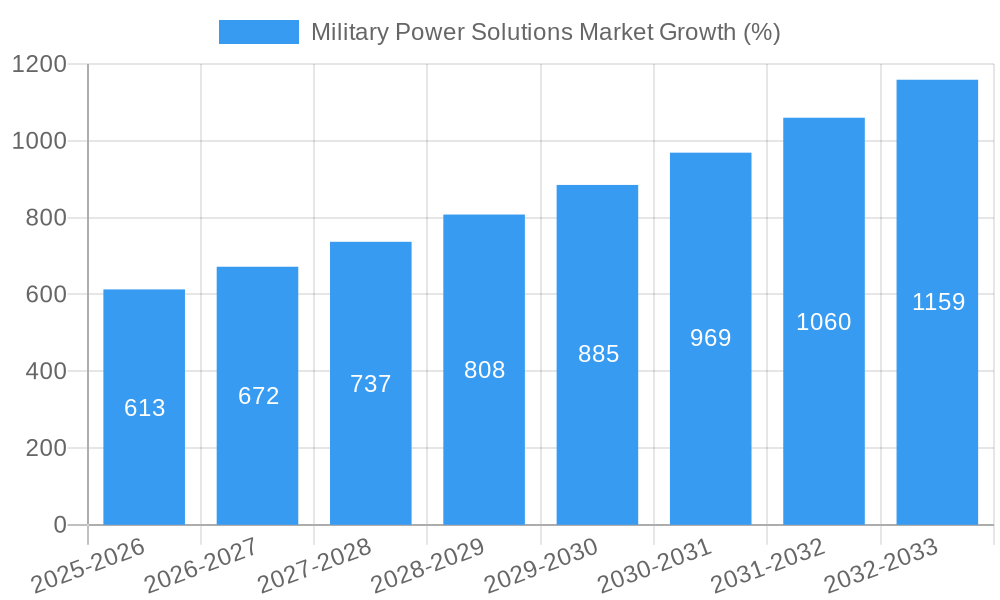
The Military Power Solutions market, valued at $7.77 billion in 2025, is projected to experience robust growth, driven by a Compound Annual Growth Rate (CAGR) of 7.75% from 2025 to 2033. This expansion is fueled by several key factors. Increased defense budgets globally, particularly among major military powers, are a significant driver. Furthermore, the growing demand for advanced, lightweight, and reliable power solutions for increasingly sophisticated military equipment, including unmanned aerial vehicles (UAVs), advanced communication systems, and electric vehicles, is significantly impacting market growth. Technological advancements in battery technology, such as the development of high-energy density lithium-ion batteries and fuel cells, are also contributing to market expansion. The rising adoption of hybrid and electric power systems within military platforms across land, air, and sea applications further strengthens this market trajectory. The market is segmented by type (portable and non-portable), source (batteries, generators, and other sources), and platform (air, land, and sea), providing diverse opportunities for market players. Competition is intense, with established players like SFC Energy AG, EnerSys, and Saft Groupe SAS competing alongside emerging technology providers.
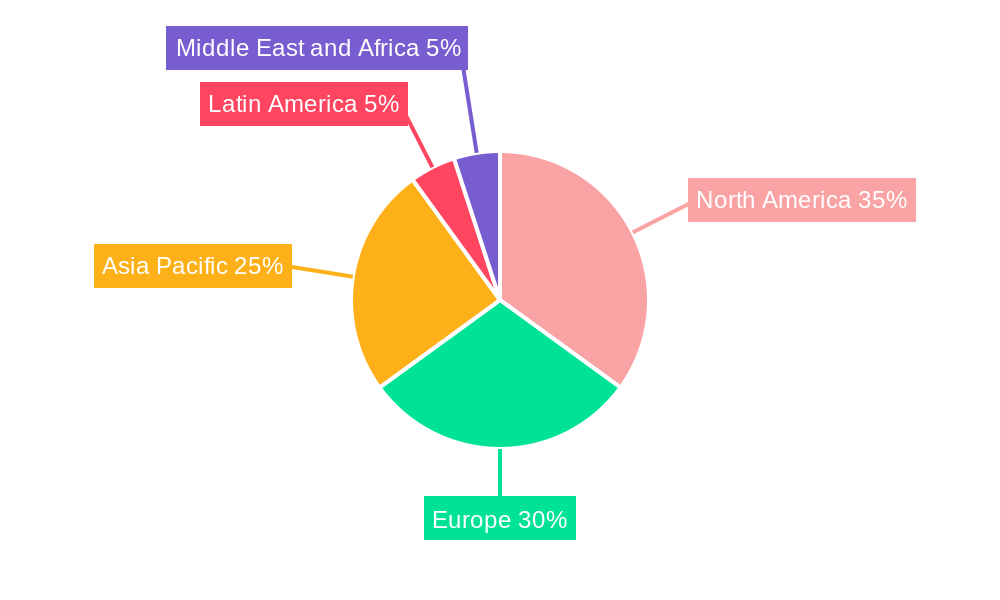
Regional variations in market growth are expected. North America and Europe are anticipated to maintain significant market shares due to robust defense spending and technological innovation in these regions. However, the Asia-Pacific region is poised for substantial growth, driven by increasing military modernization efforts in countries like China and India. The Middle East and Africa are also expected to show moderate growth, primarily fueled by increasing investment in defense infrastructure and modernization projects. Market restraints include the high initial investment costs associated with advanced power solutions and the ongoing challenges related to ensuring the reliability and safety of these systems in harsh military environments. However, technological advancements and the increasing emphasis on energy efficiency are expected to mitigate these challenges over the forecast period.
Military Power Solutions Market: A Comprehensive Market Report (2019-2033)
This in-depth report provides a comprehensive analysis of the Military Power Solutions market, encompassing market dynamics, growth trends, regional analysis, product landscape, key players, and future outlook. The study period covers 2019-2033, with 2025 as the base and estimated year. This report is an invaluable resource for industry professionals, investors, and strategic decision-makers seeking to understand and capitalize on opportunities within this dynamic sector. The market is segmented by Type (Portable, Non-portable), Source (Batteries, Generators, Other Sources), and Platform (Air, Land, Sea). The total market size is projected to reach xx Million units by 2033.
Military Power Solutions Market Dynamics & Structure
The Military Power Solutions market is characterized by moderate concentration, with key players such as EnerSys, RTX Corporation, and Saft Groupe SAS (TotalEnergies SE) holding significant market share. Technological innovation, particularly in battery technology and power generation systems, is a primary growth driver. Stringent regulatory frameworks concerning safety and performance standards influence market dynamics. Competitive product substitutes, including alternative energy sources, exert pressure on market growth. The end-user demographic primarily comprises military forces globally, with demand influenced by defense budgets and geopolitical factors. M&A activity, as evidenced by EnerSys's acquisition of IBCS in 2023, indicates a trend toward consolidation and expansion of service offerings.
- Market Concentration: Moderately concentrated, with top 5 players holding approximately xx% market share in 2025.
- Technological Innovation: Focus on lightweight, high-capacity batteries, fuel-efficient generators, and advanced power management systems.
- Regulatory Framework: Stringent safety and performance standards influence product design and market access.
- Competitive Substitutes: Alternative energy sources, such as solar and fuel cells, pose a competitive threat.
- End-User Demographics: Primarily military forces globally, driven by defense budgets and operational requirements.
- M&A Trends: Consolidation through acquisitions and mergers to expand market reach and service portfolios. XX M&A deals were recorded between 2019 and 2024.
Military Power Solutions Market Growth Trends & Insights
The Military Power Solutions market experienced a CAGR of xx% during the historical period (2019-2024) and is projected to grow at a CAGR of xx% during the forecast period (2025-2033), reaching a market size of xx Million units by 2033. This growth is driven by increasing defense budgets, modernization of military equipment, and the rising demand for portable and reliable power solutions in diverse operational environments. Technological advancements, including the development of high-energy density batteries and improved generator efficiency, are accelerating market adoption. Shifts in consumer behavior towards lighter, more efficient, and sustainable power solutions further influence market growth. Market penetration is expected to increase from xx% in 2025 to xx% by 2033.
Dominant Regions, Countries, or Segments in Military Power Solutions Market
The North American region currently dominates the Military Power Solutions market, driven by substantial defense spending and a strong presence of major industry players. Within the segments, the demand for portable power solutions and battery-based systems is experiencing the highest growth. The land platform segment shows significant dominance due to the extensive use of ground vehicles and stationary power systems.
- Leading Region: North America, driven by high defense spending and a strong domestic industry.
- Leading Segment (by Type): Portable power solutions, due to their versatility in various operational scenarios.
- Leading Segment (by Source): Batteries, driven by advancements in battery technology and growing demand for lighter, more efficient power sources.
- Leading Segment (by Platform): Land, due to the high number of ground vehicles and stationary power systems in use.
- Key Drivers: High defense budgets, technological advancements, and rising demand for reliable power sources.
Military Power Solutions Market Product Landscape
The Military Power Solutions market offers a diverse range of products, including portable and non-portable generators, batteries with varying capacities and chemistries, and other specialized power sources. Innovations focus on improving energy density, reducing weight and size, enhancing durability, and improving power management capabilities. Unique selling propositions include enhanced reliability, rugged design for harsh environments, and advanced features like remote monitoring and control. Technological advancements are concentrated on incorporating more efficient energy storage and conversion technologies.
Key Drivers, Barriers & Challenges in Military Power Solutions Market
Key Drivers: Increasing defense spending globally, technological advancements in battery and generator technologies, demand for improved power efficiency and reliability in military operations, and the growing need for portable power solutions.
Challenges: High initial investment costs associated with advanced technology, supply chain disruptions impacting component availability, stringent regulatory compliance requirements, and intense competition from established and emerging players. Supply chain disruptions have resulted in xx% increase in component costs in the last year.
Emerging Opportunities in Military Power Solutions Market
Emerging opportunities include the adoption of alternative energy sources such as fuel cells and solar power, development of intelligent power management systems for optimized energy utilization, integration of advanced power solutions with unmanned aerial vehicles and robotics, and expansion into new markets with growing defense spending.
Growth Accelerators in the Military Power Solutions Market Industry
Technological advancements in battery chemistry and power generation, strategic partnerships between defense contractors and technology providers, and expansion into emerging markets with rising defense modernization programs are key catalysts driving long-term growth in the Military Power Solutions market.
Key Players Shaping the Military Power Solutions Market Market
- SFC Energy AG
- EnerSys
- Concorde Battery Corporation
- Saft Groupe SAS (TotalEnergies SE)
- Arotech Corporation
- RTX Corporation
- Denchi Group Ltd
- Eniquest
- HIMOINSA S
- Cummins Inc
- EaglePicher Technologies LLC
Notable Milestones in Military Power Solutions Market Sector
- August 2023: Collins Aerospace (RTX Corporation) awarded a USD 24 million contract for electric generators for the US Army. This highlights the growing demand for advanced power solutions for military vehicles.
- April 2023: EnerSys acquired Industrial Battery and Charger Services Limited (IBCS), strengthening its service offerings and UK market presence. This signifies the ongoing consolidation within the industry.
In-Depth Military Power Solutions Market Market Outlook
The Military Power Solutions market is poised for significant growth driven by ongoing technological advancements, increasing defense budgets, and the expanding application of these solutions across various military platforms. Strategic partnerships and investments in research and development will further propel market expansion. The focus on lighter, more efficient, and sustainable power solutions will shape the future of this dynamic market, creating numerous opportunities for existing and emerging players.
Military Power Solutions Market Segmentation
-
1. Type
- 1.1. Portable
- 1.2. Non-portable
-
2. Source
- 2.1. Batteries
- 2.2. Generators
- 2.3. Other Sources
-
3. Platform
- 3.1. Air
- 3.2. Land
- 3.3. Sea
Military Power Solutions Market Segmentation By Geography
-
1. North America
- 1.1. United States
- 1.2. Canada
-
2. Europe
- 2.1. United Kingdom
- 2.2. Germany
- 2.3. France
- 2.4. Russia
- 2.5. Rest of Europe
-
3. Asia Pacific
- 3.1. China
- 3.2. India
- 3.3. Japan
- 3.4. South Korea
- 3.5. Rest of Asia Pacific
-
4. Latin America
- 4.1. Brazil
- 4.2. Rest of Latin America
-
5. Middle East and Africa
- 5.1. United Arab Emirates
- 5.2. Saudi Arabia
- 5.3. Israel
- 5.4. Rest of Middle East and Africa
Military Power Solutions Market REPORT HIGHLIGHTS
| Aspects | Details |
|---|---|
| Study Period | 2019-2033 |
| Base Year | 2024 |
| Estimated Year | 2025 |
| Forecast Period | 2025-2033 |
| Historical Period | 2019-2024 |
| Growth Rate | CAGR of 7.75% from 2019-2033 |
| Segmentation |
|
Table of Contents
- 1. Introduction
- 1.1. Research Scope
- 1.2. Market Segmentation
- 1.3. Research Methodology
- 1.4. Definitions and Assumptions
- 2. Executive Summary
- 2.1. Introduction
- 3. Market Dynamics
- 3.1. Introduction
- 3.2. Market Drivers
- 3.3. Market Restrains
- 3.4. Market Trends
- 3.4.1. Generators Segment to Continue Market Share Domination
- 4. Market Factor Analysis
- 4.1. Porters Five Forces
- 4.2. Supply/Value Chain
- 4.3. PESTEL analysis
- 4.4. Market Entropy
- 4.5. Patent/Trademark Analysis
- 5. Global Military Power Solutions Market Analysis, Insights and Forecast, 2019-2031
- 5.1. Market Analysis, Insights and Forecast - by Type
- 5.1.1. Portable
- 5.1.2. Non-portable
- 5.2. Market Analysis, Insights and Forecast - by Source
- 5.2.1. Batteries
- 5.2.2. Generators
- 5.2.3. Other Sources
- 5.3. Market Analysis, Insights and Forecast - by Platform
- 5.3.1. Air
- 5.3.2. Land
- 5.3.3. Sea
- 5.4. Market Analysis, Insights and Forecast - by Region
- 5.4.1. North America
- 5.4.2. Europe
- 5.4.3. Asia Pacific
- 5.4.4. Latin America
- 5.4.5. Middle East and Africa
- 5.1. Market Analysis, Insights and Forecast - by Type
- 6. North America Military Power Solutions Market Analysis, Insights and Forecast, 2019-2031
- 6.1. Market Analysis, Insights and Forecast - by Type
- 6.1.1. Portable
- 6.1.2. Non-portable
- 6.2. Market Analysis, Insights and Forecast - by Source
- 6.2.1. Batteries
- 6.2.2. Generators
- 6.2.3. Other Sources
- 6.3. Market Analysis, Insights and Forecast - by Platform
- 6.3.1. Air
- 6.3.2. Land
- 6.3.3. Sea
- 6.1. Market Analysis, Insights and Forecast - by Type
- 7. Europe Military Power Solutions Market Analysis, Insights and Forecast, 2019-2031
- 7.1. Market Analysis, Insights and Forecast - by Type
- 7.1.1. Portable
- 7.1.2. Non-portable
- 7.2. Market Analysis, Insights and Forecast - by Source
- 7.2.1. Batteries
- 7.2.2. Generators
- 7.2.3. Other Sources
- 7.3. Market Analysis, Insights and Forecast - by Platform
- 7.3.1. Air
- 7.3.2. Land
- 7.3.3. Sea
- 7.1. Market Analysis, Insights and Forecast - by Type
- 8. Asia Pacific Military Power Solutions Market Analysis, Insights and Forecast, 2019-2031
- 8.1. Market Analysis, Insights and Forecast - by Type
- 8.1.1. Portable
- 8.1.2. Non-portable
- 8.2. Market Analysis, Insights and Forecast - by Source
- 8.2.1. Batteries
- 8.2.2. Generators
- 8.2.3. Other Sources
- 8.3. Market Analysis, Insights and Forecast - by Platform
- 8.3.1. Air
- 8.3.2. Land
- 8.3.3. Sea
- 8.1. Market Analysis, Insights and Forecast - by Type
- 9. Latin America Military Power Solutions Market Analysis, Insights and Forecast, 2019-2031
- 9.1. Market Analysis, Insights and Forecast - by Type
- 9.1.1. Portable
- 9.1.2. Non-portable
- 9.2. Market Analysis, Insights and Forecast - by Source
- 9.2.1. Batteries
- 9.2.2. Generators
- 9.2.3. Other Sources
- 9.3. Market Analysis, Insights and Forecast - by Platform
- 9.3.1. Air
- 9.3.2. Land
- 9.3.3. Sea
- 9.1. Market Analysis, Insights and Forecast - by Type
- 10. Middle East and Africa Military Power Solutions Market Analysis, Insights and Forecast, 2019-2031
- 10.1. Market Analysis, Insights and Forecast - by Type
- 10.1.1. Portable
- 10.1.2. Non-portable
- 10.2. Market Analysis, Insights and Forecast - by Source
- 10.2.1. Batteries
- 10.2.2. Generators
- 10.2.3. Other Sources
- 10.3. Market Analysis, Insights and Forecast - by Platform
- 10.3.1. Air
- 10.3.2. Land
- 10.3.3. Sea
- 10.1. Market Analysis, Insights and Forecast - by Type
- 11. North America Military Power Solutions Market Analysis, Insights and Forecast, 2019-2031
- 11.1. Market Analysis, Insights and Forecast - By Country/Sub-region
- 11.1.1 United States
- 11.1.2 Canada
- 12. Europe Military Power Solutions Market Analysis, Insights and Forecast, 2019-2031
- 12.1. Market Analysis, Insights and Forecast - By Country/Sub-region
- 12.1.1 United Kingdom
- 12.1.2 Germany
- 12.1.3 France
- 12.1.4 Russia
- 12.1.5 Rest of Europe
- 13. Asia Pacific Military Power Solutions Market Analysis, Insights and Forecast, 2019-2031
- 13.1. Market Analysis, Insights and Forecast - By Country/Sub-region
- 13.1.1 China
- 13.1.2 India
- 13.1.3 Japan
- 13.1.4 South Korea
- 13.1.5 Rest of Asia Pacific
- 14. Latin America Military Power Solutions Market Analysis, Insights and Forecast, 2019-2031
- 14.1. Market Analysis, Insights and Forecast - By Country/Sub-region
- 14.1.1 Brazil
- 14.1.2 Rest of Latin America
- 15. Middle East and Africa Military Power Solutions Market Analysis, Insights and Forecast, 2019-2031
- 15.1. Market Analysis, Insights and Forecast - By Country/Sub-region
- 15.1.1 United Arab Emirates
- 15.1.2 Saudi Arabia
- 15.1.3 Israel
- 15.1.4 Rest of Middle East and Africa
- 16. Competitive Analysis
- 16.1. Global Market Share Analysis 2024
- 16.2. Company Profiles
- 16.2.1 SFC Energy AG
- 16.2.1.1. Overview
- 16.2.1.2. Products
- 16.2.1.3. SWOT Analysis
- 16.2.1.4. Recent Developments
- 16.2.1.5. Financials (Based on Availability)
- 16.2.2 EnerSys
- 16.2.2.1. Overview
- 16.2.2.2. Products
- 16.2.2.3. SWOT Analysis
- 16.2.2.4. Recent Developments
- 16.2.2.5. Financials (Based on Availability)
- 16.2.3 Concorde Battery Corporation
- 16.2.3.1. Overview
- 16.2.3.2. Products
- 16.2.3.3. SWOT Analysis
- 16.2.3.4. Recent Developments
- 16.2.3.5. Financials (Based on Availability)
- 16.2.4 Saft Groupe SAS (TotalEnergies SE)
- 16.2.4.1. Overview
- 16.2.4.2. Products
- 16.2.4.3. SWOT Analysis
- 16.2.4.4. Recent Developments
- 16.2.4.5. Financials (Based on Availability)
- 16.2.5 Arotech Corporation
- 16.2.5.1. Overview
- 16.2.5.2. Products
- 16.2.5.3. SWOT Analysis
- 16.2.5.4. Recent Developments
- 16.2.5.5. Financials (Based on Availability)
- 16.2.6 RTX Corporation
- 16.2.6.1. Overview
- 16.2.6.2. Products
- 16.2.6.3. SWOT Analysis
- 16.2.6.4. Recent Developments
- 16.2.6.5. Financials (Based on Availability)
- 16.2.7 Denchi Group Ltd
- 16.2.7.1. Overview
- 16.2.7.2. Products
- 16.2.7.3. SWOT Analysis
- 16.2.7.4. Recent Developments
- 16.2.7.5. Financials (Based on Availability)
- 16.2.8 Eniquest
- 16.2.8.1. Overview
- 16.2.8.2. Products
- 16.2.8.3. SWOT Analysis
- 16.2.8.4. Recent Developments
- 16.2.8.5. Financials (Based on Availability)
- 16.2.9 HIMOINSA S
- 16.2.9.1. Overview
- 16.2.9.2. Products
- 16.2.9.3. SWOT Analysis
- 16.2.9.4. Recent Developments
- 16.2.9.5. Financials (Based on Availability)
- 16.2.10 Cummins Inc
- 16.2.10.1. Overview
- 16.2.10.2. Products
- 16.2.10.3. SWOT Analysis
- 16.2.10.4. Recent Developments
- 16.2.10.5. Financials (Based on Availability)
- 16.2.11 EaglePicher Technologies LLC
- 16.2.11.1. Overview
- 16.2.11.2. Products
- 16.2.11.3. SWOT Analysis
- 16.2.11.4. Recent Developments
- 16.2.11.5. Financials (Based on Availability)
- 16.2.1 SFC Energy AG
List of Figures
- Figure 1: Global Military Power Solutions Market Revenue Breakdown (Million, %) by Region 2024 & 2032
- Figure 2: North America Military Power Solutions Market Revenue (Million), by Country 2024 & 2032
- Figure 3: North America Military Power Solutions Market Revenue Share (%), by Country 2024 & 2032
- Figure 4: Europe Military Power Solutions Market Revenue (Million), by Country 2024 & 2032
- Figure 5: Europe Military Power Solutions Market Revenue Share (%), by Country 2024 & 2032
- Figure 6: Asia Pacific Military Power Solutions Market Revenue (Million), by Country 2024 & 2032
- Figure 7: Asia Pacific Military Power Solutions Market Revenue Share (%), by Country 2024 & 2032
- Figure 8: Latin America Military Power Solutions Market Revenue (Million), by Country 2024 & 2032
- Figure 9: Latin America Military Power Solutions Market Revenue Share (%), by Country 2024 & 2032
- Figure 10: Middle East and Africa Military Power Solutions Market Revenue (Million), by Country 2024 & 2032
- Figure 11: Middle East and Africa Military Power Solutions Market Revenue Share (%), by Country 2024 & 2032
- Figure 12: North America Military Power Solutions Market Revenue (Million), by Type 2024 & 2032
- Figure 13: North America Military Power Solutions Market Revenue Share (%), by Type 2024 & 2032
- Figure 14: North America Military Power Solutions Market Revenue (Million), by Source 2024 & 2032
- Figure 15: North America Military Power Solutions Market Revenue Share (%), by Source 2024 & 2032
- Figure 16: North America Military Power Solutions Market Revenue (Million), by Platform 2024 & 2032
- Figure 17: North America Military Power Solutions Market Revenue Share (%), by Platform 2024 & 2032
- Figure 18: North America Military Power Solutions Market Revenue (Million), by Country 2024 & 2032
- Figure 19: North America Military Power Solutions Market Revenue Share (%), by Country 2024 & 2032
- Figure 20: Europe Military Power Solutions Market Revenue (Million), by Type 2024 & 2032
- Figure 21: Europe Military Power Solutions Market Revenue Share (%), by Type 2024 & 2032
- Figure 22: Europe Military Power Solutions Market Revenue (Million), by Source 2024 & 2032
- Figure 23: Europe Military Power Solutions Market Revenue Share (%), by Source 2024 & 2032
- Figure 24: Europe Military Power Solutions Market Revenue (Million), by Platform 2024 & 2032
- Figure 25: Europe Military Power Solutions Market Revenue Share (%), by Platform 2024 & 2032
- Figure 26: Europe Military Power Solutions Market Revenue (Million), by Country 2024 & 2032
- Figure 27: Europe Military Power Solutions Market Revenue Share (%), by Country 2024 & 2032
- Figure 28: Asia Pacific Military Power Solutions Market Revenue (Million), by Type 2024 & 2032
- Figure 29: Asia Pacific Military Power Solutions Market Revenue Share (%), by Type 2024 & 2032
- Figure 30: Asia Pacific Military Power Solutions Market Revenue (Million), by Source 2024 & 2032
- Figure 31: Asia Pacific Military Power Solutions Market Revenue Share (%), by Source 2024 & 2032
- Figure 32: Asia Pacific Military Power Solutions Market Revenue (Million), by Platform 2024 & 2032
- Figure 33: Asia Pacific Military Power Solutions Market Revenue Share (%), by Platform 2024 & 2032
- Figure 34: Asia Pacific Military Power Solutions Market Revenue (Million), by Country 2024 & 2032
- Figure 35: Asia Pacific Military Power Solutions Market Revenue Share (%), by Country 2024 & 2032
- Figure 36: Latin America Military Power Solutions Market Revenue (Million), by Type 2024 & 2032
- Figure 37: Latin America Military Power Solutions Market Revenue Share (%), by Type 2024 & 2032
- Figure 38: Latin America Military Power Solutions Market Revenue (Million), by Source 2024 & 2032
- Figure 39: Latin America Military Power Solutions Market Revenue Share (%), by Source 2024 & 2032
- Figure 40: Latin America Military Power Solutions Market Revenue (Million), by Platform 2024 & 2032
- Figure 41: Latin America Military Power Solutions Market Revenue Share (%), by Platform 2024 & 2032
- Figure 42: Latin America Military Power Solutions Market Revenue (Million), by Country 2024 & 2032
- Figure 43: Latin America Military Power Solutions Market Revenue Share (%), by Country 2024 & 2032
- Figure 44: Middle East and Africa Military Power Solutions Market Revenue (Million), by Type 2024 & 2032
- Figure 45: Middle East and Africa Military Power Solutions Market Revenue Share (%), by Type 2024 & 2032
- Figure 46: Middle East and Africa Military Power Solutions Market Revenue (Million), by Source 2024 & 2032
- Figure 47: Middle East and Africa Military Power Solutions Market Revenue Share (%), by Source 2024 & 2032
- Figure 48: Middle East and Africa Military Power Solutions Market Revenue (Million), by Platform 2024 & 2032
- Figure 49: Middle East and Africa Military Power Solutions Market Revenue Share (%), by Platform 2024 & 2032
- Figure 50: Middle East and Africa Military Power Solutions Market Revenue (Million), by Country 2024 & 2032
- Figure 51: Middle East and Africa Military Power Solutions Market Revenue Share (%), by Country 2024 & 2032
List of Tables
- Table 1: Global Military Power Solutions Market Revenue Million Forecast, by Region 2019 & 2032
- Table 2: Global Military Power Solutions Market Revenue Million Forecast, by Type 2019 & 2032
- Table 3: Global Military Power Solutions Market Revenue Million Forecast, by Source 2019 & 2032
- Table 4: Global Military Power Solutions Market Revenue Million Forecast, by Platform 2019 & 2032
- Table 5: Global Military Power Solutions Market Revenue Million Forecast, by Region 2019 & 2032
- Table 6: Global Military Power Solutions Market Revenue Million Forecast, by Country 2019 & 2032
- Table 7: United States Military Power Solutions Market Revenue (Million) Forecast, by Application 2019 & 2032
- Table 8: Canada Military Power Solutions Market Revenue (Million) Forecast, by Application 2019 & 2032
- Table 9: Global Military Power Solutions Market Revenue Million Forecast, by Country 2019 & 2032
- Table 10: United Kingdom Military Power Solutions Market Revenue (Million) Forecast, by Application 2019 & 2032
- Table 11: Germany Military Power Solutions Market Revenue (Million) Forecast, by Application 2019 & 2032
- Table 12: France Military Power Solutions Market Revenue (Million) Forecast, by Application 2019 & 2032
- Table 13: Russia Military Power Solutions Market Revenue (Million) Forecast, by Application 2019 & 2032
- Table 14: Rest of Europe Military Power Solutions Market Revenue (Million) Forecast, by Application 2019 & 2032
- Table 15: Global Military Power Solutions Market Revenue Million Forecast, by Country 2019 & 2032
- Table 16: China Military Power Solutions Market Revenue (Million) Forecast, by Application 2019 & 2032
- Table 17: India Military Power Solutions Market Revenue (Million) Forecast, by Application 2019 & 2032
- Table 18: Japan Military Power Solutions Market Revenue (Million) Forecast, by Application 2019 & 2032
- Table 19: South Korea Military Power Solutions Market Revenue (Million) Forecast, by Application 2019 & 2032
- Table 20: Rest of Asia Pacific Military Power Solutions Market Revenue (Million) Forecast, by Application 2019 & 2032
- Table 21: Global Military Power Solutions Market Revenue Million Forecast, by Country 2019 & 2032
- Table 22: Brazil Military Power Solutions Market Revenue (Million) Forecast, by Application 2019 & 2032
- Table 23: Rest of Latin America Military Power Solutions Market Revenue (Million) Forecast, by Application 2019 & 2032
- Table 24: Global Military Power Solutions Market Revenue Million Forecast, by Country 2019 & 2032
- Table 25: United Arab Emirates Military Power Solutions Market Revenue (Million) Forecast, by Application 2019 & 2032
- Table 26: Saudi Arabia Military Power Solutions Market Revenue (Million) Forecast, by Application 2019 & 2032
- Table 27: Israel Military Power Solutions Market Revenue (Million) Forecast, by Application 2019 & 2032
- Table 28: Rest of Middle East and Africa Military Power Solutions Market Revenue (Million) Forecast, by Application 2019 & 2032
- Table 29: Global Military Power Solutions Market Revenue Million Forecast, by Type 2019 & 2032
- Table 30: Global Military Power Solutions Market Revenue Million Forecast, by Source 2019 & 2032
- Table 31: Global Military Power Solutions Market Revenue Million Forecast, by Platform 2019 & 2032
- Table 32: Global Military Power Solutions Market Revenue Million Forecast, by Country 2019 & 2032
- Table 33: United States Military Power Solutions Market Revenue (Million) Forecast, by Application 2019 & 2032
- Table 34: Canada Military Power Solutions Market Revenue (Million) Forecast, by Application 2019 & 2032
- Table 35: Global Military Power Solutions Market Revenue Million Forecast, by Type 2019 & 2032
- Table 36: Global Military Power Solutions Market Revenue Million Forecast, by Source 2019 & 2032
- Table 37: Global Military Power Solutions Market Revenue Million Forecast, by Platform 2019 & 2032
- Table 38: Global Military Power Solutions Market Revenue Million Forecast, by Country 2019 & 2032
- Table 39: United Kingdom Military Power Solutions Market Revenue (Million) Forecast, by Application 2019 & 2032
- Table 40: Germany Military Power Solutions Market Revenue (Million) Forecast, by Application 2019 & 2032
- Table 41: France Military Power Solutions Market Revenue (Million) Forecast, by Application 2019 & 2032
- Table 42: Russia Military Power Solutions Market Revenue (Million) Forecast, by Application 2019 & 2032
- Table 43: Rest of Europe Military Power Solutions Market Revenue (Million) Forecast, by Application 2019 & 2032
- Table 44: Global Military Power Solutions Market Revenue Million Forecast, by Type 2019 & 2032
- Table 45: Global Military Power Solutions Market Revenue Million Forecast, by Source 2019 & 2032
- Table 46: Global Military Power Solutions Market Revenue Million Forecast, by Platform 2019 & 2032
- Table 47: Global Military Power Solutions Market Revenue Million Forecast, by Country 2019 & 2032
- Table 48: China Military Power Solutions Market Revenue (Million) Forecast, by Application 2019 & 2032
- Table 49: India Military Power Solutions Market Revenue (Million) Forecast, by Application 2019 & 2032
- Table 50: Japan Military Power Solutions Market Revenue (Million) Forecast, by Application 2019 & 2032
- Table 51: South Korea Military Power Solutions Market Revenue (Million) Forecast, by Application 2019 & 2032
- Table 52: Rest of Asia Pacific Military Power Solutions Market Revenue (Million) Forecast, by Application 2019 & 2032
- Table 53: Global Military Power Solutions Market Revenue Million Forecast, by Type 2019 & 2032
- Table 54: Global Military Power Solutions Market Revenue Million Forecast, by Source 2019 & 2032
- Table 55: Global Military Power Solutions Market Revenue Million Forecast, by Platform 2019 & 2032
- Table 56: Global Military Power Solutions Market Revenue Million Forecast, by Country 2019 & 2032
- Table 57: Brazil Military Power Solutions Market Revenue (Million) Forecast, by Application 2019 & 2032
- Table 58: Rest of Latin America Military Power Solutions Market Revenue (Million) Forecast, by Application 2019 & 2032
- Table 59: Global Military Power Solutions Market Revenue Million Forecast, by Type 2019 & 2032
- Table 60: Global Military Power Solutions Market Revenue Million Forecast, by Source 2019 & 2032
- Table 61: Global Military Power Solutions Market Revenue Million Forecast, by Platform 2019 & 2032
- Table 62: Global Military Power Solutions Market Revenue Million Forecast, by Country 2019 & 2032
- Table 63: United Arab Emirates Military Power Solutions Market Revenue (Million) Forecast, by Application 2019 & 2032
- Table 64: Saudi Arabia Military Power Solutions Market Revenue (Million) Forecast, by Application 2019 & 2032
- Table 65: Israel Military Power Solutions Market Revenue (Million) Forecast, by Application 2019 & 2032
- Table 66: Rest of Middle East and Africa Military Power Solutions Market Revenue (Million) Forecast, by Application 2019 & 2032
Frequently Asked Questions
1. What is the projected Compound Annual Growth Rate (CAGR) of the Military Power Solutions Market?
The projected CAGR is approximately 7.75%.
2. Which companies are prominent players in the Military Power Solutions Market?
Key companies in the market include SFC Energy AG, EnerSys, Concorde Battery Corporation, Saft Groupe SAS (TotalEnergies SE), Arotech Corporation, RTX Corporation, Denchi Group Ltd, Eniquest, HIMOINSA S, Cummins Inc, EaglePicher Technologies LLC.
3. What are the main segments of the Military Power Solutions Market?
The market segments include Type, Source, Platform.
4. Can you provide details about the market size?
The market size is estimated to be USD 7.77 Million as of 2022.
5. What are some drivers contributing to market growth?
N/A
6. What are the notable trends driving market growth?
Generators Segment to Continue Market Share Domination.
7. Are there any restraints impacting market growth?
N/A
8. Can you provide examples of recent developments in the market?
August 2023: Collins Aerospace, a part of RTX Corporation, was awarded a USD 24 million contract for producing and delivering electric generators with containers to the USArmy Anniston Depot to support its Abrams M1A2 Main Battle Tank.
9. What pricing options are available for accessing the report?
Pricing options include single-user, multi-user, and enterprise licenses priced at USD 4750, USD 5250, and USD 8750 respectively.
10. Is the market size provided in terms of value or volume?
The market size is provided in terms of value, measured in Million.
11. Are there any specific market keywords associated with the report?
Yes, the market keyword associated with the report is "Military Power Solutions Market," which aids in identifying and referencing the specific market segment covered.
12. How do I determine which pricing option suits my needs best?
The pricing options vary based on user requirements and access needs. Individual users may opt for single-user licenses, while businesses requiring broader access may choose multi-user or enterprise licenses for cost-effective access to the report.
13. Are there any additional resources or data provided in the Military Power Solutions Market report?
While the report offers comprehensive insights, it's advisable to review the specific contents or supplementary materials provided to ascertain if additional resources or data are available.
14. How can I stay updated on further developments or reports in the Military Power Solutions Market?
To stay informed about further developments, trends, and reports in the Military Power Solutions Market, consider subscribing to industry newsletters, following relevant companies and organizations, or regularly checking reputable industry news sources and publications.
Methodology
Step 1 - Identification of Relevant Samples Size from Population Database


Step 2 - Approaches for Defining Global Market Size (Value, Volume* & Price*)

Note*: In applicable scenarios
Step 3 - Data Sources
Primary Research
- Web Analytics
- Survey Reports
- Research Institute
- Latest Research Reports
- Opinion Leaders
Secondary Research
- Annual Reports
- White Paper
- Latest Press Release
- Industry Association
- Paid Database
- Investor Presentations

Step 4 - Data Triangulation
Involves using different sources of information in order to increase the validity of a study
These sources are likely to be stakeholders in a program - participants, other researchers, program staff, other community members, and so on.
Then we put all data in single framework & apply various statistical tools to find out the dynamic on the market.
During the analysis stage, feedback from the stakeholder groups would be compared to determine areas of agreement as well as areas of divergence


