
Key Insights
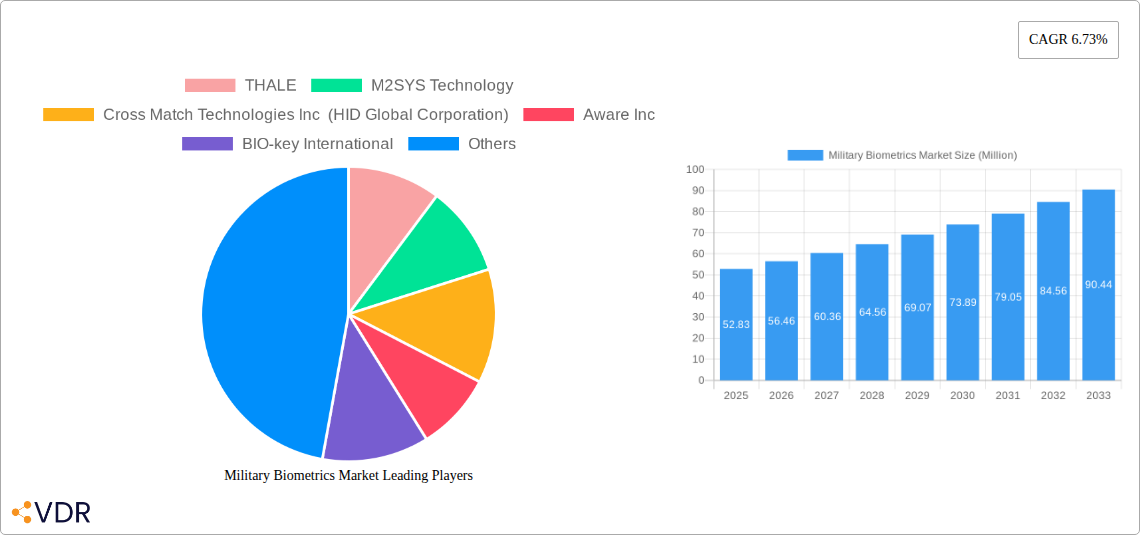
The Military Biometrics Market, valued at $52.83 million in 2025, is projected to experience robust growth, driven by increasing demand for enhanced security and improved identification systems within military operations. A Compound Annual Growth Rate (CAGR) of 6.73% from 2025 to 2033 indicates a significant market expansion. Key drivers include the rising need for accurate and rapid soldier identification in complex battlefield environments, the integration of biometrics into advanced military technologies like unmanned aerial vehicles (UAVs) and border security systems, and a growing focus on combating terrorism and unauthorized access to sensitive military installations. The market is segmented by recognition type, with fingerprint, facial, and iris recognition technologies dominating, reflecting advancements in accuracy, speed, and reliability. While data privacy and security concerns present a restraint, the overall trend is towards wider adoption, fueled by government investments in advanced defense systems and the increasing adoption of biometrics in civilian applications which leads to technology advancements that benefit military applications. Leading companies such as Thales, HID Global, and NEC Corporation are actively shaping market dynamics through continuous innovation and strategic partnerships. Geographically, North America and Europe are expected to hold significant market share initially, while the Asia-Pacific region is poised for rapid growth driven by increasing military spending and technological advancements. This growth trajectory is further supported by ongoing research and development in more secure and sophisticated biometric technologies, such as multi-modal biometric systems that combine multiple recognition methods for increased accuracy.
The forecast period of 2025-2033 presents substantial opportunities for market players. The increasing integration of Artificial Intelligence (AI) and machine learning into biometric systems will enhance their capabilities, further accelerating market growth. The development of more robust and tamper-proof biometric solutions is likely to address concerns about security vulnerabilities. Furthermore, the growing focus on border security and immigration control globally will significantly influence the demand for military-grade biometric systems. Competition among established and emerging players is expected to intensify, resulting in innovation and potentially more competitive pricing, making the technology accessible to a wider range of military organizations globally.
Military Biometrics Market: A Comprehensive Market Report (2019-2033)
This in-depth report provides a comprehensive analysis of the Military Biometrics Market, encompassing market dynamics, growth trends, regional dominance, product landscape, key players, and future outlook. The report covers the period from 2019 to 2033, with 2025 serving as the base and estimated year. The market is segmented by recognition type (fingerprint, facial, iris, and others) and analyzed across various regions and countries. This report is an essential resource for industry professionals, investors, and anyone seeking a detailed understanding of this rapidly evolving sector. The total market size is projected to reach xx Million by 2033.
Military Biometrics Market Market Dynamics & Structure
The Military Biometrics Market is characterized by a moderately concentrated structure, with several major players holding significant market share. However, the market is dynamic, driven by technological advancements, stringent regulatory frameworks, and the constant need for improved security solutions. The market is also witnessing a rise in mergers and acquisitions (M&A) activity as companies seek to expand their capabilities and market reach. The increasing adoption of biometrics in military operations is a key driver, alongside the development of more sophisticated and accurate biometric technologies.
- Market Concentration: Moderate, with top 5 players holding approximately xx% market share in 2024.
- Technological Innovation: Continuous advancements in algorithms, sensor technology, and data processing capabilities are fueling market growth. Innovation barriers include high R&D costs and the need for robust data security measures.
- Regulatory Framework: Stringent regulations concerning data privacy and security significantly influence market dynamics. Compliance costs and stringent certifications represent substantial barriers to entry for some players.
- Competitive Product Substitutes: Traditional identification methods, like ID cards, pose a competitive threat, particularly in less technologically advanced regions.
- End-User Demographics: The primary end-users are defense forces across various countries, with demand heavily influenced by geopolitical factors and national security priorities.
- M&A Trends: An increasing number of M&A activities are witnessed (xx deals in 2024) among key players seeking to expand their product portfolios and geographic presence.
Military Biometrics Market Growth Trends & Insights
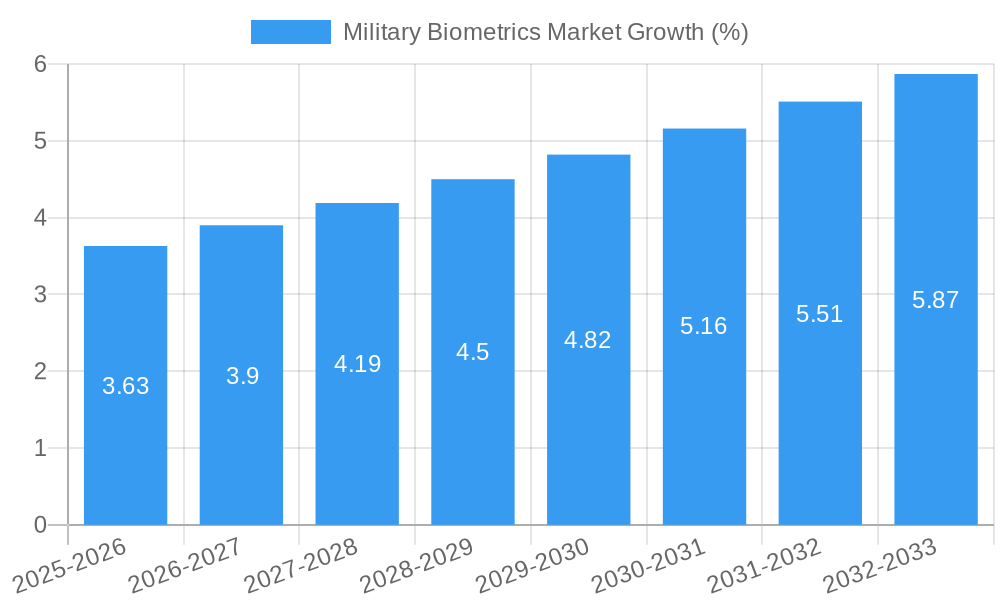
The Military Biometrics Market has experienced significant growth throughout the historical period (2019-2024). This growth is expected to continue during the forecast period (2025-2033), driven by factors such as increased defense budgets, growing concerns over national security, and the adoption of advanced biometric technologies by military organizations. The market size is projected to expand at a CAGR of xx% from 2025 to 2033, reaching a value of xx Million by 2033. Technological disruptions, such as the introduction of AI-powered biometric systems, are accelerating adoption rates and transforming consumer behavior within the military and defense sectors. Market penetration is anticipated to increase from xx% in 2025 to xx% by 2033.
Dominant Regions, Countries, or Segments in Military Biometrics Market
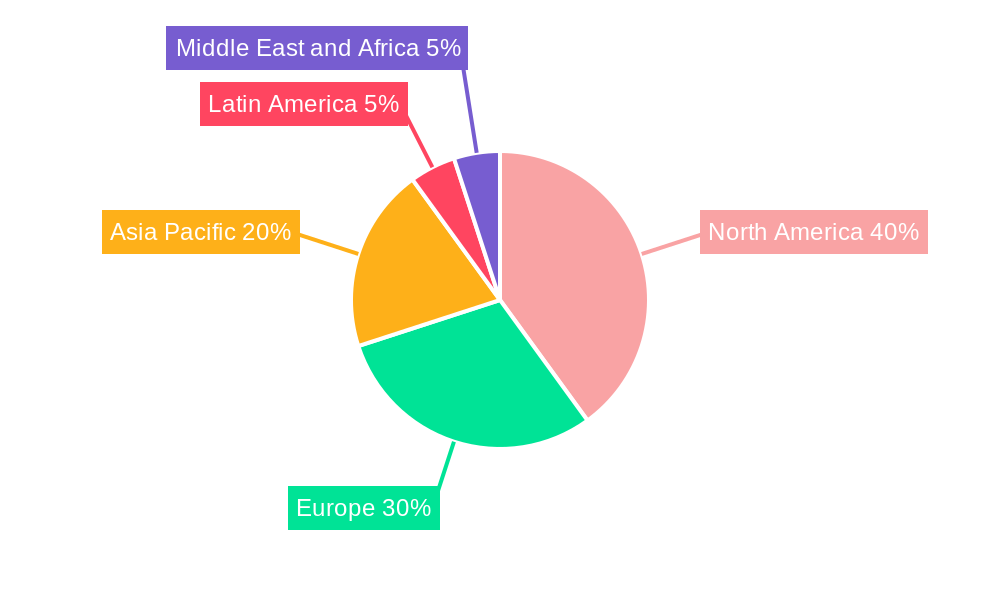
The North American region currently dominates the Military Biometrics Market, driven by substantial defense spending and technological advancements. Within this region, the United States holds the largest market share due to its significant investment in defense technologies and its strategic focus on counter-terrorism initiatives. Among the recognition types, Facial Recognition is the leading segment, followed closely by Fingerprint Recognition.
- Key Drivers in North America: High defense budgets, advanced technological infrastructure, and proactive national security strategies.
- Dominance Factors: High adoption rates, extensive R&D investments, and strong government support for biometric technologies.
- Growth Potential: Continued growth is expected, primarily driven by ongoing technological advancements and increasing demand for enhanced security solutions. Europe and Asia-Pacific are expected to witness significant growth in the coming years.
Military Biometrics Market Product Landscape
The Military Biometrics Market offers a wide range of products, including portable biometric devices for field operations, integrated systems for border security, and advanced analytics platforms for large-scale data management. These products are characterized by robust design, high accuracy, and seamless integration with existing military infrastructure. Key advancements include the development of more resilient sensors capable of operating in challenging environments and sophisticated algorithms that minimize error rates. Unique selling propositions often include superior performance in extreme conditions, enhanced security features, and streamlined data management capabilities.
Key Drivers, Barriers & Challenges in Military Biometrics Market
Key Drivers: Increasing defense budgets globally, rising security concerns related to terrorism and cyber threats, demand for improved border security, and technological advancements in biometric recognition technologies.
Challenges: High initial investment costs, concerns over data privacy and security breaches, the potential for algorithmic bias, and the need for interoperability among different biometric systems. Supply chain disruptions (estimated to impact market growth by xx% in 2026) and regulatory hurdles in specific regions further constrain market expansion.
Emerging Opportunities in Military Biometrics Market
Emerging opportunities lie in the integration of biometrics with other technologies, such as AI and IoT, to create more intelligent and adaptive security systems. Expansion into untapped markets, particularly in developing countries with growing defense budgets, presents significant potential. Furthermore, the development of more user-friendly and less intrusive biometric technologies could further boost market adoption.
Growth Accelerators in the Military Biometrics Market Industry
Technological breakthroughs, such as the development of more accurate and efficient algorithms, along with the rise of AI-powered biometric systems, are key growth accelerators. Strategic partnerships between technology providers and defense agencies will further drive market expansion. Furthermore, the implementation of effective cybersecurity measures to address data privacy concerns will enhance market confidence and drive adoption.
Key Players Shaping the Military Biometrics Market Market
- THALES
- M2SYS Technology
- Cross Match Technologies Inc (HID Global Corporation)
- Aware Inc
- BIO-key International
- Fulcrum Biometrics
- ZKTECO CO LTD
- HID Global Corporation
- NEC Corporation
- Leidos Holdings Inc
- Corvus Integration Inc
- IDEMIA
Notable Milestones in Military Biometrics Market Sector
- December 2022: PEO IEW&S announced the development of Biometrically Enabled Watch List Dissemination Management Functionality (BDMF), significantly accelerating biometric data transfer within the DOD ABIS.
- October 2022: The US Army unveiled a new Army Biometric Program Directive, emphasizing the use of biometric capabilities for real-time adversary identification and neutral identity verification.
In-Depth Military Biometrics Market Market Outlook
The Military Biometrics Market is poised for significant growth in the coming years, driven by continuous technological advancements, increasing defense spending, and the growing need for robust security solutions. Strategic partnerships, focused R&D initiatives, and expansion into new geographical markets will further contribute to market expansion. The potential for integrating biometrics with other emerging technologies presents significant opportunities for innovation and market leadership.
Military Biometrics Market Segmentation
-
1. Recognition Type
- 1.1. Fingerprint Recognition
- 1.2. Facial Recognition
- 1.3. Iris Recognition
-
1.4. Other Recognition Types
- 1.4.1. DNA Recognition
- 1.4.2. Finger Geometry Recognition
- 1.4.3. Keystroke Recognition
- 1.4.4. Signature Recognition
Military Biometrics Market Segmentation By Geography
-
1. North America
- 1.1. United States
- 1.2. Canada
-
2. Europe
- 2.1. United Kingdom
- 2.2. Germany
- 2.3. France
- 2.4. Italy
- 2.5. Rest of Europe
-
3. Asia Pacific
- 3.1. China
- 3.2. Japan
- 3.3. India
- 3.4. South Korea
- 3.5. Rest of Asia Pacific
-
4. Latin America
- 4.1. Brazil
- 4.2. Mexico
- 4.3. Rest of Latin America
-
5. Middle East and Africa
- 5.1. Saudi Arabia
- 5.2. United Arab Emirates
- 5.3. Qatar
- 5.4. Rest of Middle East and Africa
Military Biometrics Market REPORT HIGHLIGHTS
| Aspects | Details |
|---|---|
| Study Period | 2019-2033 |
| Base Year | 2024 |
| Estimated Year | 2025 |
| Forecast Period | 2025-2033 |
| Historical Period | 2019-2024 |
| Growth Rate | CAGR of 6.73% from 2019-2033 |
| Segmentation |
|
Table of Contents
- 1. Introduction
- 1.1. Research Scope
- 1.2. Market Segmentation
- 1.3. Research Methodology
- 1.4. Definitions and Assumptions
- 2. Executive Summary
- 2.1. Introduction
- 3. Market Dynamics
- 3.1. Introduction
- 3.2. Market Drivers
- 3.3. Market Restrains
- 3.4. Market Trends
- 3.4.1. Fingerprint Recognition Segment Witness Highest Growth During the Forecast Period
- 4. Market Factor Analysis
- 4.1. Porters Five Forces
- 4.2. Supply/Value Chain
- 4.3. PESTEL analysis
- 4.4. Market Entropy
- 4.5. Patent/Trademark Analysis
- 5. Global Military Biometrics Market Analysis, Insights and Forecast, 2019-2031
- 5.1. Market Analysis, Insights and Forecast - by Recognition Type
- 5.1.1. Fingerprint Recognition
- 5.1.2. Facial Recognition
- 5.1.3. Iris Recognition
- 5.1.4. Other Recognition Types
- 5.1.4.1. DNA Recognition
- 5.1.4.2. Finger Geometry Recognition
- 5.1.4.3. Keystroke Recognition
- 5.1.4.4. Signature Recognition
- 5.2. Market Analysis, Insights and Forecast - by Region
- 5.2.1. North America
- 5.2.2. Europe
- 5.2.3. Asia Pacific
- 5.2.4. Latin America
- 5.2.5. Middle East and Africa
- 5.1. Market Analysis, Insights and Forecast - by Recognition Type
- 6. North America Military Biometrics Market Analysis, Insights and Forecast, 2019-2031
- 6.1. Market Analysis, Insights and Forecast - by Recognition Type
- 6.1.1. Fingerprint Recognition
- 6.1.2. Facial Recognition
- 6.1.3. Iris Recognition
- 6.1.4. Other Recognition Types
- 6.1.4.1. DNA Recognition
- 6.1.4.2. Finger Geometry Recognition
- 6.1.4.3. Keystroke Recognition
- 6.1.4.4. Signature Recognition
- 6.1. Market Analysis, Insights and Forecast - by Recognition Type
- 7. Europe Military Biometrics Market Analysis, Insights and Forecast, 2019-2031
- 7.1. Market Analysis, Insights and Forecast - by Recognition Type
- 7.1.1. Fingerprint Recognition
- 7.1.2. Facial Recognition
- 7.1.3. Iris Recognition
- 7.1.4. Other Recognition Types
- 7.1.4.1. DNA Recognition
- 7.1.4.2. Finger Geometry Recognition
- 7.1.4.3. Keystroke Recognition
- 7.1.4.4. Signature Recognition
- 7.1. Market Analysis, Insights and Forecast - by Recognition Type
- 8. Asia Pacific Military Biometrics Market Analysis, Insights and Forecast, 2019-2031
- 8.1. Market Analysis, Insights and Forecast - by Recognition Type
- 8.1.1. Fingerprint Recognition
- 8.1.2. Facial Recognition
- 8.1.3. Iris Recognition
- 8.1.4. Other Recognition Types
- 8.1.4.1. DNA Recognition
- 8.1.4.2. Finger Geometry Recognition
- 8.1.4.3. Keystroke Recognition
- 8.1.4.4. Signature Recognition
- 8.1. Market Analysis, Insights and Forecast - by Recognition Type
- 9. Latin America Military Biometrics Market Analysis, Insights and Forecast, 2019-2031
- 9.1. Market Analysis, Insights and Forecast - by Recognition Type
- 9.1.1. Fingerprint Recognition
- 9.1.2. Facial Recognition
- 9.1.3. Iris Recognition
- 9.1.4. Other Recognition Types
- 9.1.4.1. DNA Recognition
- 9.1.4.2. Finger Geometry Recognition
- 9.1.4.3. Keystroke Recognition
- 9.1.4.4. Signature Recognition
- 9.1. Market Analysis, Insights and Forecast - by Recognition Type
- 10. Middle East and Africa Military Biometrics Market Analysis, Insights and Forecast, 2019-2031
- 10.1. Market Analysis, Insights and Forecast - by Recognition Type
- 10.1.1. Fingerprint Recognition
- 10.1.2. Facial Recognition
- 10.1.3. Iris Recognition
- 10.1.4. Other Recognition Types
- 10.1.4.1. DNA Recognition
- 10.1.4.2. Finger Geometry Recognition
- 10.1.4.3. Keystroke Recognition
- 10.1.4.4. Signature Recognition
- 10.1. Market Analysis, Insights and Forecast - by Recognition Type
- 11. North America Military Biometrics Market Analysis, Insights and Forecast, 2019-2031
- 11.1. Market Analysis, Insights and Forecast - By Country/Sub-region
- 11.1.1 United States
- 11.1.2 Canada
- 12. Europe Military Biometrics Market Analysis, Insights and Forecast, 2019-2031
- 12.1. Market Analysis, Insights and Forecast - By Country/Sub-region
- 12.1.1 United Kingdom
- 12.1.2 Germany
- 12.1.3 France
- 12.1.4 Russia
- 12.1.5 Rest of Europe
- 13. Asia Pacific Military Biometrics Market Analysis, Insights and Forecast, 2019-2031
- 13.1. Market Analysis, Insights and Forecast - By Country/Sub-region
- 13.1.1 China
- 13.1.2 Japan
- 13.1.3 India
- 13.1.4 South Korea
- 13.1.5 Rest of Asia Pacific
- 14. Latin America Military Biometrics Market Analysis, Insights and Forecast, 2019-2031
- 14.1. Market Analysis, Insights and Forecast - By Country/Sub-region
- 14.1.1 Brazil
- 14.1.2 Mexico
- 14.1.3 Rest of Latin America
- 15. Middle East and Africa Military Biometrics Market Analysis, Insights and Forecast, 2019-2031
- 15.1. Market Analysis, Insights and Forecast - By Country/Sub-region
- 15.1.1 United Arab Emirates
- 15.1.2 Saudi Arabia
- 15.1.3 Qatar
- 15.1.4 Rest of Middle East and Africa
- 16. Competitive Analysis
- 16.1. Global Market Share Analysis 2024
- 16.2. Company Profiles
- 16.2.1 THALE
- 16.2.1.1. Overview
- 16.2.1.2. Products
- 16.2.1.3. SWOT Analysis
- 16.2.1.4. Recent Developments
- 16.2.1.5. Financials (Based on Availability)
- 16.2.2 M2SYS Technology
- 16.2.2.1. Overview
- 16.2.2.2. Products
- 16.2.2.3. SWOT Analysis
- 16.2.2.4. Recent Developments
- 16.2.2.5. Financials (Based on Availability)
- 16.2.3 Cross Match Technologies Inc (HID Global Corporation)
- 16.2.3.1. Overview
- 16.2.3.2. Products
- 16.2.3.3. SWOT Analysis
- 16.2.3.4. Recent Developments
- 16.2.3.5. Financials (Based on Availability)
- 16.2.4 Aware Inc
- 16.2.4.1. Overview
- 16.2.4.2. Products
- 16.2.4.3. SWOT Analysis
- 16.2.4.4. Recent Developments
- 16.2.4.5. Financials (Based on Availability)
- 16.2.5 BIO-key International
- 16.2.5.1. Overview
- 16.2.5.2. Products
- 16.2.5.3. SWOT Analysis
- 16.2.5.4. Recent Developments
- 16.2.5.5. Financials (Based on Availability)
- 16.2.6 Fulcrum Biometrics
- 16.2.6.1. Overview
- 16.2.6.2. Products
- 16.2.6.3. SWOT Analysis
- 16.2.6.4. Recent Developments
- 16.2.6.5. Financials (Based on Availability)
- 16.2.7 ZKTECO CO LTD
- 16.2.7.1. Overview
- 16.2.7.2. Products
- 16.2.7.3. SWOT Analysis
- 16.2.7.4. Recent Developments
- 16.2.7.5. Financials (Based on Availability)
- 16.2.8 HID Global Corporation
- 16.2.8.1. Overview
- 16.2.8.2. Products
- 16.2.8.3. SWOT Analysis
- 16.2.8.4. Recent Developments
- 16.2.8.5. Financials (Based on Availability)
- 16.2.9 NEC Corporation
- 16.2.9.1. Overview
- 16.2.9.2. Products
- 16.2.9.3. SWOT Analysis
- 16.2.9.4. Recent Developments
- 16.2.9.5. Financials (Based on Availability)
- 16.2.10 Leidos Holdings Inc
- 16.2.10.1. Overview
- 16.2.10.2. Products
- 16.2.10.3. SWOT Analysis
- 16.2.10.4. Recent Developments
- 16.2.10.5. Financials (Based on Availability)
- 16.2.11 Corvus Integration Inc
- 16.2.11.1. Overview
- 16.2.11.2. Products
- 16.2.11.3. SWOT Analysis
- 16.2.11.4. Recent Developments
- 16.2.11.5. Financials (Based on Availability)
- 16.2.12 IDEMIA
- 16.2.12.1. Overview
- 16.2.12.2. Products
- 16.2.12.3. SWOT Analysis
- 16.2.12.4. Recent Developments
- 16.2.12.5. Financials (Based on Availability)
- 16.2.1 THALE
List of Figures
- Figure 1: Global Military Biometrics Market Revenue Breakdown (Million, %) by Region 2024 & 2032
- Figure 2: North America Military Biometrics Market Revenue (Million), by Country 2024 & 2032
- Figure 3: North America Military Biometrics Market Revenue Share (%), by Country 2024 & 2032
- Figure 4: Europe Military Biometrics Market Revenue (Million), by Country 2024 & 2032
- Figure 5: Europe Military Biometrics Market Revenue Share (%), by Country 2024 & 2032
- Figure 6: Asia Pacific Military Biometrics Market Revenue (Million), by Country 2024 & 2032
- Figure 7: Asia Pacific Military Biometrics Market Revenue Share (%), by Country 2024 & 2032
- Figure 8: Latin America Military Biometrics Market Revenue (Million), by Country 2024 & 2032
- Figure 9: Latin America Military Biometrics Market Revenue Share (%), by Country 2024 & 2032
- Figure 10: Middle East and Africa Military Biometrics Market Revenue (Million), by Country 2024 & 2032
- Figure 11: Middle East and Africa Military Biometrics Market Revenue Share (%), by Country 2024 & 2032
- Figure 12: North America Military Biometrics Market Revenue (Million), by Recognition Type 2024 & 2032
- Figure 13: North America Military Biometrics Market Revenue Share (%), by Recognition Type 2024 & 2032
- Figure 14: North America Military Biometrics Market Revenue (Million), by Country 2024 & 2032
- Figure 15: North America Military Biometrics Market Revenue Share (%), by Country 2024 & 2032
- Figure 16: Europe Military Biometrics Market Revenue (Million), by Recognition Type 2024 & 2032
- Figure 17: Europe Military Biometrics Market Revenue Share (%), by Recognition Type 2024 & 2032
- Figure 18: Europe Military Biometrics Market Revenue (Million), by Country 2024 & 2032
- Figure 19: Europe Military Biometrics Market Revenue Share (%), by Country 2024 & 2032
- Figure 20: Asia Pacific Military Biometrics Market Revenue (Million), by Recognition Type 2024 & 2032
- Figure 21: Asia Pacific Military Biometrics Market Revenue Share (%), by Recognition Type 2024 & 2032
- Figure 22: Asia Pacific Military Biometrics Market Revenue (Million), by Country 2024 & 2032
- Figure 23: Asia Pacific Military Biometrics Market Revenue Share (%), by Country 2024 & 2032
- Figure 24: Latin America Military Biometrics Market Revenue (Million), by Recognition Type 2024 & 2032
- Figure 25: Latin America Military Biometrics Market Revenue Share (%), by Recognition Type 2024 & 2032
- Figure 26: Latin America Military Biometrics Market Revenue (Million), by Country 2024 & 2032
- Figure 27: Latin America Military Biometrics Market Revenue Share (%), by Country 2024 & 2032
- Figure 28: Middle East and Africa Military Biometrics Market Revenue (Million), by Recognition Type 2024 & 2032
- Figure 29: Middle East and Africa Military Biometrics Market Revenue Share (%), by Recognition Type 2024 & 2032
- Figure 30: Middle East and Africa Military Biometrics Market Revenue (Million), by Country 2024 & 2032
- Figure 31: Middle East and Africa Military Biometrics Market Revenue Share (%), by Country 2024 & 2032
List of Tables
- Table 1: Global Military Biometrics Market Revenue Million Forecast, by Region 2019 & 2032
- Table 2: Global Military Biometrics Market Revenue Million Forecast, by Recognition Type 2019 & 2032
- Table 3: Global Military Biometrics Market Revenue Million Forecast, by Region 2019 & 2032
- Table 4: Global Military Biometrics Market Revenue Million Forecast, by Country 2019 & 2032
- Table 5: United States Military Biometrics Market Revenue (Million) Forecast, by Application 2019 & 2032
- Table 6: Canada Military Biometrics Market Revenue (Million) Forecast, by Application 2019 & 2032
- Table 7: Global Military Biometrics Market Revenue Million Forecast, by Country 2019 & 2032
- Table 8: United Kingdom Military Biometrics Market Revenue (Million) Forecast, by Application 2019 & 2032
- Table 9: Germany Military Biometrics Market Revenue (Million) Forecast, by Application 2019 & 2032
- Table 10: France Military Biometrics Market Revenue (Million) Forecast, by Application 2019 & 2032
- Table 11: Russia Military Biometrics Market Revenue (Million) Forecast, by Application 2019 & 2032
- Table 12: Rest of Europe Military Biometrics Market Revenue (Million) Forecast, by Application 2019 & 2032
- Table 13: Global Military Biometrics Market Revenue Million Forecast, by Country 2019 & 2032
- Table 14: China Military Biometrics Market Revenue (Million) Forecast, by Application 2019 & 2032
- Table 15: Japan Military Biometrics Market Revenue (Million) Forecast, by Application 2019 & 2032
- Table 16: India Military Biometrics Market Revenue (Million) Forecast, by Application 2019 & 2032
- Table 17: South Korea Military Biometrics Market Revenue (Million) Forecast, by Application 2019 & 2032
- Table 18: Rest of Asia Pacific Military Biometrics Market Revenue (Million) Forecast, by Application 2019 & 2032
- Table 19: Global Military Biometrics Market Revenue Million Forecast, by Country 2019 & 2032
- Table 20: Brazil Military Biometrics Market Revenue (Million) Forecast, by Application 2019 & 2032
- Table 21: Mexico Military Biometrics Market Revenue (Million) Forecast, by Application 2019 & 2032
- Table 22: Rest of Latin America Military Biometrics Market Revenue (Million) Forecast, by Application 2019 & 2032
- Table 23: Global Military Biometrics Market Revenue Million Forecast, by Country 2019 & 2032
- Table 24: United Arab Emirates Military Biometrics Market Revenue (Million) Forecast, by Application 2019 & 2032
- Table 25: Saudi Arabia Military Biometrics Market Revenue (Million) Forecast, by Application 2019 & 2032
- Table 26: Qatar Military Biometrics Market Revenue (Million) Forecast, by Application 2019 & 2032
- Table 27: Rest of Middle East and Africa Military Biometrics Market Revenue (Million) Forecast, by Application 2019 & 2032
- Table 28: Global Military Biometrics Market Revenue Million Forecast, by Recognition Type 2019 & 2032
- Table 29: Global Military Biometrics Market Revenue Million Forecast, by Country 2019 & 2032
- Table 30: United States Military Biometrics Market Revenue (Million) Forecast, by Application 2019 & 2032
- Table 31: Canada Military Biometrics Market Revenue (Million) Forecast, by Application 2019 & 2032
- Table 32: Global Military Biometrics Market Revenue Million Forecast, by Recognition Type 2019 & 2032
- Table 33: Global Military Biometrics Market Revenue Million Forecast, by Country 2019 & 2032
- Table 34: United Kingdom Military Biometrics Market Revenue (Million) Forecast, by Application 2019 & 2032
- Table 35: Germany Military Biometrics Market Revenue (Million) Forecast, by Application 2019 & 2032
- Table 36: France Military Biometrics Market Revenue (Million) Forecast, by Application 2019 & 2032
- Table 37: Italy Military Biometrics Market Revenue (Million) Forecast, by Application 2019 & 2032
- Table 38: Rest of Europe Military Biometrics Market Revenue (Million) Forecast, by Application 2019 & 2032
- Table 39: Global Military Biometrics Market Revenue Million Forecast, by Recognition Type 2019 & 2032
- Table 40: Global Military Biometrics Market Revenue Million Forecast, by Country 2019 & 2032
- Table 41: China Military Biometrics Market Revenue (Million) Forecast, by Application 2019 & 2032
- Table 42: Japan Military Biometrics Market Revenue (Million) Forecast, by Application 2019 & 2032
- Table 43: India Military Biometrics Market Revenue (Million) Forecast, by Application 2019 & 2032
- Table 44: South Korea Military Biometrics Market Revenue (Million) Forecast, by Application 2019 & 2032
- Table 45: Rest of Asia Pacific Military Biometrics Market Revenue (Million) Forecast, by Application 2019 & 2032
- Table 46: Global Military Biometrics Market Revenue Million Forecast, by Recognition Type 2019 & 2032
- Table 47: Global Military Biometrics Market Revenue Million Forecast, by Country 2019 & 2032
- Table 48: Brazil Military Biometrics Market Revenue (Million) Forecast, by Application 2019 & 2032
- Table 49: Mexico Military Biometrics Market Revenue (Million) Forecast, by Application 2019 & 2032
- Table 50: Rest of Latin America Military Biometrics Market Revenue (Million) Forecast, by Application 2019 & 2032
- Table 51: Global Military Biometrics Market Revenue Million Forecast, by Recognition Type 2019 & 2032
- Table 52: Global Military Biometrics Market Revenue Million Forecast, by Country 2019 & 2032
- Table 53: Saudi Arabia Military Biometrics Market Revenue (Million) Forecast, by Application 2019 & 2032
- Table 54: United Arab Emirates Military Biometrics Market Revenue (Million) Forecast, by Application 2019 & 2032
- Table 55: Qatar Military Biometrics Market Revenue (Million) Forecast, by Application 2019 & 2032
- Table 56: Rest of Middle East and Africa Military Biometrics Market Revenue (Million) Forecast, by Application 2019 & 2032
Frequently Asked Questions
1. What is the projected Compound Annual Growth Rate (CAGR) of the Military Biometrics Market?
The projected CAGR is approximately 6.73%.
2. Which companies are prominent players in the Military Biometrics Market?
Key companies in the market include THALE, M2SYS Technology, Cross Match Technologies Inc (HID Global Corporation), Aware Inc, BIO-key International, Fulcrum Biometrics, ZKTECO CO LTD, HID Global Corporation, NEC Corporation, Leidos Holdings Inc, Corvus Integration Inc, IDEMIA.
3. What are the main segments of the Military Biometrics Market?
The market segments include Recognition Type.
4. Can you provide details about the market size?
The market size is estimated to be USD 52.83 Million as of 2022.
5. What are some drivers contributing to market growth?
N/A
6. What are the notable trends driving market growth?
Fingerprint Recognition Segment Witness Highest Growth During the Forecast Period.
7. Are there any restraints impacting market growth?
N/A
8. Can you provide examples of recent developments in the market?
December 2022: PEO IEW&S (Program Executive Office Intelligence, Electronic Warfare and Sensors) announced that they developed a Biometrically Enabled Watch List Dissemination Management Functionality (BDMF). It addresses end-user requirements by significantly lowering the time it takes to transfer biometric data using DOD ABIS. The introduction of this technology will help defense forces to transfer massively large files of fingerprints, facial recognition imaging, and other biometric data.
9. What pricing options are available for accessing the report?
Pricing options include single-user, multi-user, and enterprise licenses priced at USD 4750, USD 5250, and USD 8750 respectively.
10. Is the market size provided in terms of value or volume?
The market size is provided in terms of value, measured in Million.
11. Are there any specific market keywords associated with the report?
Yes, the market keyword associated with the report is "Military Biometrics Market," which aids in identifying and referencing the specific market segment covered.
12. How do I determine which pricing option suits my needs best?
The pricing options vary based on user requirements and access needs. Individual users may opt for single-user licenses, while businesses requiring broader access may choose multi-user or enterprise licenses for cost-effective access to the report.
13. Are there any additional resources or data provided in the Military Biometrics Market report?
While the report offers comprehensive insights, it's advisable to review the specific contents or supplementary materials provided to ascertain if additional resources or data are available.
14. How can I stay updated on further developments or reports in the Military Biometrics Market?
To stay informed about further developments, trends, and reports in the Military Biometrics Market, consider subscribing to industry newsletters, following relevant companies and organizations, or regularly checking reputable industry news sources and publications.
Methodology
Step 1 - Identification of Relevant Samples Size from Population Database


Step 2 - Approaches for Defining Global Market Size (Value, Volume* & Price*)

Note*: In applicable scenarios
Step 3 - Data Sources
Primary Research
- Web Analytics
- Survey Reports
- Research Institute
- Latest Research Reports
- Opinion Leaders
Secondary Research
- Annual Reports
- White Paper
- Latest Press Release
- Industry Association
- Paid Database
- Investor Presentations

Step 4 - Data Triangulation
Involves using different sources of information in order to increase the validity of a study
These sources are likely to be stakeholders in a program - participants, other researchers, program staff, other community members, and so on.
Then we put all data in single framework & apply various statistical tools to find out the dynamic on the market.
During the analysis stage, feedback from the stakeholder groups would be compared to determine areas of agreement as well as areas of divergence


