

Key Insights
The metamaterials market is experiencing robust growth, driven by increasing demand across diverse sectors. The market's Compound Annual Growth Rate (CAGR) exceeding 24% from 2019-2033 signifies significant potential. This expansion is fueled by several key factors, including advancements in material science leading to improved performance characteristics like enhanced electromagnetic wave manipulation and unique optical properties. The rising adoption of metamaterials in applications such as 5G and 6G communication infrastructure, advanced radar systems, and high-performance computing is a primary growth driver. Furthermore, the increasing integration of metamaterials into consumer electronics, like improved antennas and sensors in smartphones and other devices, is contributing to market expansion. While challenges remain, such as the high cost of production and complex manufacturing processes, ongoing research and development efforts are focused on overcoming these limitations, ultimately fostering wider adoption. The market segmentation, encompassing various applications and geographical regions, presents diverse opportunities for established players and new entrants. Companies like Echodyne Corp, Kymeta Corporation, and Metawave Corporation are at the forefront of innovation, driving technological advancements and market penetration.
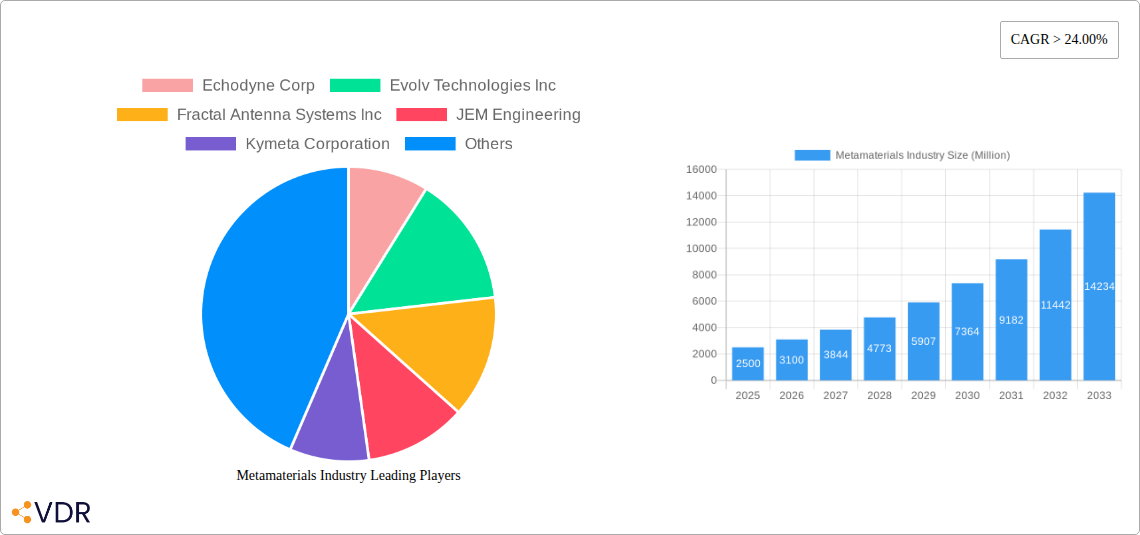
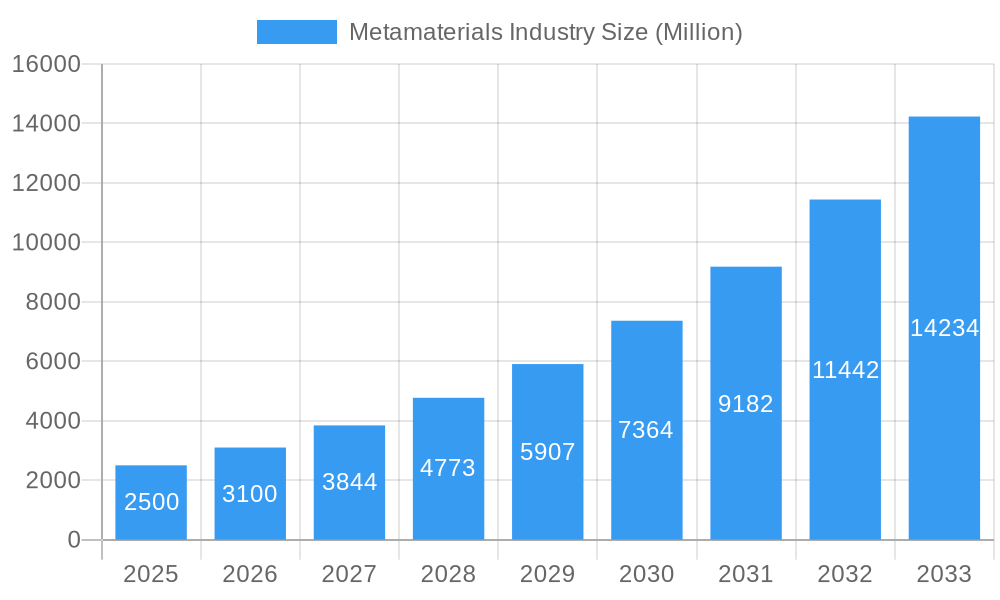
Metamaterials Industry Market Size (In Billion)
The forecast for the metamaterials market from 2025 to 2033 projects continuous expansion, with the market size expected to significantly increase. This projection is based on the sustained CAGR and the continuous emergence of new applications across various industries. The regional distribution of the market is likely to be influenced by factors such as technological advancements, government regulations, and investment in research and development. North America and Europe are currently leading regions, but significant growth is anticipated in Asia-Pacific, driven by increasing technological adoption and robust economic growth. Competition among companies is intense, pushing innovation and driving down costs. The long-term prospects for the metamaterials market are positive, with substantial growth potential driven by ongoing technological advancements and the expanding array of applications. However, successful navigation of the market requires a keen understanding of evolving technological trends, stringent regulatory landscapes, and the ever-shifting competitive landscape.
Metamaterials Industry Company Market Share
Metamaterials Industry Market Report: 2019-2033
This comprehensive report provides a detailed analysis of the Metamaterials industry, encompassing market dynamics, growth trends, competitive landscape, and future outlook. The study period covers 2019-2033, with 2025 as the base and estimated year. The report is essential for industry professionals, investors, and anyone seeking a thorough understanding of this rapidly evolving sector. The report delves into parent markets like advanced materials and child markets such as defense, telecommunications, and healthcare to provide a holistic perspective.
Metamaterials Industry Market Dynamics & Structure
The metamaterials market exhibits a moderately fragmented structure, with numerous players vying for market share. Technological innovation, particularly in areas like advanced manufacturing techniques and novel material compositions, acts as a crucial growth driver. Stringent regulatory frameworks concerning material safety and environmental impact pose both challenges and opportunities. Competitive product substitutes, such as conventional materials with improved functionalities, exert pressure on market growth. End-user demographics, largely driven by the adoption of metamaterials in high-growth sectors like 5G and defense, significantly influence market demand. M&A activity is relatively frequent, signaling consolidation and strategic expansion within the industry.
- Market Concentration: Moderately fragmented; top 5 players hold approximately xx% of the market share (2025 estimate).
- Technological Innovation: Significant advancements in additive manufacturing and nanotechnology are driving product development.
- Regulatory Landscape: Stringent regulations related to environmental impact and material safety are shaping industry practices.
- Competitive Substitutes: Traditional materials with enhanced properties offer competition, impacting market penetration.
- End-User Demographics: Strong demand from the defense, telecommunications, and aerospace sectors.
- M&A Trends: Moderate level of merger and acquisition activity observed in recent years (xx deals between 2019-2024).
Metamaterials Industry Growth Trends & Insights
The global metamaterials market is experiencing robust growth, driven by increasing demand across diverse applications. The market size witnessed a CAGR of xx% during the historical period (2019-2024) and is projected to reach USD xx million by 2025, growing further at a CAGR of xx% during the forecast period (2025-2033). This growth is primarily fueled by technological advancements, rising adoption rates in key sectors such as telecommunications (5G infrastructure), defense (radar systems), and healthcare (biomedical imaging), and the growing focus on miniaturization and enhanced functionalities of electronic devices. Consumer behavior shifts toward advanced technological solutions further contribute to market expansion. The market penetration rate is expected to reach xx% by 2033.
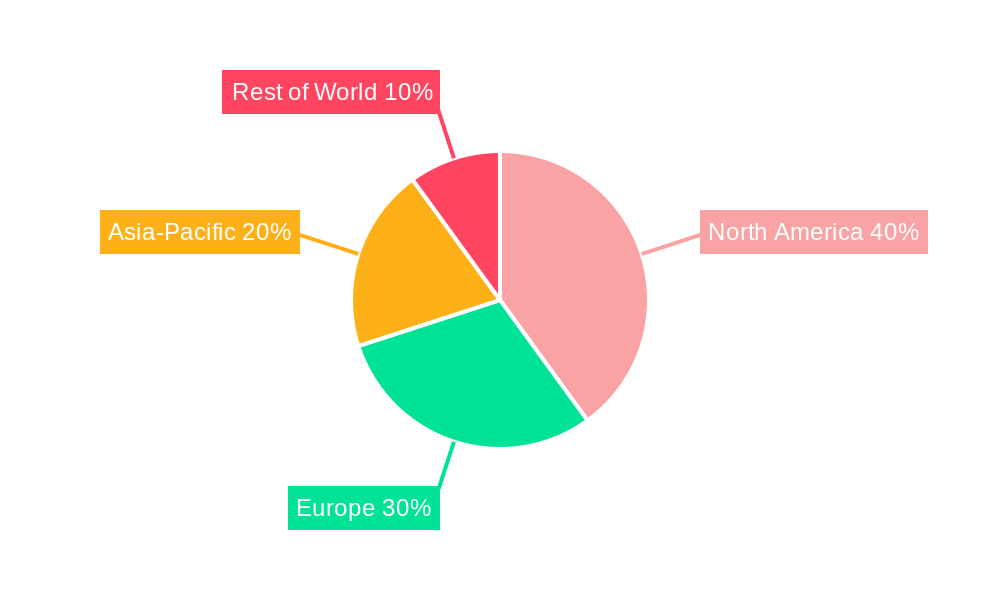
Dominant Regions, Countries, or Segments in Metamaterials Industry
North America currently holds the largest market share in the metamaterials industry, driven by strong R&D investments, the presence of major players, and significant demand from the defense and aerospace sectors. Europe follows as a significant market, fueled by substantial government funding for research and development activities, and the burgeoning 5G infrastructure development. The Asia-Pacific region demonstrates high growth potential, due to rapid economic growth, increasing investments in technological advancements, and strong government support for emerging technologies.
- North America: High market share due to strong R&D, established players, and defense sector demand.
- Europe: Significant market driven by government funding and 5G infrastructure development.
- Asia-Pacific: High growth potential due to economic expansion, technological investments, and government support.
Metamaterials Industry Product Landscape
Metamaterials offer a diverse range of products, including electromagnetic absorbers, lenses, and antennas, characterized by superior performance and unique functionalities compared to conventional materials. Recent product innovations focus on enhancing functionalities like improved bandwidth, increased efficiency, and miniaturization, leading to applications in 5G communication, advanced radar systems, and optical devices. Unique selling propositions include tailored electromagnetic properties, lightweight designs, and improved performance compared to traditional materials.
Key Drivers, Barriers & Challenges in Metamaterials Industry
Key Drivers:
- Growing demand from telecommunications, defense, and healthcare sectors.
- Advancements in nanotechnology and manufacturing techniques.
- Government initiatives and funding for research and development.
Key Challenges:
- High manufacturing costs and complex production processes.
- Limited scalability and supply chain constraints impacting availability.
- Regulatory hurdles and standardization challenges.
Emerging Opportunities in Metamaterials Industry
- Expansion into new applications, such as biomedical imaging, environmental sensing, and energy harvesting.
- Development of novel metamaterial designs with enhanced functionalities.
- Exploring partnerships and collaborations to accelerate commercialization and market penetration.
Growth Accelerators in the Metamaterials Industry
The long-term growth of the metamaterials industry is driven by continuous technological advancements, leading to enhanced product capabilities and performance, strategic partnerships between research institutions and industry players, and increasing investments in research and development. Market expansion into untapped sectors like consumer electronics and wearable technology further fuels growth.
Key Players Shaping the Metamaterials Industry Market
- Echodyne Corp
- Evolv Technologies Inc
- Fractal Antenna Systems Inc
- JEM Engineering
- Kymeta Corporation
- Metamaterials Inc
- Multiwave Technologies AG
- Nanohmics Inc
- NKT Photonics A/S
- TeraView Limited
- Metawave Corporation
- Aegis Technologies
- Metamagnetics
- NanoSonic Inc
- Nanoscribe GmbH & Co KG
- List Not Exhaustive
Notable Milestones in Metamaterials Industry Sector
- November 2022: Meta Materials Inc. launched its new headquarters and Centre of Excellence in Dartmouth, Nova Scotia, significantly enhancing its R&D and manufacturing capabilities.
- June 2022: Echodyne Corp. announced plans to test metamaterials-based radars, supported by a USD 135 million fundraising round, indicating a strong push towards commercialization in defense applications.
In-Depth Metamaterials Industry Market Outlook
The metamaterials market is poised for significant growth over the forecast period, driven by technological breakthroughs enabling cost reduction and scalability. Strategic partnerships and market expansion into diverse sectors will further accelerate market development. The industry’s long-term potential is substantial, offering promising opportunities for innovation and commercial success.
Metamaterials Industry Segmentation
-
1. Type
- 1.1. Electromagnetic
- 1.2. Terahertz
- 1.3. Tunable
- 1.4. Photonic
- 1.5. FSS
- 1.6. Other Types (Chiral, Nonlinear, etc.)
-
2. Application
- 2.1. Antenna and Radar
- 2.2. Sensors
- 2.3. Cloaking Devices
- 2.4. Superlens
- 2.5. Light and Sound Filtering
- 2.6. Other Applications (Solar, Absorbers, etc.)
-
3. End-user Industry
- 3.1. Healthcare
- 3.2. Telecommunication
- 3.3. Aerospace and Defense
- 3.4. Electronics
- 3.5. Other End-use Industries (including Optics)
Metamaterials Industry Segmentation By Geography
-
1. Asia Pacific
- 1.1. China
- 1.2. India
- 1.3. Japan
- 1.4. South Korea
- 1.5. Rest of Asia Pacific
-
2. North America
- 2.1. United States
- 2.2. Canada
- 2.3. Mexico
- 2.4. Rest of North America
-
3. Europe
- 3.1. Germany
- 3.2. United Kingdom
- 3.3. Italy
- 3.4. France
- 3.5. Spain
- 3.6. Rest of Europe
-
4. South America
- 4.1. Brazil
- 4.2. Argentina
- 4.3. Rest of South America
-
5. Middle East and Africa
- 5.1. Saudi Arabia
- 5.2. South Africa
- 5.3. Rest of Middle East and Africa
Metamaterials Industry Regional Market Share
Geographic Coverage of Metamaterials Industry
Metamaterials Industry REPORT HIGHLIGHTS
| Aspects | Details |
|---|---|
| Study Period | 2020-2034 |
| Base Year | 2025 |
| Estimated Year | 2026 |
| Forecast Period | 2026-2034 |
| Historical Period | 2020-2025 |
| Growth Rate | CAGR of 27.65% from 2020-2034 |
| Segmentation |
|
Table of Contents
- 1. Introduction
- 1.1. Research Scope
- 1.2. Market Segmentation
- 1.3. Research Objective
- 1.4. Definitions and Assumptions
- 2. Executive Summary
- 2.1. Market Snapshot
- 3. Market Dynamics
- 3.1. Market Drivers
- 3.2. Market Restrains
- 3.3. Market Trends
- 3.4. Market Opportunities
- 4. Market Factor Analysis
- 4.1. Porters Five Forces
- 4.1.1. Bargaining Power of Suppliers
- 4.1.2. Bargaining Power of Buyers
- 4.1.3. Threat of New Entrants
- 4.1.4. Threat of Substitutes
- 4.1.5. Competitive Rivalry
- 4.2. PESTEL analysis
- 4.3. BCG Analysis
- 4.3.1. Stars (High Growth, High Market Share)
- 4.3.2. Cash Cows (Low Growth, High Market Share)
- 4.3.3. Question Mark (High Growth, Low Market Share)
- 4.3.4. Dogs (Low Growth, Low Market Share)
- 4.4. Ansoff Matrix Analysis
- 4.5. Supply Chain Analysis
- 4.6. Regulatory Landscape
- 4.7. Current Market Potential and Opportunity Assessment (TAM–SAM–SOM Framework)
- 4.8. VDR Analyst Note
- 4.1. Porters Five Forces
- 5. Market Analysis, Insights and Forecast 2021-2033
- 5.1. Market Analysis, Insights and Forecast - by Type
- 5.1.1. Electromagnetic
- 5.1.2. Terahertz
- 5.1.3. Tunable
- 5.1.4. Photonic
- 5.1.5. FSS
- 5.1.6. Other Types (Chiral, Nonlinear, etc.)
- 5.2. Market Analysis, Insights and Forecast - by Application
- 5.2.1. Antenna and Radar
- 5.2.2. Sensors
- 5.2.3. Cloaking Devices
- 5.2.4. Superlens
- 5.2.5. Light and Sound Filtering
- 5.2.6. Other Applications (Solar, Absorbers, etc.)
- 5.3. Market Analysis, Insights and Forecast - by End-user Industry
- 5.3.1. Healthcare
- 5.3.2. Telecommunication
- 5.3.3. Aerospace and Defense
- 5.3.4. Electronics
- 5.3.5. Other End-use Industries (including Optics)
- 5.4. Market Analysis, Insights and Forecast - by Region
- 5.4.1. Asia Pacific
- 5.4.2. North America
- 5.4.3. Europe
- 5.4.4. South America
- 5.4.5. Middle East and Africa
- 5.1. Market Analysis, Insights and Forecast - by Type
- 6. Global Metamaterials Industry Analysis, Insights and Forecast, 2021-2033
- 6.1. Market Analysis, Insights and Forecast - by Type
- 6.1.1. Electromagnetic
- 6.1.2. Terahertz
- 6.1.3. Tunable
- 6.1.4. Photonic
- 6.1.5. FSS
- 6.1.6. Other Types (Chiral, Nonlinear, etc.)
- 6.2. Market Analysis, Insights and Forecast - by Application
- 6.2.1. Antenna and Radar
- 6.2.2. Sensors
- 6.2.3. Cloaking Devices
- 6.2.4. Superlens
- 6.2.5. Light and Sound Filtering
- 6.2.6. Other Applications (Solar, Absorbers, etc.)
- 6.3. Market Analysis, Insights and Forecast - by End-user Industry
- 6.3.1. Healthcare
- 6.3.2. Telecommunication
- 6.3.3. Aerospace and Defense
- 6.3.4. Electronics
- 6.3.5. Other End-use Industries (including Optics)
- 6.1. Market Analysis, Insights and Forecast - by Type
- 7. Asia Pacific Metamaterials Industry Analysis, Insights and Forecast, 2021-2033
- 7.1. Market Analysis, Insights and Forecast - by Type
- 7.1.1. Electromagnetic
- 7.1.2. Terahertz
- 7.1.3. Tunable
- 7.1.4. Photonic
- 7.1.5. FSS
- 7.1.6. Other Types (Chiral, Nonlinear, etc.)
- 7.2. Market Analysis, Insights and Forecast - by Application
- 7.2.1. Antenna and Radar
- 7.2.2. Sensors
- 7.2.3. Cloaking Devices
- 7.2.4. Superlens
- 7.2.5. Light and Sound Filtering
- 7.2.6. Other Applications (Solar, Absorbers, etc.)
- 7.3. Market Analysis, Insights and Forecast - by End-user Industry
- 7.3.1. Healthcare
- 7.3.2. Telecommunication
- 7.3.3. Aerospace and Defense
- 7.3.4. Electronics
- 7.3.5. Other End-use Industries (including Optics)
- 7.1. Market Analysis, Insights and Forecast - by Type
- 8. North America Metamaterials Industry Analysis, Insights and Forecast, 2021-2033
- 8.1. Market Analysis, Insights and Forecast - by Type
- 8.1.1. Electromagnetic
- 8.1.2. Terahertz
- 8.1.3. Tunable
- 8.1.4. Photonic
- 8.1.5. FSS
- 8.1.6. Other Types (Chiral, Nonlinear, etc.)
- 8.2. Market Analysis, Insights and Forecast - by Application
- 8.2.1. Antenna and Radar
- 8.2.2. Sensors
- 8.2.3. Cloaking Devices
- 8.2.4. Superlens
- 8.2.5. Light and Sound Filtering
- 8.2.6. Other Applications (Solar, Absorbers, etc.)
- 8.3. Market Analysis, Insights and Forecast - by End-user Industry
- 8.3.1. Healthcare
- 8.3.2. Telecommunication
- 8.3.3. Aerospace and Defense
- 8.3.4. Electronics
- 8.3.5. Other End-use Industries (including Optics)
- 8.1. Market Analysis, Insights and Forecast - by Type
- 9. Europe Metamaterials Industry Analysis, Insights and Forecast, 2021-2033
- 9.1. Market Analysis, Insights and Forecast - by Type
- 9.1.1. Electromagnetic
- 9.1.2. Terahertz
- 9.1.3. Tunable
- 9.1.4. Photonic
- 9.1.5. FSS
- 9.1.6. Other Types (Chiral, Nonlinear, etc.)
- 9.2. Market Analysis, Insights and Forecast - by Application
- 9.2.1. Antenna and Radar
- 9.2.2. Sensors
- 9.2.3. Cloaking Devices
- 9.2.4. Superlens
- 9.2.5. Light and Sound Filtering
- 9.2.6. Other Applications (Solar, Absorbers, etc.)
- 9.3. Market Analysis, Insights and Forecast - by End-user Industry
- 9.3.1. Healthcare
- 9.3.2. Telecommunication
- 9.3.3. Aerospace and Defense
- 9.3.4. Electronics
- 9.3.5. Other End-use Industries (including Optics)
- 9.1. Market Analysis, Insights and Forecast - by Type
- 10. South America Metamaterials Industry Analysis, Insights and Forecast, 2021-2033
- 10.1. Market Analysis, Insights and Forecast - by Type
- 10.1.1. Electromagnetic
- 10.1.2. Terahertz
- 10.1.3. Tunable
- 10.1.4. Photonic
- 10.1.5. FSS
- 10.1.6. Other Types (Chiral, Nonlinear, etc.)
- 10.2. Market Analysis, Insights and Forecast - by Application
- 10.2.1. Antenna and Radar
- 10.2.2. Sensors
- 10.2.3. Cloaking Devices
- 10.2.4. Superlens
- 10.2.5. Light and Sound Filtering
- 10.2.6. Other Applications (Solar, Absorbers, etc.)
- 10.3. Market Analysis, Insights and Forecast - by End-user Industry
- 10.3.1. Healthcare
- 10.3.2. Telecommunication
- 10.3.3. Aerospace and Defense
- 10.3.4. Electronics
- 10.3.5. Other End-use Industries (including Optics)
- 10.1. Market Analysis, Insights and Forecast - by Type
- 11. Middle East and Africa Metamaterials Industry Analysis, Insights and Forecast, 2021-2033
- 11.1. Market Analysis, Insights and Forecast - by Type
- 11.1.1. Electromagnetic
- 11.1.2. Terahertz
- 11.1.3. Tunable
- 11.1.4. Photonic
- 11.1.5. FSS
- 11.1.6. Other Types (Chiral, Nonlinear, etc.)
- 11.2. Market Analysis, Insights and Forecast - by Application
- 11.2.1. Antenna and Radar
- 11.2.2. Sensors
- 11.2.3. Cloaking Devices
- 11.2.4. Superlens
- 11.2.5. Light and Sound Filtering
- 11.2.6. Other Applications (Solar, Absorbers, etc.)
- 11.3. Market Analysis, Insights and Forecast - by End-user Industry
- 11.3.1. Healthcare
- 11.3.2. Telecommunication
- 11.3.3. Aerospace and Defense
- 11.3.4. Electronics
- 11.3.5. Other End-use Industries (including Optics)
- 11.1. Market Analysis, Insights and Forecast - by Type
- 12. Competitive Analysis
- 12.1. Company Profiles
- 12.1.1 Echodyne Corp
- 12.1.1.1. Company Overview
- 12.1.1.2. Products
- 12.1.1.3. Company Financials
- 12.1.1.4. SWOT Analysis
- 12.1.2 Evolv Technologies Inc
- 12.1.2.1. Company Overview
- 12.1.2.2. Products
- 12.1.2.3. Company Financials
- 12.1.2.4. SWOT Analysis
- 12.1.3 Fractal Antenna Systems Inc
- 12.1.3.1. Company Overview
- 12.1.3.2. Products
- 12.1.3.3. Company Financials
- 12.1.3.4. SWOT Analysis
- 12.1.4 JEM Engineering
- 12.1.4.1. Company Overview
- 12.1.4.2. Products
- 12.1.4.3. Company Financials
- 12.1.4.4. SWOT Analysis
- 12.1.5 Kymeta Corporation
- 12.1.5.1. Company Overview
- 12.1.5.2. Products
- 12.1.5.3. Company Financials
- 12.1.5.4. SWOT Analysis
- 12.1.6 Metamaterials Inc
- 12.1.6.1. Company Overview
- 12.1.6.2. Products
- 12.1.6.3. Company Financials
- 12.1.6.4. SWOT Analysis
- 12.1.7 Multiwave Technologies AG
- 12.1.7.1. Company Overview
- 12.1.7.2. Products
- 12.1.7.3. Company Financials
- 12.1.7.4. SWOT Analysis
- 12.1.8 Nanohmics Inc
- 12.1.8.1. Company Overview
- 12.1.8.2. Products
- 12.1.8.3. Company Financials
- 12.1.8.4. SWOT Analysis
- 12.1.9 NKT Photonics A/S
- 12.1.9.1. Company Overview
- 12.1.9.2. Products
- 12.1.9.3. Company Financials
- 12.1.9.4. SWOT Analysis
- 12.1.10 TeraView Limited
- 12.1.10.1. Company Overview
- 12.1.10.2. Products
- 12.1.10.3. Company Financials
- 12.1.10.4. SWOT Analysis
- 12.1.11 Metawave Corporation
- 12.1.11.1. Company Overview
- 12.1.11.2. Products
- 12.1.11.3. Company Financials
- 12.1.11.4. SWOT Analysis
- 12.1.12 Aegis Technologies
- 12.1.12.1. Company Overview
- 12.1.12.2. Products
- 12.1.12.3. Company Financials
- 12.1.12.4. SWOT Analysis
- 12.1.13 Metamagnetics
- 12.1.13.1. Company Overview
- 12.1.13.2. Products
- 12.1.13.3. Company Financials
- 12.1.13.4. SWOT Analysis
- 12.1.14 NanoSonic Inc
- 12.1.14.1. Company Overview
- 12.1.14.2. Products
- 12.1.14.3. Company Financials
- 12.1.14.4. SWOT Analysis
- 12.1.15 Nanoscribe GmbH & Co KG*List Not Exhaustive
- 12.1.15.1. Company Overview
- 12.1.15.2. Products
- 12.1.15.3. Company Financials
- 12.1.15.4. SWOT Analysis
- 12.1.1 Echodyne Corp
- 12.2. Market Entropy
- 12.2.1 Company's Key Areas Served
- 12.2.2 Recent Developments
- 12.3. Company Market Share Analysis 2025
- 12.3.1 Top 5 Companies Market Share Analysis
- 12.3.2 Top 3 Companies Market Share Analysis
- 12.4. List of Potential Customers
- 13. Research Methodology
List of Figures
- Figure 1: Global Metamaterials Industry Revenue Breakdown (undefined, %) by Region 2025 & 2033
- Figure 2: Asia Pacific Metamaterials Industry Revenue (undefined), by Type 2025 & 2033
- Figure 3: Asia Pacific Metamaterials Industry Revenue Share (%), by Type 2025 & 2033
- Figure 4: Asia Pacific Metamaterials Industry Revenue (undefined), by Application 2025 & 2033
- Figure 5: Asia Pacific Metamaterials Industry Revenue Share (%), by Application 2025 & 2033
- Figure 6: Asia Pacific Metamaterials Industry Revenue (undefined), by End-user Industry 2025 & 2033
- Figure 7: Asia Pacific Metamaterials Industry Revenue Share (%), by End-user Industry 2025 & 2033
- Figure 8: Asia Pacific Metamaterials Industry Revenue (undefined), by Country 2025 & 2033
- Figure 9: Asia Pacific Metamaterials Industry Revenue Share (%), by Country 2025 & 2033
- Figure 10: North America Metamaterials Industry Revenue (undefined), by Type 2025 & 2033
- Figure 11: North America Metamaterials Industry Revenue Share (%), by Type 2025 & 2033
- Figure 12: North America Metamaterials Industry Revenue (undefined), by Application 2025 & 2033
- Figure 13: North America Metamaterials Industry Revenue Share (%), by Application 2025 & 2033
- Figure 14: North America Metamaterials Industry Revenue (undefined), by End-user Industry 2025 & 2033
- Figure 15: North America Metamaterials Industry Revenue Share (%), by End-user Industry 2025 & 2033
- Figure 16: North America Metamaterials Industry Revenue (undefined), by Country 2025 & 2033
- Figure 17: North America Metamaterials Industry Revenue Share (%), by Country 2025 & 2033
- Figure 18: Europe Metamaterials Industry Revenue (undefined), by Type 2025 & 2033
- Figure 19: Europe Metamaterials Industry Revenue Share (%), by Type 2025 & 2033
- Figure 20: Europe Metamaterials Industry Revenue (undefined), by Application 2025 & 2033
- Figure 21: Europe Metamaterials Industry Revenue Share (%), by Application 2025 & 2033
- Figure 22: Europe Metamaterials Industry Revenue (undefined), by End-user Industry 2025 & 2033
- Figure 23: Europe Metamaterials Industry Revenue Share (%), by End-user Industry 2025 & 2033
- Figure 24: Europe Metamaterials Industry Revenue (undefined), by Country 2025 & 2033
- Figure 25: Europe Metamaterials Industry Revenue Share (%), by Country 2025 & 2033
- Figure 26: South America Metamaterials Industry Revenue (undefined), by Type 2025 & 2033
- Figure 27: South America Metamaterials Industry Revenue Share (%), by Type 2025 & 2033
- Figure 28: South America Metamaterials Industry Revenue (undefined), by Application 2025 & 2033
- Figure 29: South America Metamaterials Industry Revenue Share (%), by Application 2025 & 2033
- Figure 30: South America Metamaterials Industry Revenue (undefined), by End-user Industry 2025 & 2033
- Figure 31: South America Metamaterials Industry Revenue Share (%), by End-user Industry 2025 & 2033
- Figure 32: South America Metamaterials Industry Revenue (undefined), by Country 2025 & 2033
- Figure 33: South America Metamaterials Industry Revenue Share (%), by Country 2025 & 2033
- Figure 34: Middle East and Africa Metamaterials Industry Revenue (undefined), by Type 2025 & 2033
- Figure 35: Middle East and Africa Metamaterials Industry Revenue Share (%), by Type 2025 & 2033
- Figure 36: Middle East and Africa Metamaterials Industry Revenue (undefined), by Application 2025 & 2033
- Figure 37: Middle East and Africa Metamaterials Industry Revenue Share (%), by Application 2025 & 2033
- Figure 38: Middle East and Africa Metamaterials Industry Revenue (undefined), by End-user Industry 2025 & 2033
- Figure 39: Middle East and Africa Metamaterials Industry Revenue Share (%), by End-user Industry 2025 & 2033
- Figure 40: Middle East and Africa Metamaterials Industry Revenue (undefined), by Country 2025 & 2033
- Figure 41: Middle East and Africa Metamaterials Industry Revenue Share (%), by Country 2025 & 2033
List of Tables
- Table 1: Global Metamaterials Industry Revenue undefined Forecast, by Type 2020 & 2033
- Table 2: Global Metamaterials Industry Revenue undefined Forecast, by Application 2020 & 2033
- Table 3: Global Metamaterials Industry Revenue undefined Forecast, by End-user Industry 2020 & 2033
- Table 4: Global Metamaterials Industry Revenue undefined Forecast, by Region 2020 & 2033
- Table 5: Global Metamaterials Industry Revenue undefined Forecast, by Type 2020 & 2033
- Table 6: Global Metamaterials Industry Revenue undefined Forecast, by Application 2020 & 2033
- Table 7: Global Metamaterials Industry Revenue undefined Forecast, by End-user Industry 2020 & 2033
- Table 8: Global Metamaterials Industry Revenue undefined Forecast, by Country 2020 & 2033
- Table 9: China Metamaterials Industry Revenue (undefined) Forecast, by Application 2020 & 2033
- Table 10: India Metamaterials Industry Revenue (undefined) Forecast, by Application 2020 & 2033
- Table 11: Japan Metamaterials Industry Revenue (undefined) Forecast, by Application 2020 & 2033
- Table 12: South Korea Metamaterials Industry Revenue (undefined) Forecast, by Application 2020 & 2033
- Table 13: Rest of Asia Pacific Metamaterials Industry Revenue (undefined) Forecast, by Application 2020 & 2033
- Table 14: Global Metamaterials Industry Revenue undefined Forecast, by Type 2020 & 2033
- Table 15: Global Metamaterials Industry Revenue undefined Forecast, by Application 2020 & 2033
- Table 16: Global Metamaterials Industry Revenue undefined Forecast, by End-user Industry 2020 & 2033
- Table 17: Global Metamaterials Industry Revenue undefined Forecast, by Country 2020 & 2033
- Table 18: United States Metamaterials Industry Revenue (undefined) Forecast, by Application 2020 & 2033
- Table 19: Canada Metamaterials Industry Revenue (undefined) Forecast, by Application 2020 & 2033
- Table 20: Mexico Metamaterials Industry Revenue (undefined) Forecast, by Application 2020 & 2033
- Table 21: Rest of North America Metamaterials Industry Revenue (undefined) Forecast, by Application 2020 & 2033
- Table 22: Global Metamaterials Industry Revenue undefined Forecast, by Type 2020 & 2033
- Table 23: Global Metamaterials Industry Revenue undefined Forecast, by Application 2020 & 2033
- Table 24: Global Metamaterials Industry Revenue undefined Forecast, by End-user Industry 2020 & 2033
- Table 25: Global Metamaterials Industry Revenue undefined Forecast, by Country 2020 & 2033
- Table 26: Germany Metamaterials Industry Revenue (undefined) Forecast, by Application 2020 & 2033
- Table 27: United Kingdom Metamaterials Industry Revenue (undefined) Forecast, by Application 2020 & 2033
- Table 28: Italy Metamaterials Industry Revenue (undefined) Forecast, by Application 2020 & 2033
- Table 29: France Metamaterials Industry Revenue (undefined) Forecast, by Application 2020 & 2033
- Table 30: Spain Metamaterials Industry Revenue (undefined) Forecast, by Application 2020 & 2033
- Table 31: Rest of Europe Metamaterials Industry Revenue (undefined) Forecast, by Application 2020 & 2033
- Table 32: Global Metamaterials Industry Revenue undefined Forecast, by Type 2020 & 2033
- Table 33: Global Metamaterials Industry Revenue undefined Forecast, by Application 2020 & 2033
- Table 34: Global Metamaterials Industry Revenue undefined Forecast, by End-user Industry 2020 & 2033
- Table 35: Global Metamaterials Industry Revenue undefined Forecast, by Country 2020 & 2033
- Table 36: Brazil Metamaterials Industry Revenue (undefined) Forecast, by Application 2020 & 2033
- Table 37: Argentina Metamaterials Industry Revenue (undefined) Forecast, by Application 2020 & 2033
- Table 38: Rest of South America Metamaterials Industry Revenue (undefined) Forecast, by Application 2020 & 2033
- Table 39: Global Metamaterials Industry Revenue undefined Forecast, by Type 2020 & 2033
- Table 40: Global Metamaterials Industry Revenue undefined Forecast, by Application 2020 & 2033
- Table 41: Global Metamaterials Industry Revenue undefined Forecast, by End-user Industry 2020 & 2033
- Table 42: Global Metamaterials Industry Revenue undefined Forecast, by Country 2020 & 2033
- Table 43: Saudi Arabia Metamaterials Industry Revenue (undefined) Forecast, by Application 2020 & 2033
- Table 44: South Africa Metamaterials Industry Revenue (undefined) Forecast, by Application 2020 & 2033
- Table 45: Rest of Middle East and Africa Metamaterials Industry Revenue (undefined) Forecast, by Application 2020 & 2033
Frequently Asked Questions
1. What is the projected Compound Annual Growth Rate (CAGR) of the Metamaterials Industry?
The projected CAGR is approximately 27.65%.
2. Which companies are prominent players in the Metamaterials Industry?
Key companies in the market include Echodyne Corp, Evolv Technologies Inc, Fractal Antenna Systems Inc, JEM Engineering, Kymeta Corporation, Metamaterials Inc, Multiwave Technologies AG, Nanohmics Inc, NKT Photonics A/S, TeraView Limited, Metawave Corporation, Aegis Technologies, Metamagnetics, NanoSonic Inc, Nanoscribe GmbH & Co KG*List Not Exhaustive.
3. What are the main segments of the Metamaterials Industry?
The market segments include Type, Application, End-user Industry.
4. Can you provide details about the market size?
The market size is estimated to be USD XXX N/A as of 2022.
5. What are some drivers contributing to market growth?
Increasing R&D Investments for Various Applications; Other Drivers.
6. What are the notable trends driving market growth?
Aerospace and Defense Industry to Dominate the Market.
7. Are there any restraints impacting market growth?
Increasing R&D Investments for Various Applications; Other Drivers.
8. Can you provide examples of recent developments in the market?
November 2022: Meta Materials Inc. announced the launch of its new headquarters and Centre of Excellence in Dartmouth, Nova Scotia. The 68,000-square-foot state-of-the-art facility is the only facility in Canada to combine advanced packaging for semiconductors, unique materials, chemistry research, and the design and manufacturing of holographic and other optical products.
9. What pricing options are available for accessing the report?
Pricing options include single-user, multi-user, and enterprise licenses priced at USD 4750, USD 5250, and USD 8750 respectively.
10. Is the market size provided in terms of value or volume?
The market size is provided in terms of value, measured in N/A.
11. Are there any specific market keywords associated with the report?
Yes, the market keyword associated with the report is "Metamaterials Industry," which aids in identifying and referencing the specific market segment covered.
12. How do I determine which pricing option suits my needs best?
The pricing options vary based on user requirements and access needs. Individual users may opt for single-user licenses, while businesses requiring broader access may choose multi-user or enterprise licenses for cost-effective access to the report.
13. Are there any additional resources or data provided in the Metamaterials Industry report?
While the report offers comprehensive insights, it's advisable to review the specific contents or supplementary materials provided to ascertain if additional resources or data are available.
14. How can I stay updated on further developments or reports in the Metamaterials Industry?
To stay informed about further developments, trends, and reports in the Metamaterials Industry, consider subscribing to industry newsletters, following relevant companies and organizations, or regularly checking reputable industry news sources and publications.
Methodology
Step 1 - Identification of Relevant Samples Size from Population Database


Step 2 - Approaches for Defining Global Market Size (Value, Volume* & Price*)

Note*: In applicable scenarios
Step 3 - Data Sources
Primary Research
- Web Analytics
- Survey Reports
- Research Institute
- Latest Research Reports
- Opinion Leaders
Secondary Research
- Annual Reports
- White Paper
- Latest Press Release
- Industry Association
- Paid Database
- Investor Presentations

Step 4 - Data Triangulation
Involves using different sources of information in order to increase the validity of a study
These sources are likely to be stakeholders in a program - participants, other researchers, program staff, other community members, and so on.
Then we put all data in single framework & apply various statistical tools to find out the dynamic on the market.
During the analysis stage, feedback from the stakeholder groups would be compared to determine areas of agreement as well as areas of divergence