
Key Insights
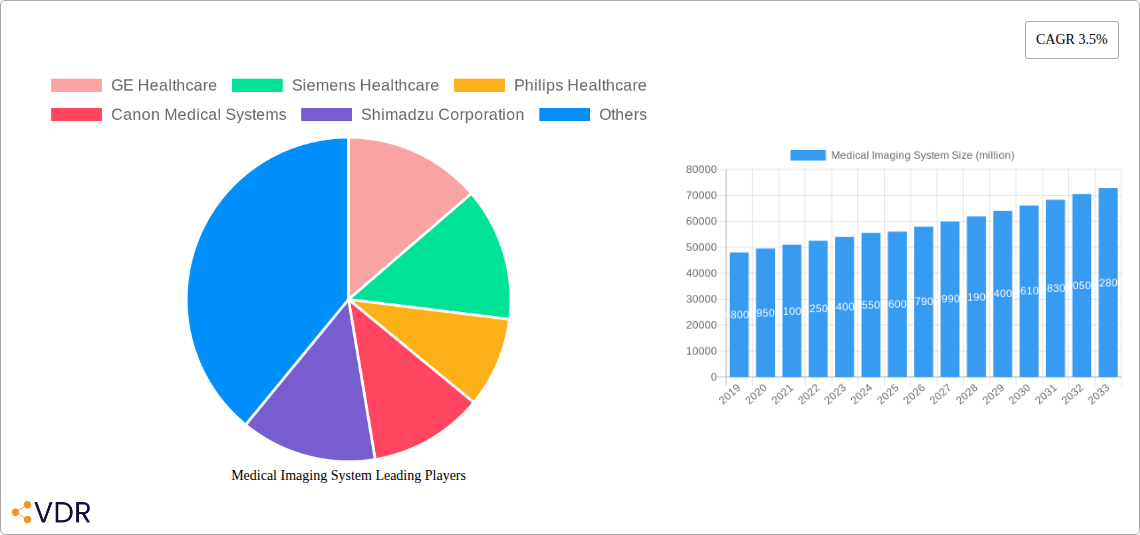
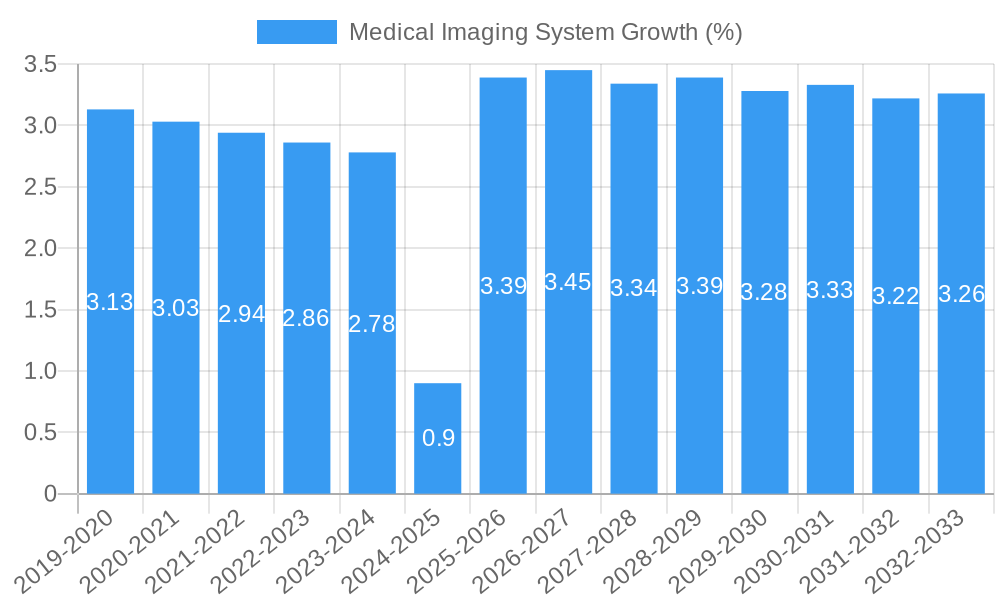
The global medical imaging system market is projected for robust expansion, currently valued at approximately $56,000 million and anticipated to grow at a Compound Annual Growth Rate (CAGR) of 3.5% throughout the forecast period of 2025-2033. This sustained growth is fueled by several critical drivers, including the increasing prevalence of chronic diseases and an aging global population, both of which necessitate advanced diagnostic capabilities. Furthermore, significant technological advancements are playing a pivotal role. Innovations such as artificial intelligence (AI) integration in image analysis, the development of more portable and cost-effective imaging devices, and the growing adoption of Picture Archiving and Communication Systems (PACS) and Electronic Health Records (EHRs) are enhancing efficiency and accessibility. The expanding healthcare infrastructure, particularly in emerging economies, and rising healthcare expenditure are also contributing to the market's upward trajectory. Key applications within this market span across hospitals, clinics, and other healthcare settings, with X-ray devices, computed tomography (CT) scanners, ultrasound systems, magnetic resonance imaging (MRI), and nuclear imaging systems forming the primary product segments driving demand.
Despite the promising outlook, the market faces certain restraints that could moderate its growth pace. These include the high cost of advanced medical imaging equipment, which can be a significant barrier, especially for smaller healthcare facilities and in resource-limited regions. Stringent regulatory frameworks governing the approval and deployment of medical devices also add to the complexity and time-to-market. Moreover, a shortage of skilled radiographers and technicians capable of operating and interpreting complex imaging systems poses a challenge to widespread adoption and optimal utilization. Nevertheless, the market is expected to witness evolving trends such as a greater focus on preventative care and early disease detection, leading to increased demand for screening modalities. The rise of telemedicine and remote diagnostics, enabled by sophisticated imaging technology, is also poised to reshape the market landscape, offering new avenues for growth and improved patient access to diagnostic services. The competitive landscape is dominated by major players like GE Healthcare, Siemens Healthcare, and Philips Healthcare, who are continuously investing in research and development to introduce innovative solutions and maintain their market leadership.
Medical Imaging System Market: Comprehensive Analysis 2019-2033
This report provides an in-depth analysis of the global Medical Imaging System market, covering its dynamics, growth trends, regional dominance, product landscape, key drivers, barriers, opportunities, and key players. With a study period spanning from 2019 to 2033, the report offers a comprehensive view of the market's past, present, and future.
Medical Imaging System Market Dynamics & Structure
The global Medical Imaging System market exhibits a moderate to high concentration, with leading players like GE Healthcare, Siemens Healthcare, and Philips Healthcare holding significant market shares. Technological innovation is a primary driver, fueled by advancements in AI-powered diagnostics, miniaturization of devices, and enhanced image resolution. Regulatory frameworks, such as FDA approvals and CE marking, play a crucial role in market access and product adoption. The market is characterized by intense competition, with companies constantly striving to differentiate through product features, service offerings, and pricing strategies. Competitive product substitutes, though less advanced, exist, particularly in primary care settings. End-user demographics, primarily an aging global population and the increasing prevalence of chronic diseases, are key demand drivers. Merger and acquisition (M&A) trends are significant, with strategic consolidations aimed at expanding product portfolios, geographic reach, and technological capabilities. For instance, recent M&A activities have focused on integrating AI into imaging workflows and acquiring companies with specialized imaging modalities.
- Market Concentration: Moderate to high, with top 5 players accounting for over 60% of the market share.
- Technological Innovation Drivers: AI integration, portable imaging, hybrid systems, advanced visualization.
- Regulatory Frameworks: Stringent approval processes by FDA, EMA, and other national bodies.
- Competitive Product Substitutes: Basic X-ray systems in certain low-resource settings.
- End-User Demographics: Aging population, rise in cancer, cardiovascular, and neurological diseases.
- M&A Trends: Focus on AI integration, expanding product lines, and global market penetration.
Medical Imaging System Growth Trends & Insights
The Medical Imaging System market is poised for robust growth, driven by an increasing demand for advanced diagnostic tools and a rising global healthcare expenditure. Market size is projected to expand from an estimated $48,500 million in 2025 to over $70,000 million by 2033, exhibiting a Compound Annual Growth Rate (CAGR) of approximately 4.5% during the forecast period. Adoption rates of sophisticated imaging modalities like Computed Tomography (CT) and Magnetic Resonance Imaging (MRI) are steadily increasing, particularly in emerging economies, as healthcare infrastructure improves. Technological disruptions are at the forefront, with the integration of Artificial Intelligence (AI) revolutionizing image interpretation, enhancing diagnostic accuracy, and improving workflow efficiency. AI algorithms are increasingly being used for anomaly detection, image reconstruction, and predictive analytics, leading to earlier disease diagnosis and personalized treatment plans. Consumer behavior is shifting towards proactive healthcare, with a growing emphasis on early detection and preventive screening. This trend, coupled with the increasing awareness of the benefits of advanced medical imaging, is a significant growth catalyst. Furthermore, the development of portable and point-of-care imaging devices is expanding access to diagnostic services, especially in remote and underserved areas. The rising burden of chronic diseases, including cancer, cardiovascular diseases, and neurological disorders, is a fundamental driver of demand for advanced imaging solutions. These diseases often require detailed imaging for diagnosis, staging, and monitoring treatment efficacy. The increasing investment by both public and private sectors in healthcare infrastructure, particularly in developing nations, is also contributing to the market's expansion. The continuous innovation in imaging hardware, such as higher resolution detectors and faster scan times, further enhances diagnostic capabilities and patient comfort, thus driving adoption.
Dominant Regions, Countries, or Segments in Medical Imaging System
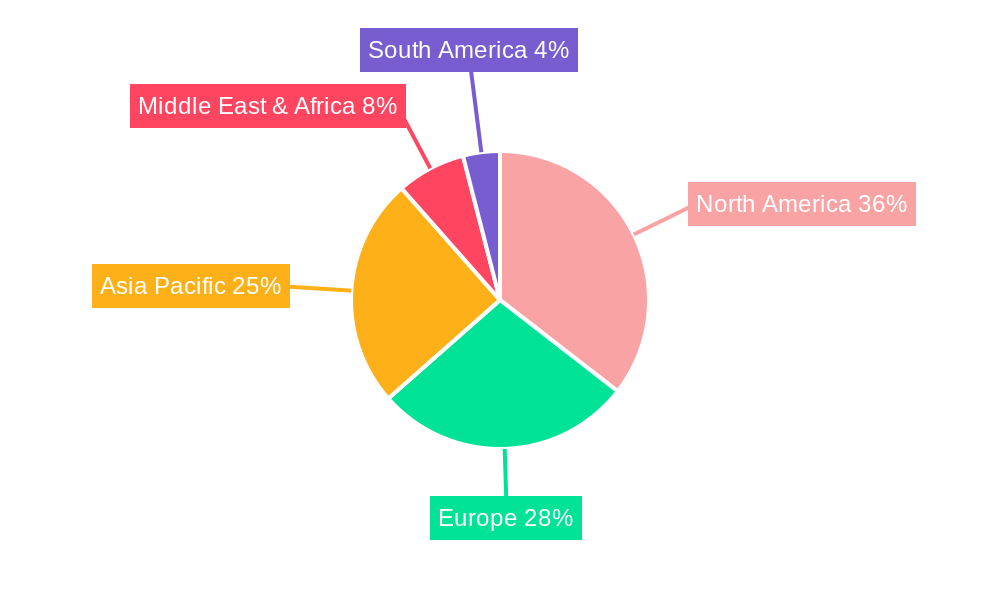
North America currently dominates the Medical Imaging System market, driven by a well-established healthcare infrastructure, high healthcare spending, and a strong emphasis on technological adoption. The United States, in particular, is a major contributor due to the presence of leading research institutions, advanced healthcare facilities, and a significant patient pool seeking advanced diagnostic solutions. Economic policies that support innovation and reimbursement schemes that favor advanced imaging procedures further bolster the region's dominance.
- Dominant Region: North America
- Key Country: United States
- Leading Segment (Application): Hospitals, accounting for approximately 65% of the market share.
- Leading Segment (Type): Computed Tomography (CT) and Magnetic Resonance Imaging (MRI) systems are the most significant contributors, driven by their extensive applications in diagnostics and treatment planning.
Asia Pacific is emerging as the fastest-growing region, fueled by rapid economic development, increasing healthcare investments, a growing population, and a rising incidence of lifestyle-related diseases. Countries like China and India are witnessing substantial growth due to the expansion of public and private healthcare facilities and government initiatives to improve access to medical diagnostics. Europe holds a significant share, supported by its advanced healthcare systems, supportive regulatory environment, and a high prevalence of an aging population. Latin America and the Middle East & Africa are also showing promising growth trajectories, driven by improving healthcare infrastructure and increasing awareness of advanced diagnostic techniques.
Within the application segment, Hospitals remain the largest end-user, driven by the comprehensive diagnostic needs of inpatient and outpatient services. However, clinics are witnessing a notable growth, particularly in adopting more portable and specialized imaging solutions. The "Others" segment, encompassing diagnostic imaging centers and research facilities, also contributes significantly.
In terms of Type, Computed Tomography (CT) and Magnetic Resonance Imaging (MRI) systems are the leading segments, owing to their versatility and critical role in diagnosing a wide range of conditions, from oncology and neurology to cardiology. Ultrasound Systems are also experiencing steady growth, especially with advancements in portable and high-resolution technologies. X-ray Devices, while mature, continue to hold a substantial market share due to their widespread use and cost-effectiveness. Nuclear Imaging, including PET and SPECT, is crucial for functional imaging and metabolic assessment, driving demand in specialized applications.
Medical Imaging System Product Landscape
The product landscape of the Medical Imaging System market is characterized by continuous innovation aimed at improving diagnostic accuracy, patient comfort, and workflow efficiency. Companies are focusing on developing ultra-high resolution CT scanners for detailed anatomical visualization and faster MRI systems to reduce scan times, thereby enhancing patient throughput. The integration of AI algorithms is a significant trend, enabling advanced image analysis, automated detection of abnormalities, and personalized diagnostic insights. Portable ultrasound devices are gaining traction for point-of-care diagnostics, while advanced X-ray systems incorporate lower radiation doses.
Key Drivers, Barriers & Challenges in Medical Imaging System
Key Drivers: The primary forces propelling the Medical Imaging System market include the rising global prevalence of chronic diseases like cancer and cardiovascular disorders, necessitating early and accurate diagnosis. Technological advancements, particularly in AI and miniaturization, are enhancing imaging capabilities. Favorable reimbursement policies and increasing healthcare expenditure, especially in emerging economies, further fuel market growth.
Key Barriers & Challenges: Significant challenges include the high initial cost of advanced imaging equipment, impacting adoption in resource-constrained settings. Stringent regulatory approvals and the need for extensive clinical validation of new technologies can slow down market entry. Cybersecurity concerns related to digital imaging data and the need for skilled personnel to operate and maintain complex systems also present hurdles. The supply chain disruptions observed in recent years have also impacted the availability and pricing of essential components.
Emerging Opportunities in Medical Imaging System
Emerging opportunities lie in the expansion of AI-powered diagnostic tools for predictive analytics and personalized medicine. The growing demand for portable and point-of-care imaging devices in remote and underserved areas presents a significant untapped market. Furthermore, the development of hybrid imaging systems that combine the strengths of different modalities, such as PET-MRI, offers enhanced diagnostic capabilities. The increasing focus on preventative healthcare and early disease detection creates a demand for screening technologies.
Growth Accelerators in the Medical Imaging System Industry
Growth in the Medical Imaging System industry is being accelerated by breakthroughs in AI and machine learning, which are transforming image analysis and diagnostic workflows. Strategic partnerships between technology providers and healthcare institutions are fostering the development and adoption of innovative solutions. The expanding healthcare infrastructure in emerging economies, coupled with favorable government policies, is creating new market opportunities. Moreover, the increasing demand for minimally invasive procedures, which often rely on advanced imaging for guidance and monitoring, is a significant growth catalyst.
Key Players Shaping the Medical Imaging System Market
- GE Healthcare
- Siemens Healthcare
- Philips Healthcare
- Canon Medical Systems
- Shimadzu Corporation
- Hitachi Medical Corporation
- Fujifilm Holdings Corporation
- Carestream Health
- Samsung Medison
- Hologic, Inc.
- Fonar Corporation
- Medtronic
- HOYA Group
- Konica Minolta
- Varian
Notable Milestones in Medical Imaging System Sector
- 2019: Introduction of AI-powered image reconstruction algorithms in CT scanners.
- 2020: Launch of advanced portable ultrasound devices with cloud connectivity.
- 2021: Significant investments in R&D for AI-driven cancer detection in mammography.
- 2022: Development of novel contrast agents for enhanced MRI visualization.
- 2023: FDA approval for an AI tool to assist in the detection of lung nodules.
- 2024: Expansion of hybrid imaging systems (PET-CT, PET-MRI) for oncology and neurology.
In-Depth Medical Imaging System Market Outlook
The future outlook for the Medical Imaging System market is exceptionally promising, driven by sustained technological innovation and growing global healthcare needs. The pervasive integration of Artificial Intelligence will continue to redefine diagnostic accuracy and efficiency, leading to earlier disease detection and personalized treatment pathways. Expansion into emerging markets, coupled with increasing healthcare investments and the rising demand for advanced diagnostics for chronic diseases, will further accelerate growth. Strategic collaborations and the development of more accessible and cost-effective imaging solutions will broaden market reach, making advanced diagnostics available to a wider population. The focus on preventative healthcare and the ongoing evolution of medical imaging modalities will solidify its indispensable role in modern healthcare delivery.
Medical Imaging System Segmentation
-
1. Application
- 1.1. Hospitals
- 1.2. Clinics
- 1.3. Others
-
2. Type
- 2.1. X-ray Devices
- 2.2. Computed Tomography
- 2.3. Ultrasound Systems
- 2.4. Magnetic Resonance Imaging
- 2.5. Nuclear Imaging
- 2.6. Other
Medical Imaging System Segmentation By Geography
-
1. North America
- 1.1. United States
- 1.2. Canada
- 1.3. Mexico
-
2. South America
- 2.1. Brazil
- 2.2. Argentina
- 2.3. Rest of South America
-
3. Europe
- 3.1. United Kingdom
- 3.2. Germany
- 3.3. France
- 3.4. Italy
- 3.5. Spain
- 3.6. Russia
- 3.7. Benelux
- 3.8. Nordics
- 3.9. Rest of Europe
-
4. Middle East & Africa
- 4.1. Turkey
- 4.2. Israel
- 4.3. GCC
- 4.4. North Africa
- 4.5. South Africa
- 4.6. Rest of Middle East & Africa
-
5. Asia Pacific
- 5.1. China
- 5.2. India
- 5.3. Japan
- 5.4. South Korea
- 5.5. ASEAN
- 5.6. Oceania
- 5.7. Rest of Asia Pacific
Medical Imaging System REPORT HIGHLIGHTS
| Aspects | Details |
|---|---|
| Study Period | 2019-2033 |
| Base Year | 2024 |
| Estimated Year | 2025 |
| Forecast Period | 2025-2033 |
| Historical Period | 2019-2024 |
| Growth Rate | CAGR of 3.5% from 2019-2033 |
| Segmentation |
|
Table of Contents
- 1. Introduction
- 1.1. Research Scope
- 1.2. Market Segmentation
- 1.3. Research Methodology
- 1.4. Definitions and Assumptions
- 2. Executive Summary
- 2.1. Introduction
- 3. Market Dynamics
- 3.1. Introduction
- 3.2. Market Drivers
- 3.3. Market Restrains
- 3.4. Market Trends
- 4. Market Factor Analysis
- 4.1. Porters Five Forces
- 4.2. Supply/Value Chain
- 4.3. PESTEL analysis
- 4.4. Market Entropy
- 4.5. Patent/Trademark Analysis
- 5. Global Medical Imaging System Analysis, Insights and Forecast, 2019-2031
- 5.1. Market Analysis, Insights and Forecast - by Application
- 5.1.1. Hospitals
- 5.1.2. Clinics
- 5.1.3. Others
- 5.2. Market Analysis, Insights and Forecast - by Type
- 5.2.1. X-ray Devices
- 5.2.2. Computed Tomography
- 5.2.3. Ultrasound Systems
- 5.2.4. Magnetic Resonance Imaging
- 5.2.5. Nuclear Imaging
- 5.2.6. Other
- 5.3. Market Analysis, Insights and Forecast - by Region
- 5.3.1. North America
- 5.3.2. South America
- 5.3.3. Europe
- 5.3.4. Middle East & Africa
- 5.3.5. Asia Pacific
- 5.1. Market Analysis, Insights and Forecast - by Application
- 6. North America Medical Imaging System Analysis, Insights and Forecast, 2019-2031
- 6.1. Market Analysis, Insights and Forecast - by Application
- 6.1.1. Hospitals
- 6.1.2. Clinics
- 6.1.3. Others
- 6.2. Market Analysis, Insights and Forecast - by Type
- 6.2.1. X-ray Devices
- 6.2.2. Computed Tomography
- 6.2.3. Ultrasound Systems
- 6.2.4. Magnetic Resonance Imaging
- 6.2.5. Nuclear Imaging
- 6.2.6. Other
- 6.1. Market Analysis, Insights and Forecast - by Application
- 7. South America Medical Imaging System Analysis, Insights and Forecast, 2019-2031
- 7.1. Market Analysis, Insights and Forecast - by Application
- 7.1.1. Hospitals
- 7.1.2. Clinics
- 7.1.3. Others
- 7.2. Market Analysis, Insights and Forecast - by Type
- 7.2.1. X-ray Devices
- 7.2.2. Computed Tomography
- 7.2.3. Ultrasound Systems
- 7.2.4. Magnetic Resonance Imaging
- 7.2.5. Nuclear Imaging
- 7.2.6. Other
- 7.1. Market Analysis, Insights and Forecast - by Application
- 8. Europe Medical Imaging System Analysis, Insights and Forecast, 2019-2031
- 8.1. Market Analysis, Insights and Forecast - by Application
- 8.1.1. Hospitals
- 8.1.2. Clinics
- 8.1.3. Others
- 8.2. Market Analysis, Insights and Forecast - by Type
- 8.2.1. X-ray Devices
- 8.2.2. Computed Tomography
- 8.2.3. Ultrasound Systems
- 8.2.4. Magnetic Resonance Imaging
- 8.2.5. Nuclear Imaging
- 8.2.6. Other
- 8.1. Market Analysis, Insights and Forecast - by Application
- 9. Middle East & Africa Medical Imaging System Analysis, Insights and Forecast, 2019-2031
- 9.1. Market Analysis, Insights and Forecast - by Application
- 9.1.1. Hospitals
- 9.1.2. Clinics
- 9.1.3. Others
- 9.2. Market Analysis, Insights and Forecast - by Type
- 9.2.1. X-ray Devices
- 9.2.2. Computed Tomography
- 9.2.3. Ultrasound Systems
- 9.2.4. Magnetic Resonance Imaging
- 9.2.5. Nuclear Imaging
- 9.2.6. Other
- 9.1. Market Analysis, Insights and Forecast - by Application
- 10. Asia Pacific Medical Imaging System Analysis, Insights and Forecast, 2019-2031
- 10.1. Market Analysis, Insights and Forecast - by Application
- 10.1.1. Hospitals
- 10.1.2. Clinics
- 10.1.3. Others
- 10.2. Market Analysis, Insights and Forecast - by Type
- 10.2.1. X-ray Devices
- 10.2.2. Computed Tomography
- 10.2.3. Ultrasound Systems
- 10.2.4. Magnetic Resonance Imaging
- 10.2.5. Nuclear Imaging
- 10.2.6. Other
- 10.1. Market Analysis, Insights and Forecast - by Application
- 11. Competitive Analysis
- 11.1. Global Market Share Analysis 2024
- 11.2. Company Profiles
- 11.2.1 GE Healthcare
- 11.2.1.1. Overview
- 11.2.1.2. Products
- 11.2.1.3. SWOT Analysis
- 11.2.1.4. Recent Developments
- 11.2.1.5. Financials (Based on Availability)
- 11.2.2 Siemens Healthcare
- 11.2.2.1. Overview
- 11.2.2.2. Products
- 11.2.2.3. SWOT Analysis
- 11.2.2.4. Recent Developments
- 11.2.2.5. Financials (Based on Availability)
- 11.2.3 Philips Healthcare
- 11.2.3.1. Overview
- 11.2.3.2. Products
- 11.2.3.3. SWOT Analysis
- 11.2.3.4. Recent Developments
- 11.2.3.5. Financials (Based on Availability)
- 11.2.4 Canon Medical Systems
- 11.2.4.1. Overview
- 11.2.4.2. Products
- 11.2.4.3. SWOT Analysis
- 11.2.4.4. Recent Developments
- 11.2.4.5. Financials (Based on Availability)
- 11.2.5 Shimadzu Corporation
- 11.2.5.1. Overview
- 11.2.5.2. Products
- 11.2.5.3. SWOT Analysis
- 11.2.5.4. Recent Developments
- 11.2.5.5. Financials (Based on Availability)
- 11.2.6 Hitachi Medical Corporation
- 11.2.6.1. Overview
- 11.2.6.2. Products
- 11.2.6.3. SWOT Analysis
- 11.2.6.4. Recent Developments
- 11.2.6.5. Financials (Based on Availability)
- 11.2.7 Fujifilm Holdings Corporation
- 11.2.7.1. Overview
- 11.2.7.2. Products
- 11.2.7.3. SWOT Analysis
- 11.2.7.4. Recent Developments
- 11.2.7.5. Financials (Based on Availability)
- 11.2.8 Carestream Health
- 11.2.8.1. Overview
- 11.2.8.2. Products
- 11.2.8.3. SWOT Analysis
- 11.2.8.4. Recent Developments
- 11.2.8.5. Financials (Based on Availability)
- 11.2.9 Samsung Medison
- 11.2.9.1. Overview
- 11.2.9.2. Products
- 11.2.9.3. SWOT Analysis
- 11.2.9.4. Recent Developments
- 11.2.9.5. Financials (Based on Availability)
- 11.2.10 Hologic Inc.
- 11.2.10.1. Overview
- 11.2.10.2. Products
- 11.2.10.3. SWOT Analysis
- 11.2.10.4. Recent Developments
- 11.2.10.5. Financials (Based on Availability)
- 11.2.11 Fonar Corporation
- 11.2.11.1. Overview
- 11.2.11.2. Products
- 11.2.11.3. SWOT Analysis
- 11.2.11.4. Recent Developments
- 11.2.11.5. Financials (Based on Availability)
- 11.2.12 Medtronic
- 11.2.12.1. Overview
- 11.2.12.2. Products
- 11.2.12.3. SWOT Analysis
- 11.2.12.4. Recent Developments
- 11.2.12.5. Financials (Based on Availability)
- 11.2.13 HOYA Group
- 11.2.13.1. Overview
- 11.2.13.2. Products
- 11.2.13.3. SWOT Analysis
- 11.2.13.4. Recent Developments
- 11.2.13.5. Financials (Based on Availability)
- 11.2.14 Konica Minolta
- 11.2.14.1. Overview
- 11.2.14.2. Products
- 11.2.14.3. SWOT Analysis
- 11.2.14.4. Recent Developments
- 11.2.14.5. Financials (Based on Availability)
- 11.2.15 Varian
- 11.2.15.1. Overview
- 11.2.15.2. Products
- 11.2.15.3. SWOT Analysis
- 11.2.15.4. Recent Developments
- 11.2.15.5. Financials (Based on Availability)
- 11.2.1 GE Healthcare
List of Figures
- Figure 1: Global Medical Imaging System Revenue Breakdown (million, %) by Region 2024 & 2032
- Figure 2: Global Medical Imaging System Volume Breakdown (K, %) by Region 2024 & 2032
- Figure 3: North America Medical Imaging System Revenue (million), by Application 2024 & 2032
- Figure 4: North America Medical Imaging System Volume (K), by Application 2024 & 2032
- Figure 5: North America Medical Imaging System Revenue Share (%), by Application 2024 & 2032
- Figure 6: North America Medical Imaging System Volume Share (%), by Application 2024 & 2032
- Figure 7: North America Medical Imaging System Revenue (million), by Type 2024 & 2032
- Figure 8: North America Medical Imaging System Volume (K), by Type 2024 & 2032
- Figure 9: North America Medical Imaging System Revenue Share (%), by Type 2024 & 2032
- Figure 10: North America Medical Imaging System Volume Share (%), by Type 2024 & 2032
- Figure 11: North America Medical Imaging System Revenue (million), by Country 2024 & 2032
- Figure 12: North America Medical Imaging System Volume (K), by Country 2024 & 2032
- Figure 13: North America Medical Imaging System Revenue Share (%), by Country 2024 & 2032
- Figure 14: North America Medical Imaging System Volume Share (%), by Country 2024 & 2032
- Figure 15: South America Medical Imaging System Revenue (million), by Application 2024 & 2032
- Figure 16: South America Medical Imaging System Volume (K), by Application 2024 & 2032
- Figure 17: South America Medical Imaging System Revenue Share (%), by Application 2024 & 2032
- Figure 18: South America Medical Imaging System Volume Share (%), by Application 2024 & 2032
- Figure 19: South America Medical Imaging System Revenue (million), by Type 2024 & 2032
- Figure 20: South America Medical Imaging System Volume (K), by Type 2024 & 2032
- Figure 21: South America Medical Imaging System Revenue Share (%), by Type 2024 & 2032
- Figure 22: South America Medical Imaging System Volume Share (%), by Type 2024 & 2032
- Figure 23: South America Medical Imaging System Revenue (million), by Country 2024 & 2032
- Figure 24: South America Medical Imaging System Volume (K), by Country 2024 & 2032
- Figure 25: South America Medical Imaging System Revenue Share (%), by Country 2024 & 2032
- Figure 26: South America Medical Imaging System Volume Share (%), by Country 2024 & 2032
- Figure 27: Europe Medical Imaging System Revenue (million), by Application 2024 & 2032
- Figure 28: Europe Medical Imaging System Volume (K), by Application 2024 & 2032
- Figure 29: Europe Medical Imaging System Revenue Share (%), by Application 2024 & 2032
- Figure 30: Europe Medical Imaging System Volume Share (%), by Application 2024 & 2032
- Figure 31: Europe Medical Imaging System Revenue (million), by Type 2024 & 2032
- Figure 32: Europe Medical Imaging System Volume (K), by Type 2024 & 2032
- Figure 33: Europe Medical Imaging System Revenue Share (%), by Type 2024 & 2032
- Figure 34: Europe Medical Imaging System Volume Share (%), by Type 2024 & 2032
- Figure 35: Europe Medical Imaging System Revenue (million), by Country 2024 & 2032
- Figure 36: Europe Medical Imaging System Volume (K), by Country 2024 & 2032
- Figure 37: Europe Medical Imaging System Revenue Share (%), by Country 2024 & 2032
- Figure 38: Europe Medical Imaging System Volume Share (%), by Country 2024 & 2032
- Figure 39: Middle East & Africa Medical Imaging System Revenue (million), by Application 2024 & 2032
- Figure 40: Middle East & Africa Medical Imaging System Volume (K), by Application 2024 & 2032
- Figure 41: Middle East & Africa Medical Imaging System Revenue Share (%), by Application 2024 & 2032
- Figure 42: Middle East & Africa Medical Imaging System Volume Share (%), by Application 2024 & 2032
- Figure 43: Middle East & Africa Medical Imaging System Revenue (million), by Type 2024 & 2032
- Figure 44: Middle East & Africa Medical Imaging System Volume (K), by Type 2024 & 2032
- Figure 45: Middle East & Africa Medical Imaging System Revenue Share (%), by Type 2024 & 2032
- Figure 46: Middle East & Africa Medical Imaging System Volume Share (%), by Type 2024 & 2032
- Figure 47: Middle East & Africa Medical Imaging System Revenue (million), by Country 2024 & 2032
- Figure 48: Middle East & Africa Medical Imaging System Volume (K), by Country 2024 & 2032
- Figure 49: Middle East & Africa Medical Imaging System Revenue Share (%), by Country 2024 & 2032
- Figure 50: Middle East & Africa Medical Imaging System Volume Share (%), by Country 2024 & 2032
- Figure 51: Asia Pacific Medical Imaging System Revenue (million), by Application 2024 & 2032
- Figure 52: Asia Pacific Medical Imaging System Volume (K), by Application 2024 & 2032
- Figure 53: Asia Pacific Medical Imaging System Revenue Share (%), by Application 2024 & 2032
- Figure 54: Asia Pacific Medical Imaging System Volume Share (%), by Application 2024 & 2032
- Figure 55: Asia Pacific Medical Imaging System Revenue (million), by Type 2024 & 2032
- Figure 56: Asia Pacific Medical Imaging System Volume (K), by Type 2024 & 2032
- Figure 57: Asia Pacific Medical Imaging System Revenue Share (%), by Type 2024 & 2032
- Figure 58: Asia Pacific Medical Imaging System Volume Share (%), by Type 2024 & 2032
- Figure 59: Asia Pacific Medical Imaging System Revenue (million), by Country 2024 & 2032
- Figure 60: Asia Pacific Medical Imaging System Volume (K), by Country 2024 & 2032
- Figure 61: Asia Pacific Medical Imaging System Revenue Share (%), by Country 2024 & 2032
- Figure 62: Asia Pacific Medical Imaging System Volume Share (%), by Country 2024 & 2032
List of Tables
- Table 1: Global Medical Imaging System Revenue million Forecast, by Region 2019 & 2032
- Table 2: Global Medical Imaging System Volume K Forecast, by Region 2019 & 2032
- Table 3: Global Medical Imaging System Revenue million Forecast, by Application 2019 & 2032
- Table 4: Global Medical Imaging System Volume K Forecast, by Application 2019 & 2032
- Table 5: Global Medical Imaging System Revenue million Forecast, by Type 2019 & 2032
- Table 6: Global Medical Imaging System Volume K Forecast, by Type 2019 & 2032
- Table 7: Global Medical Imaging System Revenue million Forecast, by Region 2019 & 2032
- Table 8: Global Medical Imaging System Volume K Forecast, by Region 2019 & 2032
- Table 9: Global Medical Imaging System Revenue million Forecast, by Application 2019 & 2032
- Table 10: Global Medical Imaging System Volume K Forecast, by Application 2019 & 2032
- Table 11: Global Medical Imaging System Revenue million Forecast, by Type 2019 & 2032
- Table 12: Global Medical Imaging System Volume K Forecast, by Type 2019 & 2032
- Table 13: Global Medical Imaging System Revenue million Forecast, by Country 2019 & 2032
- Table 14: Global Medical Imaging System Volume K Forecast, by Country 2019 & 2032
- Table 15: United States Medical Imaging System Revenue (million) Forecast, by Application 2019 & 2032
- Table 16: United States Medical Imaging System Volume (K) Forecast, by Application 2019 & 2032
- Table 17: Canada Medical Imaging System Revenue (million) Forecast, by Application 2019 & 2032
- Table 18: Canada Medical Imaging System Volume (K) Forecast, by Application 2019 & 2032
- Table 19: Mexico Medical Imaging System Revenue (million) Forecast, by Application 2019 & 2032
- Table 20: Mexico Medical Imaging System Volume (K) Forecast, by Application 2019 & 2032
- Table 21: Global Medical Imaging System Revenue million Forecast, by Application 2019 & 2032
- Table 22: Global Medical Imaging System Volume K Forecast, by Application 2019 & 2032
- Table 23: Global Medical Imaging System Revenue million Forecast, by Type 2019 & 2032
- Table 24: Global Medical Imaging System Volume K Forecast, by Type 2019 & 2032
- Table 25: Global Medical Imaging System Revenue million Forecast, by Country 2019 & 2032
- Table 26: Global Medical Imaging System Volume K Forecast, by Country 2019 & 2032
- Table 27: Brazil Medical Imaging System Revenue (million) Forecast, by Application 2019 & 2032
- Table 28: Brazil Medical Imaging System Volume (K) Forecast, by Application 2019 & 2032
- Table 29: Argentina Medical Imaging System Revenue (million) Forecast, by Application 2019 & 2032
- Table 30: Argentina Medical Imaging System Volume (K) Forecast, by Application 2019 & 2032
- Table 31: Rest of South America Medical Imaging System Revenue (million) Forecast, by Application 2019 & 2032
- Table 32: Rest of South America Medical Imaging System Volume (K) Forecast, by Application 2019 & 2032
- Table 33: Global Medical Imaging System Revenue million Forecast, by Application 2019 & 2032
- Table 34: Global Medical Imaging System Volume K Forecast, by Application 2019 & 2032
- Table 35: Global Medical Imaging System Revenue million Forecast, by Type 2019 & 2032
- Table 36: Global Medical Imaging System Volume K Forecast, by Type 2019 & 2032
- Table 37: Global Medical Imaging System Revenue million Forecast, by Country 2019 & 2032
- Table 38: Global Medical Imaging System Volume K Forecast, by Country 2019 & 2032
- Table 39: United Kingdom Medical Imaging System Revenue (million) Forecast, by Application 2019 & 2032
- Table 40: United Kingdom Medical Imaging System Volume (K) Forecast, by Application 2019 & 2032
- Table 41: Germany Medical Imaging System Revenue (million) Forecast, by Application 2019 & 2032
- Table 42: Germany Medical Imaging System Volume (K) Forecast, by Application 2019 & 2032
- Table 43: France Medical Imaging System Revenue (million) Forecast, by Application 2019 & 2032
- Table 44: France Medical Imaging System Volume (K) Forecast, by Application 2019 & 2032
- Table 45: Italy Medical Imaging System Revenue (million) Forecast, by Application 2019 & 2032
- Table 46: Italy Medical Imaging System Volume (K) Forecast, by Application 2019 & 2032
- Table 47: Spain Medical Imaging System Revenue (million) Forecast, by Application 2019 & 2032
- Table 48: Spain Medical Imaging System Volume (K) Forecast, by Application 2019 & 2032
- Table 49: Russia Medical Imaging System Revenue (million) Forecast, by Application 2019 & 2032
- Table 50: Russia Medical Imaging System Volume (K) Forecast, by Application 2019 & 2032
- Table 51: Benelux Medical Imaging System Revenue (million) Forecast, by Application 2019 & 2032
- Table 52: Benelux Medical Imaging System Volume (K) Forecast, by Application 2019 & 2032
- Table 53: Nordics Medical Imaging System Revenue (million) Forecast, by Application 2019 & 2032
- Table 54: Nordics Medical Imaging System Volume (K) Forecast, by Application 2019 & 2032
- Table 55: Rest of Europe Medical Imaging System Revenue (million) Forecast, by Application 2019 & 2032
- Table 56: Rest of Europe Medical Imaging System Volume (K) Forecast, by Application 2019 & 2032
- Table 57: Global Medical Imaging System Revenue million Forecast, by Application 2019 & 2032
- Table 58: Global Medical Imaging System Volume K Forecast, by Application 2019 & 2032
- Table 59: Global Medical Imaging System Revenue million Forecast, by Type 2019 & 2032
- Table 60: Global Medical Imaging System Volume K Forecast, by Type 2019 & 2032
- Table 61: Global Medical Imaging System Revenue million Forecast, by Country 2019 & 2032
- Table 62: Global Medical Imaging System Volume K Forecast, by Country 2019 & 2032
- Table 63: Turkey Medical Imaging System Revenue (million) Forecast, by Application 2019 & 2032
- Table 64: Turkey Medical Imaging System Volume (K) Forecast, by Application 2019 & 2032
- Table 65: Israel Medical Imaging System Revenue (million) Forecast, by Application 2019 & 2032
- Table 66: Israel Medical Imaging System Volume (K) Forecast, by Application 2019 & 2032
- Table 67: GCC Medical Imaging System Revenue (million) Forecast, by Application 2019 & 2032
- Table 68: GCC Medical Imaging System Volume (K) Forecast, by Application 2019 & 2032
- Table 69: North Africa Medical Imaging System Revenue (million) Forecast, by Application 2019 & 2032
- Table 70: North Africa Medical Imaging System Volume (K) Forecast, by Application 2019 & 2032
- Table 71: South Africa Medical Imaging System Revenue (million) Forecast, by Application 2019 & 2032
- Table 72: South Africa Medical Imaging System Volume (K) Forecast, by Application 2019 & 2032
- Table 73: Rest of Middle East & Africa Medical Imaging System Revenue (million) Forecast, by Application 2019 & 2032
- Table 74: Rest of Middle East & Africa Medical Imaging System Volume (K) Forecast, by Application 2019 & 2032
- Table 75: Global Medical Imaging System Revenue million Forecast, by Application 2019 & 2032
- Table 76: Global Medical Imaging System Volume K Forecast, by Application 2019 & 2032
- Table 77: Global Medical Imaging System Revenue million Forecast, by Type 2019 & 2032
- Table 78: Global Medical Imaging System Volume K Forecast, by Type 2019 & 2032
- Table 79: Global Medical Imaging System Revenue million Forecast, by Country 2019 & 2032
- Table 80: Global Medical Imaging System Volume K Forecast, by Country 2019 & 2032
- Table 81: China Medical Imaging System Revenue (million) Forecast, by Application 2019 & 2032
- Table 82: China Medical Imaging System Volume (K) Forecast, by Application 2019 & 2032
- Table 83: India Medical Imaging System Revenue (million) Forecast, by Application 2019 & 2032
- Table 84: India Medical Imaging System Volume (K) Forecast, by Application 2019 & 2032
- Table 85: Japan Medical Imaging System Revenue (million) Forecast, by Application 2019 & 2032
- Table 86: Japan Medical Imaging System Volume (K) Forecast, by Application 2019 & 2032
- Table 87: South Korea Medical Imaging System Revenue (million) Forecast, by Application 2019 & 2032
- Table 88: South Korea Medical Imaging System Volume (K) Forecast, by Application 2019 & 2032
- Table 89: ASEAN Medical Imaging System Revenue (million) Forecast, by Application 2019 & 2032
- Table 90: ASEAN Medical Imaging System Volume (K) Forecast, by Application 2019 & 2032
- Table 91: Oceania Medical Imaging System Revenue (million) Forecast, by Application 2019 & 2032
- Table 92: Oceania Medical Imaging System Volume (K) Forecast, by Application 2019 & 2032
- Table 93: Rest of Asia Pacific Medical Imaging System Revenue (million) Forecast, by Application 2019 & 2032
- Table 94: Rest of Asia Pacific Medical Imaging System Volume (K) Forecast, by Application 2019 & 2032
Frequently Asked Questions
1. What is the projected Compound Annual Growth Rate (CAGR) of the Medical Imaging System?
The projected CAGR is approximately 3.5%.
2. Which companies are prominent players in the Medical Imaging System?
Key companies in the market include GE Healthcare, Siemens Healthcare, Philips Healthcare, Canon Medical Systems, Shimadzu Corporation, Hitachi Medical Corporation, Fujifilm Holdings Corporation, Carestream Health, Samsung Medison, Hologic, Inc., Fonar Corporation, Medtronic, HOYA Group, Konica Minolta, Varian.
3. What are the main segments of the Medical Imaging System?
The market segments include Application, Type.
4. Can you provide details about the market size?
The market size is estimated to be USD 56000 million as of 2022.
5. What are some drivers contributing to market growth?
N/A
6. What are the notable trends driving market growth?
N/A
7. Are there any restraints impacting market growth?
N/A
8. Can you provide examples of recent developments in the market?
N/A
9. What pricing options are available for accessing the report?
Pricing options include single-user, multi-user, and enterprise licenses priced at USD 3950.00, USD 5925.00, and USD 7900.00 respectively.
10. Is the market size provided in terms of value or volume?
The market size is provided in terms of value, measured in million and volume, measured in K.
11. Are there any specific market keywords associated with the report?
Yes, the market keyword associated with the report is "Medical Imaging System," which aids in identifying and referencing the specific market segment covered.
12. How do I determine which pricing option suits my needs best?
The pricing options vary based on user requirements and access needs. Individual users may opt for single-user licenses, while businesses requiring broader access may choose multi-user or enterprise licenses for cost-effective access to the report.
13. Are there any additional resources or data provided in the Medical Imaging System report?
While the report offers comprehensive insights, it's advisable to review the specific contents or supplementary materials provided to ascertain if additional resources or data are available.
14. How can I stay updated on further developments or reports in the Medical Imaging System?
To stay informed about further developments, trends, and reports in the Medical Imaging System, consider subscribing to industry newsletters, following relevant companies and organizations, or regularly checking reputable industry news sources and publications.
Methodology
Step 1 - Identification of Relevant Samples Size from Population Database


Step 2 - Approaches for Defining Global Market Size (Value, Volume* & Price*)

Note*: In applicable scenarios
Step 3 - Data Sources
Primary Research
- Web Analytics
- Survey Reports
- Research Institute
- Latest Research Reports
- Opinion Leaders
Secondary Research
- Annual Reports
- White Paper
- Latest Press Release
- Industry Association
- Paid Database
- Investor Presentations

Step 4 - Data Triangulation
Involves using different sources of information in order to increase the validity of a study
These sources are likely to be stakeholders in a program - participants, other researchers, program staff, other community members, and so on.
Then we put all data in single framework & apply various statistical tools to find out the dynamic on the market.
During the analysis stage, feedback from the stakeholder groups would be compared to determine areas of agreement as well as areas of divergence


