

Key Insights
The global Medical Image Exchange Systems market is poised for substantial growth, projected to reach a valuation of $4.59 Billion by 2025, driven by a robust Compound Annual Growth Rate (CAGR) of 6.96%. This expansion is primarily fueled by the increasing need for seamless and secure sharing of medical imaging data across healthcare networks, enabling better patient care, collaborative diagnosis, and more efficient treatment planning. The proliferation of digital imaging technologies, coupled with the growing adoption of Electronic Health Records (EHRs) and the imperative for interoperability between disparate healthcare systems, are key market catalysts. Furthermore, the rising prevalence of chronic diseases necessitates advanced diagnostic capabilities and timely access to imaging results, thereby boosting the demand for effective image exchange solutions. The market is segmented into System types, with the Picture Archiving and Communications System (PACS) and Vendor Neutral Archive (VNA) holding significant shares due to their critical role in storing, managing, and distributing medical images. The End-User segment is dominated by Hospitals, followed by Diagnostic Centers, as these facilities generate and require the largest volumes of medical imaging data.
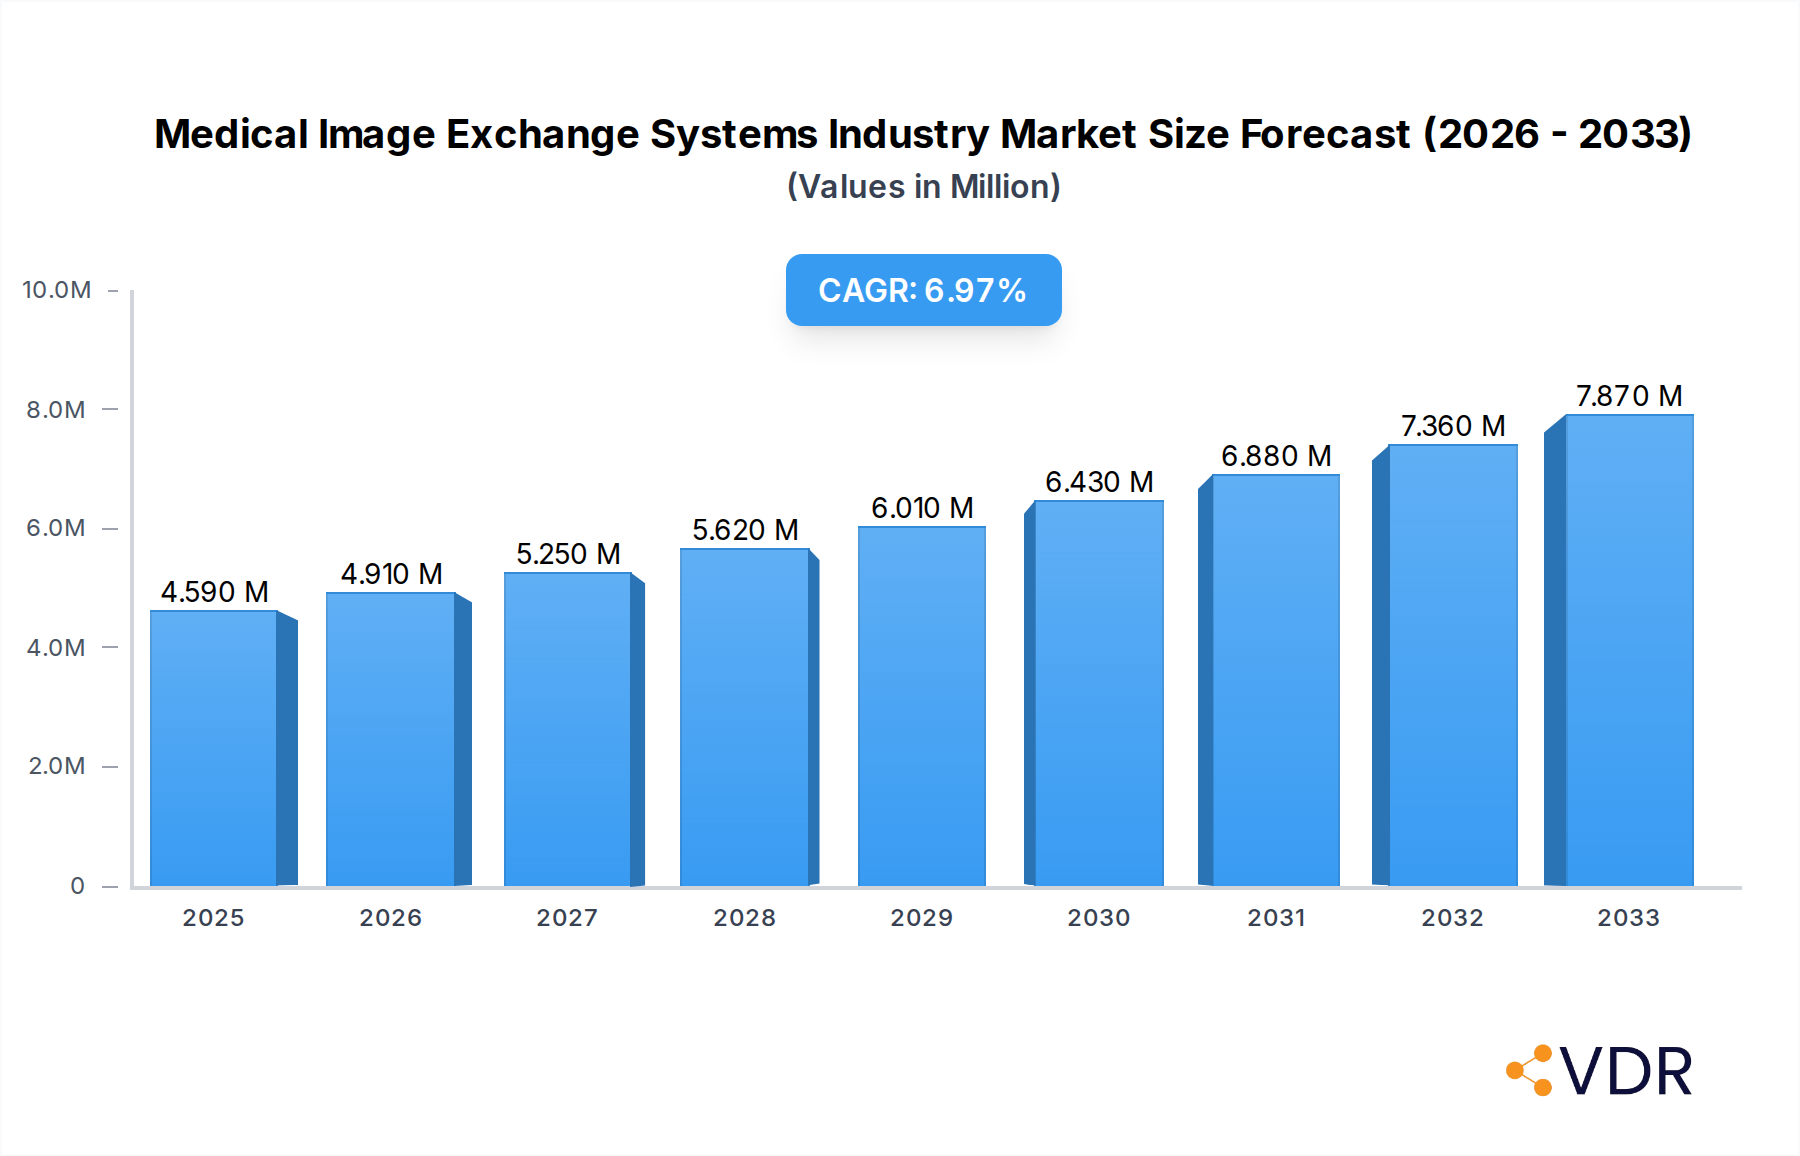
Medical Image Exchange Systems Industry Market Size (In Million)
The market's trajectory is further shaped by evolving healthcare paradigms, including the shift towards value-based care and the increasing emphasis on remote patient monitoring and telehealth. While the market exhibits strong growth potential, certain factors, such as the high initial investment costs for implementing advanced image exchange solutions and stringent data privacy regulations (e.g., HIPAA, GDPR), could present moderate restraints. However, ongoing technological advancements, including cloud-based solutions and AI-powered analytics for image interpretation and management, are expected to mitigate these challenges and unlock new avenues for growth. Key industry players like Siemens Healthineers, GE Healthcare, Philips, and IBM are actively investing in R&D to offer integrated and intelligent image exchange platforms, catering to the evolving needs of healthcare providers worldwide. Geographically, North America and Europe currently lead the market due to advanced healthcare infrastructure and early adoption of digital health technologies, with the Asia Pacific region exhibiting the fastest growth potential due to increasing healthcare expenditure and a burgeoning patient population.

Medical Image Exchange Systems Industry Company Market Share
This comprehensive report delivers an in-depth analysis of the global Medical Image Exchange Systems industry, forecasting significant growth and transformative shifts. Explore market dynamics, technological advancements, and competitive landscapes crucial for strategic decision-making. With a focus on parent and child markets, this report provides actionable insights for stakeholders navigating the evolving healthcare IT ecosystem. Study Period: 2019–2033 | Base Year: 2025 | Forecast Period: 2025–2033.
Medical Image Exchange Systems Industry Market Dynamics & Structure
The Medical Image Exchange Systems industry is characterized by a moderately concentrated market structure, with key players like Siemens Healthineers, GE Healthcare, and Koninklijke Philips NV holding substantial market shares. Technological innovation is a primary driver, fueled by the demand for interoperability, cloud-based solutions, and AI-powered analytics. Regulatory frameworks, such as HIPAA and GDPR, are shaping data security and privacy standards, influencing system design and adoption. Competitive product substitutes, including traditional PACS solutions and on-premise storage, are gradually being supplanted by more flexible and scalable enterprise imaging solutions. End-user demographics are shifting towards larger hospital networks and integrated delivery networks seeking centralized image management. Mergers and acquisitions (M&A) are a notable trend, as larger vendors acquire innovative startups to expand their product portfolios and market reach. The volume of M&A deals has seen a steady increase of approximately 15% year-over-year during the historical period. Barriers to innovation include the high cost of implementing new systems, resistance to change from existing infrastructure, and complex integration challenges within diverse IT environments.
- Market Concentration: Dominated by a few large players, but with growing opportunities for specialized vendors.
- Technological Innovation Drivers: Interoperability, AI/ML integration, cloud adoption, cybersecurity.
- Regulatory Frameworks: HIPAA, GDPR, and emerging data localization laws impacting system architecture.
- Competitive Product Substitutes: Traditional PACS, local storage solutions, DICOM-compliant viewers.
- End-User Demographics: Shift towards integrated healthcare systems and academic medical centers.
- M&A Trends: Strategic acquisitions to gain technological edge and market access.
Medical Image Exchange Systems Industry Growth Trends & Insights
The Medical Image Exchange Systems market is poised for robust expansion, driven by the accelerating digital transformation in healthcare and the increasing volume of medical imaging data. The global market size for medical image exchange systems is projected to reach approximately $15,800 Million by 2033, exhibiting a Compound Annual Growth Rate (CAGR) of 12.5% during the forecast period. This growth is underpinned by the rising adoption of enterprise imaging solutions, which offer a unified platform for managing and sharing all types of medical images, breaking down data silos. Technological disruptions, such as the integration of artificial intelligence (AI) for image analysis and diagnostic assistance, are further enhancing the value proposition of these systems. Consumer behavior is shifting towards greater demand for seamless patient data access and remote consultation capabilities, propelling the need for efficient image exchange platforms.
Adoption rates of cloud-based medical image exchange systems are experiencing a significant surge, projected to grow by over 18% annually through 2030. This shift is driven by the inherent scalability, cost-effectiveness, and enhanced accessibility offered by cloud infrastructure. Furthermore, the increasing prevalence of chronic diseases and an aging global population are leading to a higher demand for diagnostic imaging procedures, consequently increasing the volume of medical images that require efficient exchange and management. The market penetration of advanced Picture Archiving and Communication Systems (PACS) and Vendor Neutral Archives (VNAs) is expanding as healthcare providers recognize their critical role in improving workflow efficiency, reducing storage costs, and facilitating research and collaboration.
The growing emphasis on value-based care and the need for improved patient outcomes are also significant growth catalysts. Medical image exchange systems facilitate better care coordination by enabling seamless sharing of images and associated reports among referring physicians, specialists, and radiologists, regardless of their geographical location or the imaging system used. This leads to more accurate diagnoses, reduced redundant procedures, and improved patient satisfaction. The increasing investment in healthcare IT infrastructure by both government bodies and private entities further supports the adoption of these advanced systems.
The market is also witnessing a trend towards greater interoperability between different healthcare IT systems, including Electronic Health Records (EHRs). This interoperability is crucial for providing a holistic view of patient information, with medical images being an integral part of this comprehensive data set. As the healthcare industry continues to embrace digital solutions, the demand for robust, secure, and efficient medical image exchange systems will only continue to escalate, cementing their position as a vital component of modern healthcare delivery.
Dominant Regions, Countries, or Segments in Medical Image Exchange Systems Industry
North America currently holds a dominant position in the global Medical Image Exchange Systems market, driven by several key factors including high healthcare expenditure, advanced technological infrastructure, and strong government initiatives promoting digital health. The United States, in particular, is a significant contributor to this dominance, with a well-established healthcare ecosystem that prioritizes innovation and efficiency. The region's high adoption rate of advanced imaging modalities and a strong focus on interoperability further solidify its leadership.
Within the system segments, Picture Archiving and Communication System (PACS) remains the most significant market driver. The ubiquitous use of PACS in hospitals and diagnostic centers, coupled with ongoing upgrades to enterprise-level PACS solutions, accounts for a substantial market share, estimated at around 55% of the total market. These systems are crucial for storing, retrieving, and distributing medical images and associated data, forming the backbone of radiology departments worldwide.
Among the end-user segments, Hospitals represent the largest and fastest-growing category. Their extensive imaging needs, coupled with the increasing implementation of PACS and VNA solutions to manage large volumes of imaging data, contribute to their market leadership. The push towards integrated healthcare delivery networks and the need for seamless image sharing across multiple hospital facilities further amplify this segment's importance. Hospitals are actively investing in solutions that enhance diagnostic accuracy, streamline workflows, and improve patient care coordination.
- Leading Region: North America, driven by the United States' advanced healthcare IT adoption and robust market infrastructure.
- Dominant System Segment: Picture Archiving and Communication System (PACS), due to its foundational role in radiology departments and continuous technological advancements.
- Largest End-User Segment: Hospitals, owing to their extensive imaging requirements and significant investments in enterprise imaging solutions.
- Key Drivers for Hospital Dominance: Increasing imaging volumes, adoption of integrated care models, demand for workflow efficiency.
- Growth Potential: Emerging markets in Asia-Pacific and Latin America are showing promising growth trajectories due to increasing healthcare investments and digital adoption.
Medical Image Exchange Systems Industry Product Landscape
The product landscape for Medical Image Exchange Systems is defined by continuous innovation, focusing on enhanced interoperability, advanced analytics, and robust security features. Key product innovations include the development of cloud-native PACS and VNAs, enabling scalable and accessible image management solutions. AI-powered tools are being integrated for automated image segmentation, anomaly detection, and predictive analytics, improving diagnostic speed and accuracy. Furthermore, the emphasis on vendor-neutral solutions allows for seamless integration with diverse imaging equipment and IT infrastructure, reducing vendor lock-in and promoting flexibility. Performance metrics are being optimized for faster image retrieval times, reduced storage costs, and improved data integrity, all crucial for real-time clinical decision-making.
Key Drivers, Barriers & Challenges in Medical Image Exchange Systems Industry
The Medical Image Exchange Systems industry is propelled by several key drivers. The escalating volume of medical imaging data, driven by an aging population and the increasing use of advanced imaging techniques, necessitates efficient management and sharing solutions. The growing demand for interoperability between disparate healthcare IT systems, including EHRs, is a critical catalyst, enabling a holistic view of patient care. Furthermore, the push for value-based healthcare and improved patient outcomes encourages the adoption of solutions that facilitate seamless collaboration among healthcare providers. Technological advancements, particularly in cloud computing and AI, are opening new avenues for innovation and efficiency.
Key challenges and restraints within the industry include the high initial implementation costs of advanced imaging exchange systems, which can be a barrier for smaller healthcare facilities. Stringent data security and privacy regulations, such as HIPAA and GDPR, while essential, add complexity to system design and compliance. Interoperability challenges persist, with many legacy systems lacking seamless integration capabilities. The shortage of skilled IT professionals capable of managing and maintaining these complex systems also presents a significant hurdle. Competitive pressures from established vendors and emerging disruptive technologies necessitate continuous innovation and adaptation.
Emerging Opportunities in Medical Image Exchange Systems Industry
Emerging opportunities in the Medical Image Exchange Systems industry lie in the expansion of AI-driven diagnostic tools integrated directly into exchange platforms, offering real-time insights and decision support. The growing demand for remote patient monitoring and telehealth services presents a significant opportunity for secure, cloud-based image sharing solutions that facilitate remote consultations and diagnostics. Furthermore, the untapped market potential in developing economies, where healthcare infrastructure is rapidly evolving, offers substantial growth prospects. The development of specialized exchange solutions for niche medical specialties, such as ophthalmology or dermatology, also represents a promising avenue for innovation.
Growth Accelerators in the Medical Image Exchange Systems Industry Industry
Growth in the Medical Image Exchange Systems industry is being significantly accelerated by strategic partnerships between technology providers and healthcare institutions, fostering the development and adoption of tailored solutions. The ongoing advancements in AI and machine learning are providing powerful tools for image analysis, workflow optimization, and predictive diagnostics, making these systems more indispensable. Market expansion into underserved regions, driven by government initiatives and increasing healthcare investments, is another crucial growth accelerator. The continuous development of cloud-native solutions, offering enhanced scalability, accessibility, and cost-effectiveness, is further fueling market expansion and adoption rates.
Key Players Shaping the Medical Image Exchange Systems Industry Market
- IBM Corporation
- Siemens Healthineers
- GE Healthcare
- Dell Technologies Inc
- Lexmark International Inc
- BridgeHead Software
- Koninklijke Philips NV
- Carestream Health Inc (Onex Corporation)
- McKesson Corporation
- Novarad Corporation
- Agfa-Gevaert Group
- Fujifilm Holdings Corporation
Notable Milestones in Medical Image Exchange Systems Industry Sector
- March 2022: Intelerad Medical Systems launched its new Enterprise Imaging and Informatics Suite at the 2022 HIMSS Global Health Conference & Exhibition. This suite empowers hospitals and health systems to break down siloed data and create a seamless, vendor-neutral information hub, integrating vital patient data across the entire healthcare ecosystem.
- March 2022: Philips introduced cloud-enabled enterprise imaging informatics and analytics solutions. Philips Health Suite Interoperability is a fully integrated cloud-enabled Health IT platform to meet diverse workflow needs across the imaging enterprise.
In-Depth Medical Image Exchange Systems Industry Market Outlook
The Medical Image Exchange Systems market outlook is exceptionally positive, driven by the relentless pursuit of enhanced patient care and operational efficiency in healthcare. Future growth will be significantly boosted by the deeper integration of AI for advanced image analysis and predictive diagnostics, moving beyond simple storage and retrieval. The widespread adoption of cloud-based solutions will continue to democratize access to sophisticated imaging informatics for a broader range of healthcare providers. Strategic collaborations and partnerships between technology vendors and healthcare organizations will be instrumental in developing and deploying innovative, patient-centric solutions. The increasing focus on interoperability and data standardization will pave the way for more seamless integration with the broader healthcare IT ecosystem, ultimately leading to a more connected and effective healthcare future.
Medical Image Exchange Systems Industry Segmentation
-
1. System
- 1.1. Vendor Neutral Archive
- 1.2. Picture Archiving and Communications System (PACS)
- 1.3. Other Systems
-
2. End-User
- 2.1. Hospitals
- 2.2. Diagnostic Centers
- 2.3. Ambulatory Surgery Centers
Medical Image Exchange Systems Industry Segmentation By Geography
-
1. North America
- 1.1. United States
- 1.2. Canada
- 1.3. Mexico
-
2. Europe
- 2.1. Germany
- 2.2. United Kingdom
- 2.3. France
- 2.4. Italy
- 2.5. Spain
- 2.6. Rest of Europe
-
3. Asia Pacific
- 3.1. China
- 3.2. Japan
- 3.3. India
- 3.4. Australia
- 3.5. South Korea
- 3.6. Rest of Asia Pacific
-
4. Middle East and Africa
- 4.1. GCC
- 4.2. South Africa
- 4.3. Rest of Middle East and Africa
-
5. South America
- 5.1. Brazil
- 5.2. Argentina
- 5.3. Rest of South America

Medical Image Exchange Systems Industry Regional Market Share
Geographic Coverage of Medical Image Exchange Systems Industry
Medical Image Exchange Systems Industry REPORT HIGHLIGHTS
| Aspects | Details |
|---|---|
| Study Period | 2020-2034 |
| Base Year | 2025 |
| Estimated Year | 2026 |
| Forecast Period | 2026-2034 |
| Historical Period | 2020-2025 |
| Growth Rate | CAGR of 6.96% from 2020-2034 |
| Segmentation |
|
Table of Contents
- 1. Introduction
- 1.1. Research Scope
- 1.2. Market Segmentation
- 1.3. Research Objective
- 1.4. Definitions and Assumptions
- 2. Executive Summary
- 2.1. Market Snapshot
- 3. Market Dynamics
- 3.1. Market Drivers
- 3.2. Market Restrains
- 3.3. Market Trends
- 3.4. Market Opportunities
- 4. Market Factor Analysis
- 4.1. Porters Five Forces
- 4.1.1. Bargaining Power of Suppliers
- 4.1.2. Bargaining Power of Buyers
- 4.1.3. Threat of New Entrants
- 4.1.4. Threat of Substitutes
- 4.1.5. Competitive Rivalry
- 4.2. PESTEL analysis
- 4.3. BCG Analysis
- 4.3.1. Stars (High Growth, High Market Share)
- 4.3.2. Cash Cows (Low Growth, High Market Share)
- 4.3.3. Question Mark (High Growth, Low Market Share)
- 4.3.4. Dogs (Low Growth, Low Market Share)
- 4.4. Ansoff Matrix Analysis
- 4.5. Supply Chain Analysis
- 4.6. Regulatory Landscape
- 4.7. Current Market Potential and Opportunity Assessment (TAM–SAM–SOM Framework)
- 4.8. VDR Analyst Note
- 4.1. Porters Five Forces
- 5. Market Analysis, Insights and Forecast 2021-2033
- 5.1. Market Analysis, Insights and Forecast - by System
- 5.1.1. Vendor Neutral Archive
- 5.1.2. Picture Archiving and Communications System (PACS)
- 5.1.3. Other Systems
- 5.2. Market Analysis, Insights and Forecast - by End-User
- 5.2.1. Hospitals
- 5.2.2. Diagnostic Centers
- 5.2.3. Ambulatory Surgery Centers
- 5.3. Market Analysis, Insights and Forecast - by Region
- 5.3.1. North America
- 5.3.2. Europe
- 5.3.3. Asia Pacific
- 5.3.4. Middle East and Africa
- 5.3.5. South America
- 5.1. Market Analysis, Insights and Forecast - by System
- 6. Global Medical Image Exchange Systems Industry Analysis, Insights and Forecast, 2021-2033
- 6.1. Market Analysis, Insights and Forecast - by System
- 6.1.1. Vendor Neutral Archive
- 6.1.2. Picture Archiving and Communications System (PACS)
- 6.1.3. Other Systems
- 6.2. Market Analysis, Insights and Forecast - by End-User
- 6.2.1. Hospitals
- 6.2.2. Diagnostic Centers
- 6.2.3. Ambulatory Surgery Centers
- 6.1. Market Analysis, Insights and Forecast - by System
- 7. North America Medical Image Exchange Systems Industry Analysis, Insights and Forecast, 2021-2033
- 7.1. Market Analysis, Insights and Forecast - by System
- 7.1.1. Vendor Neutral Archive
- 7.1.2. Picture Archiving and Communications System (PACS)
- 7.1.3. Other Systems
- 7.2. Market Analysis, Insights and Forecast - by End-User
- 7.2.1. Hospitals
- 7.2.2. Diagnostic Centers
- 7.2.3. Ambulatory Surgery Centers
- 7.1. Market Analysis, Insights and Forecast - by System
- 8. Europe Medical Image Exchange Systems Industry Analysis, Insights and Forecast, 2021-2033
- 8.1. Market Analysis, Insights and Forecast - by System
- 8.1.1. Vendor Neutral Archive
- 8.1.2. Picture Archiving and Communications System (PACS)
- 8.1.3. Other Systems
- 8.2. Market Analysis, Insights and Forecast - by End-User
- 8.2.1. Hospitals
- 8.2.2. Diagnostic Centers
- 8.2.3. Ambulatory Surgery Centers
- 8.1. Market Analysis, Insights and Forecast - by System
- 9. Asia Pacific Medical Image Exchange Systems Industry Analysis, Insights and Forecast, 2021-2033
- 9.1. Market Analysis, Insights and Forecast - by System
- 9.1.1. Vendor Neutral Archive
- 9.1.2. Picture Archiving and Communications System (PACS)
- 9.1.3. Other Systems
- 9.2. Market Analysis, Insights and Forecast - by End-User
- 9.2.1. Hospitals
- 9.2.2. Diagnostic Centers
- 9.2.3. Ambulatory Surgery Centers
- 9.1. Market Analysis, Insights and Forecast - by System
- 10. Middle East and Africa Medical Image Exchange Systems Industry Analysis, Insights and Forecast, 2021-2033
- 10.1. Market Analysis, Insights and Forecast - by System
- 10.1.1. Vendor Neutral Archive
- 10.1.2. Picture Archiving and Communications System (PACS)
- 10.1.3. Other Systems
- 10.2. Market Analysis, Insights and Forecast - by End-User
- 10.2.1. Hospitals
- 10.2.2. Diagnostic Centers
- 10.2.3. Ambulatory Surgery Centers
- 10.1. Market Analysis, Insights and Forecast - by System
- 11. South America Medical Image Exchange Systems Industry Analysis, Insights and Forecast, 2021-2033
- 11.1. Market Analysis, Insights and Forecast - by System
- 11.1.1. Vendor Neutral Archive
- 11.1.2. Picture Archiving and Communications System (PACS)
- 11.1.3. Other Systems
- 11.2. Market Analysis, Insights and Forecast - by End-User
- 11.2.1. Hospitals
- 11.2.2. Diagnostic Centers
- 11.2.3. Ambulatory Surgery Centers
- 11.1. Market Analysis, Insights and Forecast - by System
- 12. Competitive Analysis
- 12.1. Company Profiles
- 12.1.1 IBM Corporation
- 12.1.1.1. Company Overview
- 12.1.1.2. Products
- 12.1.1.3. Company Financials
- 12.1.1.4. SWOT Analysis
- 12.1.2 Siemens Healthineers
- 12.1.2.1. Company Overview
- 12.1.2.2. Products
- 12.1.2.3. Company Financials
- 12.1.2.4. SWOT Analysis
- 12.1.3 GE Healthcare
- 12.1.3.1. Company Overview
- 12.1.3.2. Products
- 12.1.3.3. Company Financials
- 12.1.3.4. SWOT Analysis
- 12.1.4 Dell Technologies Inc
- 12.1.4.1. Company Overview
- 12.1.4.2. Products
- 12.1.4.3. Company Financials
- 12.1.4.4. SWOT Analysis
- 12.1.5 Lexmark International Inc
- 12.1.5.1. Company Overview
- 12.1.5.2. Products
- 12.1.5.3. Company Financials
- 12.1.5.4. SWOT Analysis
- 12.1.6 BridgeHead Software
- 12.1.6.1. Company Overview
- 12.1.6.2. Products
- 12.1.6.3. Company Financials
- 12.1.6.4. SWOT Analysis
- 12.1.7 Koninklijke Philips NV
- 12.1.7.1. Company Overview
- 12.1.7.2. Products
- 12.1.7.3. Company Financials
- 12.1.7.4. SWOT Analysis
- 12.1.8 Carestream Health Inc (Onex Corporation)
- 12.1.8.1. Company Overview
- 12.1.8.2. Products
- 12.1.8.3. Company Financials
- 12.1.8.4. SWOT Analysis
- 12.1.9 McKesson Corporation
- 12.1.9.1. Company Overview
- 12.1.9.2. Products
- 12.1.9.3. Company Financials
- 12.1.9.4. SWOT Analysis
- 12.1.10 Novarad Corporation
- 12.1.10.1. Company Overview
- 12.1.10.2. Products
- 12.1.10.3. Company Financials
- 12.1.10.4. SWOT Analysis
- 12.1.11 Agfa-Gevaert Group
- 12.1.11.1. Company Overview
- 12.1.11.2. Products
- 12.1.11.3. Company Financials
- 12.1.11.4. SWOT Analysis
- 12.1.12 Fujifilm Holdings Corporation
- 12.1.12.1. Company Overview
- 12.1.12.2. Products
- 12.1.12.3. Company Financials
- 12.1.12.4. SWOT Analysis
- 12.1.1 IBM Corporation
- 12.2. Market Entropy
- 12.2.1 Company's Key Areas Served
- 12.2.2 Recent Developments
- 12.3. Company Market Share Analysis 2025
- 12.3.1 Top 5 Companies Market Share Analysis
- 12.3.2 Top 3 Companies Market Share Analysis
- 12.4. List of Potential Customers
- 13. Research Methodology
List of Figures
- Figure 1: Global Medical Image Exchange Systems Industry Revenue Breakdown (Million, %) by Region 2025 & 2033
- Figure 2: Global Medical Image Exchange Systems Industry Volume Breakdown (K Unit, %) by Region 2025 & 2033
- Figure 3: North America Medical Image Exchange Systems Industry Revenue (Million), by System 2025 & 2033
- Figure 4: North America Medical Image Exchange Systems Industry Volume (K Unit), by System 2025 & 2033
- Figure 5: North America Medical Image Exchange Systems Industry Revenue Share (%), by System 2025 & 2033
- Figure 6: North America Medical Image Exchange Systems Industry Volume Share (%), by System 2025 & 2033
- Figure 7: North America Medical Image Exchange Systems Industry Revenue (Million), by End-User 2025 & 2033
- Figure 8: North America Medical Image Exchange Systems Industry Volume (K Unit), by End-User 2025 & 2033
- Figure 9: North America Medical Image Exchange Systems Industry Revenue Share (%), by End-User 2025 & 2033
- Figure 10: North America Medical Image Exchange Systems Industry Volume Share (%), by End-User 2025 & 2033
- Figure 11: North America Medical Image Exchange Systems Industry Revenue (Million), by Country 2025 & 2033
- Figure 12: North America Medical Image Exchange Systems Industry Volume (K Unit), by Country 2025 & 2033
- Figure 13: North America Medical Image Exchange Systems Industry Revenue Share (%), by Country 2025 & 2033
- Figure 14: North America Medical Image Exchange Systems Industry Volume Share (%), by Country 2025 & 2033
- Figure 15: Europe Medical Image Exchange Systems Industry Revenue (Million), by System 2025 & 2033
- Figure 16: Europe Medical Image Exchange Systems Industry Volume (K Unit), by System 2025 & 2033
- Figure 17: Europe Medical Image Exchange Systems Industry Revenue Share (%), by System 2025 & 2033
- Figure 18: Europe Medical Image Exchange Systems Industry Volume Share (%), by System 2025 & 2033
- Figure 19: Europe Medical Image Exchange Systems Industry Revenue (Million), by End-User 2025 & 2033
- Figure 20: Europe Medical Image Exchange Systems Industry Volume (K Unit), by End-User 2025 & 2033
- Figure 21: Europe Medical Image Exchange Systems Industry Revenue Share (%), by End-User 2025 & 2033
- Figure 22: Europe Medical Image Exchange Systems Industry Volume Share (%), by End-User 2025 & 2033
- Figure 23: Europe Medical Image Exchange Systems Industry Revenue (Million), by Country 2025 & 2033
- Figure 24: Europe Medical Image Exchange Systems Industry Volume (K Unit), by Country 2025 & 2033
- Figure 25: Europe Medical Image Exchange Systems Industry Revenue Share (%), by Country 2025 & 2033
- Figure 26: Europe Medical Image Exchange Systems Industry Volume Share (%), by Country 2025 & 2033
- Figure 27: Asia Pacific Medical Image Exchange Systems Industry Revenue (Million), by System 2025 & 2033
- Figure 28: Asia Pacific Medical Image Exchange Systems Industry Volume (K Unit), by System 2025 & 2033
- Figure 29: Asia Pacific Medical Image Exchange Systems Industry Revenue Share (%), by System 2025 & 2033
- Figure 30: Asia Pacific Medical Image Exchange Systems Industry Volume Share (%), by System 2025 & 2033
- Figure 31: Asia Pacific Medical Image Exchange Systems Industry Revenue (Million), by End-User 2025 & 2033
- Figure 32: Asia Pacific Medical Image Exchange Systems Industry Volume (K Unit), by End-User 2025 & 2033
- Figure 33: Asia Pacific Medical Image Exchange Systems Industry Revenue Share (%), by End-User 2025 & 2033
- Figure 34: Asia Pacific Medical Image Exchange Systems Industry Volume Share (%), by End-User 2025 & 2033
- Figure 35: Asia Pacific Medical Image Exchange Systems Industry Revenue (Million), by Country 2025 & 2033
- Figure 36: Asia Pacific Medical Image Exchange Systems Industry Volume (K Unit), by Country 2025 & 2033
- Figure 37: Asia Pacific Medical Image Exchange Systems Industry Revenue Share (%), by Country 2025 & 2033
- Figure 38: Asia Pacific Medical Image Exchange Systems Industry Volume Share (%), by Country 2025 & 2033
- Figure 39: Middle East and Africa Medical Image Exchange Systems Industry Revenue (Million), by System 2025 & 2033
- Figure 40: Middle East and Africa Medical Image Exchange Systems Industry Volume (K Unit), by System 2025 & 2033
- Figure 41: Middle East and Africa Medical Image Exchange Systems Industry Revenue Share (%), by System 2025 & 2033
- Figure 42: Middle East and Africa Medical Image Exchange Systems Industry Volume Share (%), by System 2025 & 2033
- Figure 43: Middle East and Africa Medical Image Exchange Systems Industry Revenue (Million), by End-User 2025 & 2033
- Figure 44: Middle East and Africa Medical Image Exchange Systems Industry Volume (K Unit), by End-User 2025 & 2033
- Figure 45: Middle East and Africa Medical Image Exchange Systems Industry Revenue Share (%), by End-User 2025 & 2033
- Figure 46: Middle East and Africa Medical Image Exchange Systems Industry Volume Share (%), by End-User 2025 & 2033
- Figure 47: Middle East and Africa Medical Image Exchange Systems Industry Revenue (Million), by Country 2025 & 2033
- Figure 48: Middle East and Africa Medical Image Exchange Systems Industry Volume (K Unit), by Country 2025 & 2033
- Figure 49: Middle East and Africa Medical Image Exchange Systems Industry Revenue Share (%), by Country 2025 & 2033
- Figure 50: Middle East and Africa Medical Image Exchange Systems Industry Volume Share (%), by Country 2025 & 2033
- Figure 51: South America Medical Image Exchange Systems Industry Revenue (Million), by System 2025 & 2033
- Figure 52: South America Medical Image Exchange Systems Industry Volume (K Unit), by System 2025 & 2033
- Figure 53: South America Medical Image Exchange Systems Industry Revenue Share (%), by System 2025 & 2033
- Figure 54: South America Medical Image Exchange Systems Industry Volume Share (%), by System 2025 & 2033
- Figure 55: South America Medical Image Exchange Systems Industry Revenue (Million), by End-User 2025 & 2033
- Figure 56: South America Medical Image Exchange Systems Industry Volume (K Unit), by End-User 2025 & 2033
- Figure 57: South America Medical Image Exchange Systems Industry Revenue Share (%), by End-User 2025 & 2033
- Figure 58: South America Medical Image Exchange Systems Industry Volume Share (%), by End-User 2025 & 2033
- Figure 59: South America Medical Image Exchange Systems Industry Revenue (Million), by Country 2025 & 2033
- Figure 60: South America Medical Image Exchange Systems Industry Volume (K Unit), by Country 2025 & 2033
- Figure 61: South America Medical Image Exchange Systems Industry Revenue Share (%), by Country 2025 & 2033
- Figure 62: South America Medical Image Exchange Systems Industry Volume Share (%), by Country 2025 & 2033
List of Tables
- Table 1: Global Medical Image Exchange Systems Industry Revenue Million Forecast, by System 2020 & 2033
- Table 2: Global Medical Image Exchange Systems Industry Volume K Unit Forecast, by System 2020 & 2033
- Table 3: Global Medical Image Exchange Systems Industry Revenue Million Forecast, by End-User 2020 & 2033
- Table 4: Global Medical Image Exchange Systems Industry Volume K Unit Forecast, by End-User 2020 & 2033
- Table 5: Global Medical Image Exchange Systems Industry Revenue Million Forecast, by Region 2020 & 2033
- Table 6: Global Medical Image Exchange Systems Industry Volume K Unit Forecast, by Region 2020 & 2033
- Table 7: Global Medical Image Exchange Systems Industry Revenue Million Forecast, by System 2020 & 2033
- Table 8: Global Medical Image Exchange Systems Industry Volume K Unit Forecast, by System 2020 & 2033
- Table 9: Global Medical Image Exchange Systems Industry Revenue Million Forecast, by End-User 2020 & 2033
- Table 10: Global Medical Image Exchange Systems Industry Volume K Unit Forecast, by End-User 2020 & 2033
- Table 11: Global Medical Image Exchange Systems Industry Revenue Million Forecast, by Country 2020 & 2033
- Table 12: Global Medical Image Exchange Systems Industry Volume K Unit Forecast, by Country 2020 & 2033
- Table 13: United States Medical Image Exchange Systems Industry Revenue (Million) Forecast, by Application 2020 & 2033
- Table 14: United States Medical Image Exchange Systems Industry Volume (K Unit) Forecast, by Application 2020 & 2033
- Table 15: Canada Medical Image Exchange Systems Industry Revenue (Million) Forecast, by Application 2020 & 2033
- Table 16: Canada Medical Image Exchange Systems Industry Volume (K Unit) Forecast, by Application 2020 & 2033
- Table 17: Mexico Medical Image Exchange Systems Industry Revenue (Million) Forecast, by Application 2020 & 2033
- Table 18: Mexico Medical Image Exchange Systems Industry Volume (K Unit) Forecast, by Application 2020 & 2033
- Table 19: Global Medical Image Exchange Systems Industry Revenue Million Forecast, by System 2020 & 2033
- Table 20: Global Medical Image Exchange Systems Industry Volume K Unit Forecast, by System 2020 & 2033
- Table 21: Global Medical Image Exchange Systems Industry Revenue Million Forecast, by End-User 2020 & 2033
- Table 22: Global Medical Image Exchange Systems Industry Volume K Unit Forecast, by End-User 2020 & 2033
- Table 23: Global Medical Image Exchange Systems Industry Revenue Million Forecast, by Country 2020 & 2033
- Table 24: Global Medical Image Exchange Systems Industry Volume K Unit Forecast, by Country 2020 & 2033
- Table 25: Germany Medical Image Exchange Systems Industry Revenue (Million) Forecast, by Application 2020 & 2033
- Table 26: Germany Medical Image Exchange Systems Industry Volume (K Unit) Forecast, by Application 2020 & 2033
- Table 27: United Kingdom Medical Image Exchange Systems Industry Revenue (Million) Forecast, by Application 2020 & 2033
- Table 28: United Kingdom Medical Image Exchange Systems Industry Volume (K Unit) Forecast, by Application 2020 & 2033
- Table 29: France Medical Image Exchange Systems Industry Revenue (Million) Forecast, by Application 2020 & 2033
- Table 30: France Medical Image Exchange Systems Industry Volume (K Unit) Forecast, by Application 2020 & 2033
- Table 31: Italy Medical Image Exchange Systems Industry Revenue (Million) Forecast, by Application 2020 & 2033
- Table 32: Italy Medical Image Exchange Systems Industry Volume (K Unit) Forecast, by Application 2020 & 2033
- Table 33: Spain Medical Image Exchange Systems Industry Revenue (Million) Forecast, by Application 2020 & 2033
- Table 34: Spain Medical Image Exchange Systems Industry Volume (K Unit) Forecast, by Application 2020 & 2033
- Table 35: Rest of Europe Medical Image Exchange Systems Industry Revenue (Million) Forecast, by Application 2020 & 2033
- Table 36: Rest of Europe Medical Image Exchange Systems Industry Volume (K Unit) Forecast, by Application 2020 & 2033
- Table 37: Global Medical Image Exchange Systems Industry Revenue Million Forecast, by System 2020 & 2033
- Table 38: Global Medical Image Exchange Systems Industry Volume K Unit Forecast, by System 2020 & 2033
- Table 39: Global Medical Image Exchange Systems Industry Revenue Million Forecast, by End-User 2020 & 2033
- Table 40: Global Medical Image Exchange Systems Industry Volume K Unit Forecast, by End-User 2020 & 2033
- Table 41: Global Medical Image Exchange Systems Industry Revenue Million Forecast, by Country 2020 & 2033
- Table 42: Global Medical Image Exchange Systems Industry Volume K Unit Forecast, by Country 2020 & 2033
- Table 43: China Medical Image Exchange Systems Industry Revenue (Million) Forecast, by Application 2020 & 2033
- Table 44: China Medical Image Exchange Systems Industry Volume (K Unit) Forecast, by Application 2020 & 2033
- Table 45: Japan Medical Image Exchange Systems Industry Revenue (Million) Forecast, by Application 2020 & 2033
- Table 46: Japan Medical Image Exchange Systems Industry Volume (K Unit) Forecast, by Application 2020 & 2033
- Table 47: India Medical Image Exchange Systems Industry Revenue (Million) Forecast, by Application 2020 & 2033
- Table 48: India Medical Image Exchange Systems Industry Volume (K Unit) Forecast, by Application 2020 & 2033
- Table 49: Australia Medical Image Exchange Systems Industry Revenue (Million) Forecast, by Application 2020 & 2033
- Table 50: Australia Medical Image Exchange Systems Industry Volume (K Unit) Forecast, by Application 2020 & 2033
- Table 51: South Korea Medical Image Exchange Systems Industry Revenue (Million) Forecast, by Application 2020 & 2033
- Table 52: South Korea Medical Image Exchange Systems Industry Volume (K Unit) Forecast, by Application 2020 & 2033
- Table 53: Rest of Asia Pacific Medical Image Exchange Systems Industry Revenue (Million) Forecast, by Application 2020 & 2033
- Table 54: Rest of Asia Pacific Medical Image Exchange Systems Industry Volume (K Unit) Forecast, by Application 2020 & 2033
- Table 55: Global Medical Image Exchange Systems Industry Revenue Million Forecast, by System 2020 & 2033
- Table 56: Global Medical Image Exchange Systems Industry Volume K Unit Forecast, by System 2020 & 2033
- Table 57: Global Medical Image Exchange Systems Industry Revenue Million Forecast, by End-User 2020 & 2033
- Table 58: Global Medical Image Exchange Systems Industry Volume K Unit Forecast, by End-User 2020 & 2033
- Table 59: Global Medical Image Exchange Systems Industry Revenue Million Forecast, by Country 2020 & 2033
- Table 60: Global Medical Image Exchange Systems Industry Volume K Unit Forecast, by Country 2020 & 2033
- Table 61: GCC Medical Image Exchange Systems Industry Revenue (Million) Forecast, by Application 2020 & 2033
- Table 62: GCC Medical Image Exchange Systems Industry Volume (K Unit) Forecast, by Application 2020 & 2033
- Table 63: South Africa Medical Image Exchange Systems Industry Revenue (Million) Forecast, by Application 2020 & 2033
- Table 64: South Africa Medical Image Exchange Systems Industry Volume (K Unit) Forecast, by Application 2020 & 2033
- Table 65: Rest of Middle East and Africa Medical Image Exchange Systems Industry Revenue (Million) Forecast, by Application 2020 & 2033
- Table 66: Rest of Middle East and Africa Medical Image Exchange Systems Industry Volume (K Unit) Forecast, by Application 2020 & 2033
- Table 67: Global Medical Image Exchange Systems Industry Revenue Million Forecast, by System 2020 & 2033
- Table 68: Global Medical Image Exchange Systems Industry Volume K Unit Forecast, by System 2020 & 2033
- Table 69: Global Medical Image Exchange Systems Industry Revenue Million Forecast, by End-User 2020 & 2033
- Table 70: Global Medical Image Exchange Systems Industry Volume K Unit Forecast, by End-User 2020 & 2033
- Table 71: Global Medical Image Exchange Systems Industry Revenue Million Forecast, by Country 2020 & 2033
- Table 72: Global Medical Image Exchange Systems Industry Volume K Unit Forecast, by Country 2020 & 2033
- Table 73: Brazil Medical Image Exchange Systems Industry Revenue (Million) Forecast, by Application 2020 & 2033
- Table 74: Brazil Medical Image Exchange Systems Industry Volume (K Unit) Forecast, by Application 2020 & 2033
- Table 75: Argentina Medical Image Exchange Systems Industry Revenue (Million) Forecast, by Application 2020 & 2033
- Table 76: Argentina Medical Image Exchange Systems Industry Volume (K Unit) Forecast, by Application 2020 & 2033
- Table 77: Rest of South America Medical Image Exchange Systems Industry Revenue (Million) Forecast, by Application 2020 & 2033
- Table 78: Rest of South America Medical Image Exchange Systems Industry Volume (K Unit) Forecast, by Application 2020 & 2033
Frequently Asked Questions
1. What is the projected Compound Annual Growth Rate (CAGR) of the Medical Image Exchange Systems Industry?
The projected CAGR is approximately 6.96%.
2. Which companies are prominent players in the Medical Image Exchange Systems Industry?
Key companies in the market include IBM Corporation, Siemens Healthineers, GE Healthcare, Dell Technologies Inc , Lexmark International Inc, BridgeHead Software, Koninklijke Philips NV, Carestream Health Inc (Onex Corporation), McKesson Corporation, Novarad Corporation, Agfa-Gevaert Group, Fujifilm Holdings Corporation.
3. What are the main segments of the Medical Image Exchange Systems Industry?
The market segments include System, End-User.
4. Can you provide details about the market size?
The market size is estimated to be USD 4.59 Million as of 2022.
5. What are some drivers contributing to market growth?
Technological Innovations in the Diagnostic Imaging and Image Management; Rising Prevalence of Chronic Diseases; Emergence of Big Data in Healthcare.
6. What are the notable trends driving market growth?
Picture Archiving and Communications Systems (PACS) is Expected to Record Notable CAGR in the Market During the Forecast Period.
7. Are there any restraints impacting market growth?
Cost Associated With Implementation of Medical Imaging Management Solutions; Decrease In the Supply of SPECT and PET Systems due to the Shortage of Radioisotopes.
8. Can you provide examples of recent developments in the market?
March 2022: Intelerad Medical Systems launched its new Enterprise Imaging and Informatics Suite at the 2022 HIMSS Global Health Conference & Exhibition. Intelerad's suite empowers hospitals and health systems to break down siloed data and create a seamless, vendor-neutral information hub, integrating vital patient data across the entire healthcare ecosystem.
9. What pricing options are available for accessing the report?
Pricing options include single-user, multi-user, and enterprise licenses priced at USD 4750, USD 5250, and USD 8750 respectively.
10. Is the market size provided in terms of value or volume?
The market size is provided in terms of value, measured in Million and volume, measured in K Unit.
11. Are there any specific market keywords associated with the report?
Yes, the market keyword associated with the report is "Medical Image Exchange Systems Industry," which aids in identifying and referencing the specific market segment covered.
12. How do I determine which pricing option suits my needs best?
The pricing options vary based on user requirements and access needs. Individual users may opt for single-user licenses, while businesses requiring broader access may choose multi-user or enterprise licenses for cost-effective access to the report.
13. Are there any additional resources or data provided in the Medical Image Exchange Systems Industry report?
While the report offers comprehensive insights, it's advisable to review the specific contents or supplementary materials provided to ascertain if additional resources or data are available.
14. How can I stay updated on further developments or reports in the Medical Image Exchange Systems Industry?
To stay informed about further developments, trends, and reports in the Medical Image Exchange Systems Industry, consider subscribing to industry newsletters, following relevant companies and organizations, or regularly checking reputable industry news sources and publications.
Methodology
Step 1 - Identification of Relevant Samples Size from Population Database


Step 2 - Approaches for Defining Global Market Size (Value, Volume* & Price*)

Note*: In applicable scenarios
Step 3 - Data Sources
Primary Research
- Web Analytics
- Survey Reports
- Research Institute
- Latest Research Reports
- Opinion Leaders
Secondary Research
- Annual Reports
- White Paper
- Latest Press Release
- Industry Association
- Paid Database
- Investor Presentations

Step 4 - Data Triangulation
Involves using different sources of information in order to increase the validity of a study
These sources are likely to be stakeholders in a program - participants, other researchers, program staff, other community members, and so on.
Then we put all data in single framework & apply various statistical tools to find out the dynamic on the market.
During the analysis stage, feedback from the stakeholder groups would be compared to determine areas of agreement as well as areas of divergence