
Key Insights
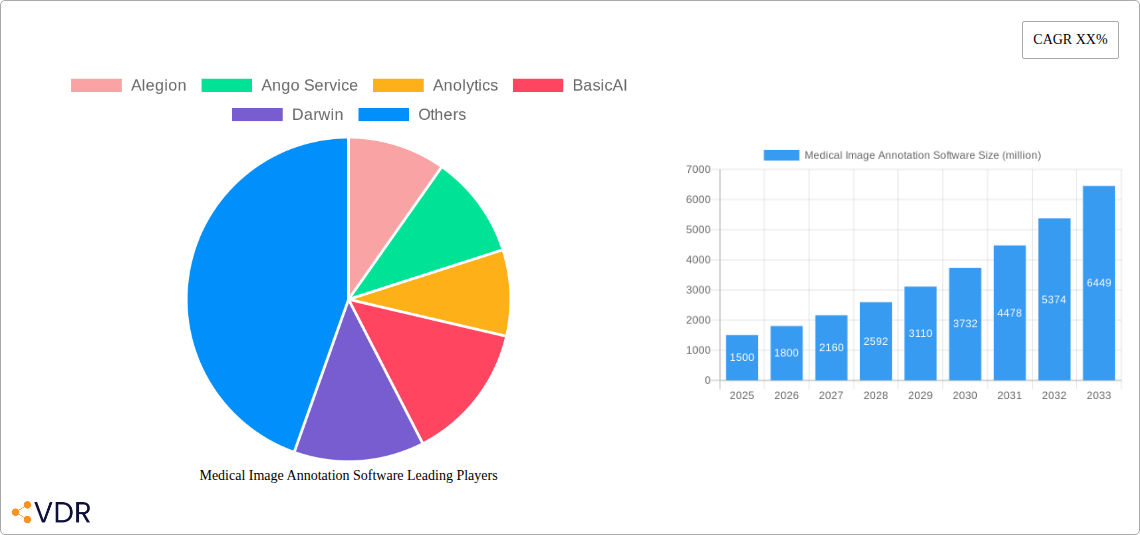
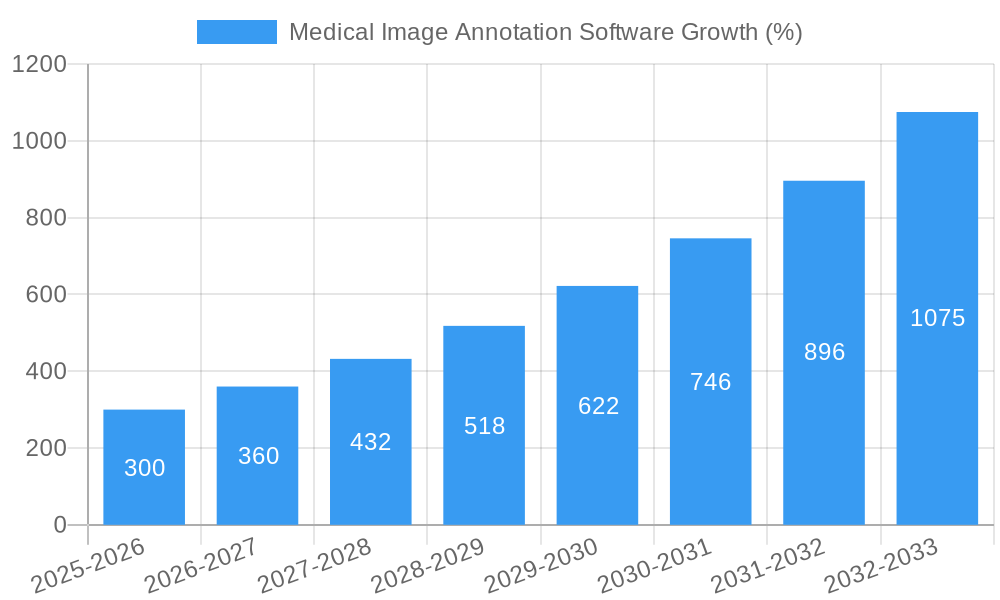
The medical image annotation software market is experiencing robust growth, driven by the increasing adoption of artificial intelligence (AI) in healthcare and the rising demand for accurate and efficient medical image analysis. The market, estimated at $1.5 billion in 2025, is projected to exhibit a Compound Annual Growth Rate (CAGR) of 20% from 2025 to 2033, reaching approximately $7 billion by 2033. This expansion is fueled by several key factors, including the growing availability of medical images (due to increased diagnostic testing and imaging procedures), the need for faster and more accurate diagnoses to improve patient outcomes, and the development of sophisticated AI algorithms requiring high-quality annotated data. The market is segmented by software type (e.g., 2D, 3D annotation tools), application (e.g., radiology, pathology, oncology), and deployment model (cloud-based, on-premise). Leading players like Alegion, Labelbox, and others are constantly innovating to provide comprehensive solutions encompassing various annotation types (bounding boxes, polygons, semantic segmentation) and supporting diverse medical image modalities (CT scans, MRI, X-rays). The market faces challenges such as the high cost of annotation and the need for specialized expertise in both medical imaging and data annotation.
Despite these challenges, the long-term outlook remains exceptionally positive. The increasing adoption of telemedicine and remote diagnostics will further fuel market growth, as will the growing interest in personalized medicine and the need for large, high-quality datasets for training AI models. The competitive landscape is dynamic, with both established players and new entrants continuously striving to enhance their offerings with features like automated annotation tools, collaborative platforms, and robust data security measures. This market's expansion is crucial for accelerating progress in AI-driven healthcare, enabling the development of more effective diagnostic tools and ultimately leading to improved patient care. Future growth will likely depend on advancements in annotation technology, greater accessibility and affordability, and the continued integration of AI into clinical workflows.
Medical Image Annotation Software Market Report: 2019-2033
This comprehensive report provides a detailed analysis of the Medical Image Annotation Software market, encompassing market dynamics, growth trends, regional segmentation, competitive landscape, and future outlook. The study period covers 2019-2033, with 2025 as the base and estimated year. The forecast period is 2025-2033, and the historical period is 2019-2024. The market is segmented by various factors (details within the report) and includes a comprehensive analysis of key players such as Alegion, Ango Service, Anolytics, BasicAI, Darwin, Encord, ImFusion Labels, Keylabs, Keymakr, Kili Technology, Labelbox, RedBrick AI, and V7. This report is crucial for investors, stakeholders, and industry professionals seeking to understand and capitalize on the growth opportunities within this rapidly expanding market. The total market size is projected to reach xx million by 2033.
Medical Image Annotation Software Market Dynamics & Structure
The Medical Image Annotation Software market, a sub-segment of the broader Artificial Intelligence (AI) in Healthcare market (parent market), is characterized by a moderately fragmented structure with several key players vying for market share. Technological innovation, particularly in deep learning and computer vision, is a primary driver of growth. Stringent regulatory frameworks governing medical data privacy (e.g., HIPAA) and software validation pose significant challenges, impacting market entry and adoption. The market experiences considerable competition from traditional manual annotation services, creating a substitute effect. The end-user demographic primarily includes hospitals, radiology clinics, pharmaceutical companies, and medical research institutions. M&A activity remains moderate, with approximately xx deals recorded during the historical period (2019-2024), suggesting a consolidating market trend.
- Market Concentration: Moderately fragmented, with no single dominant player holding more than xx% market share in 2025.
- Technological Innovation: Deep learning, computer vision, and automated annotation tools are key drivers.
- Regulatory Frameworks: HIPAA compliance and FDA approvals are major hurdles to market entry.
- Competitive Substitutes: Manual annotation services pose a significant competitive challenge.
- End-User Demographics: Hospitals, clinics, pharmaceutical companies, and research institutions are primary users.
- M&A Trends: Approximately xx M&A deals occurred between 2019 and 2024, indicating a trend towards consolidation.
Medical Image Annotation Software Growth Trends & Insights
The Medical Image Annotation Software market has witnessed significant growth over the historical period, driven by increasing adoption of AI in healthcare and the rising volume of medical images generated globally. The market size is estimated to be xx million in 2025, expanding at a CAGR of xx% during the forecast period (2025-2033). This growth is fueled by the rising demand for accurate and efficient medical image analysis, enabling faster diagnosis and improved treatment outcomes. Technological disruptions, such as the development of automated annotation tools and advancements in deep learning algorithms, are accelerating market adoption. A shift towards cloud-based solutions and increased investment in AI research & development further contribute to market expansion. Consumer behavior is shifting towards preference for faster, more accurate, and cost-effective annotation services.
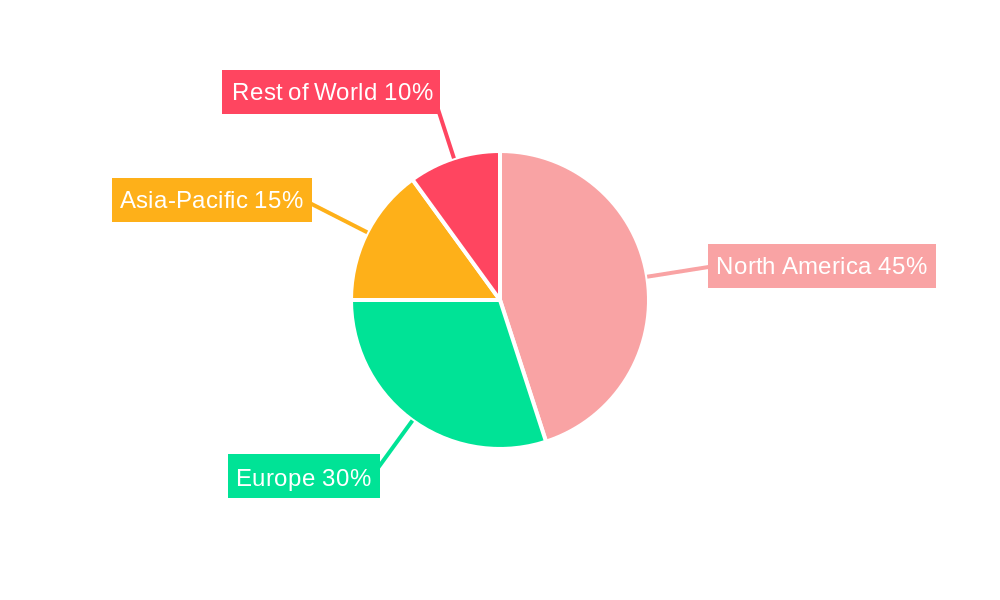
Dominant Regions, Countries, or Segments in Medical Image Annotation Software
North America currently dominates the Medical Image Annotation Software market, holding approximately xx% market share in 2025. This dominance is attributed to factors such as high healthcare expenditure, early adoption of AI technologies, and the presence of major market players. Europe follows as a significant market, exhibiting strong growth potential driven by increasing government initiatives promoting digital healthcare. Asia-Pacific also presents a lucrative growth opportunity due to the expanding healthcare sector and rising investments in AI.
- North America: High healthcare expenditure, early adoption of AI, and established market players drive dominance.
- Europe: Growing government initiatives supporting digital health and increasing AI adoption fuel growth.
- Asia-Pacific: Expanding healthcare sector and rising investments in AI create significant growth potential.
Medical Image Annotation Software Product Landscape
Medical image annotation software offerings range from basic manual annotation tools to advanced automated solutions leveraging AI and machine learning. These products offer features like image segmentation, bounding box annotation, landmark identification, and 3D annotation, catering to diverse medical imaging needs. Key performance metrics include annotation accuracy, speed, and scalability. The unique selling propositions often lie in the accuracy of the AI algorithms, ease of use, and integration capabilities with existing healthcare workflows. Recent advancements include the development of semi-automated annotation tools, combining human expertise with AI capabilities for increased efficiency and accuracy.
Key Drivers, Barriers & Challenges in Medical Image Annotation Software
Key Drivers: The increasing demand for accurate and efficient medical image analysis, coupled with advancements in AI and machine learning, are primary drivers. Government initiatives promoting digital health and rising investments in AI research & development also contribute. The increasing availability of large, annotated medical image datasets fuels the training of advanced AI algorithms, further driving market growth.
Challenges: High costs associated with developing and implementing AI-based annotation software represent a significant barrier. Data privacy concerns and regulatory compliance (e.g., HIPAA) add complexity and cost. The need for skilled professionals experienced in both medical imaging and AI can also limit market growth. The competition from traditional manual annotation services also poses a challenge. Approximately xx% of potential clients in 2025 cite cost as a major barrier to adoption.
Emerging Opportunities in Medical Image Annotation Software
Untapped markets in developing countries with growing healthcare sectors present significant opportunities. Innovative applications in areas like personalized medicine, drug discovery, and pathology promise substantial market expansion. Evolving consumer preferences towards cloud-based solutions and increased demand for integrated platforms further expand opportunities. The development of annotation tools capable of handling diverse medical imaging modalities will also drive market growth.
Growth Accelerators in the Medical Image Annotation Software Industry
Technological breakthroughs in AI and machine learning, particularly in deep learning and computer vision, will significantly accelerate market growth. Strategic partnerships between software developers, medical institutions, and pharmaceutical companies will drive innovation and adoption. Market expansion into developing countries and untapped medical specialties will create new growth avenues.
Key Players Shaping the Medical Image Annotation Software Market
- Alegion
- Ango Service
- Anolytics
- BasicAI
- Darwin
- Encord
- ImFusion Labels
- Keylabs
- Keymakr
- Kili Technology
- Labelbox
- RedBrick AI
- V7
Notable Milestones in Medical Image Annotation Software Sector
- 2020, Q4: Labelbox launches a new platform for automated data annotation.
- 2021, Q2: Kili Technology secures Series B funding for expansion.
- 2022, Q3: Alegion acquires a smaller annotation company, expanding its market share.
- 2023, Q1: Significant advancements in automated 3D medical image annotation are released by several vendors.
In-Depth Medical Image Annotation Software Market Outlook
The Medical Image Annotation Software market is poised for robust growth over the forecast period, driven by technological advancements, increasing adoption of AI in healthcare, and the expanding volume of medical images. Strategic partnerships and market expansion will further enhance growth potential. Opportunities exist in developing innovative solutions for diverse medical imaging modalities and integrating with existing healthcare workflows. The market will be further shaped by regulatory changes and evolving consumer preferences toward greater accuracy, efficiency, and cost-effectiveness.
Medical Image Annotation Software Segmentation
-
1. Application
- 1.1. CT
- 1.2. X-ray
- 1.3. MRI
- 1.4. Others
-
2. Types
- 2.1. AI Medical Image Annotation Software
- 2.2. Collaborative Medical Image Annotation Software
Medical Image Annotation Software Segmentation By Geography
-
1. North America
- 1.1. United States
- 1.2. Canada
- 1.3. Mexico
-
2. South America
- 2.1. Brazil
- 2.2. Argentina
- 2.3. Rest of South America
-
3. Europe
- 3.1. United Kingdom
- 3.2. Germany
- 3.3. France
- 3.4. Italy
- 3.5. Spain
- 3.6. Russia
- 3.7. Benelux
- 3.8. Nordics
- 3.9. Rest of Europe
-
4. Middle East & Africa
- 4.1. Turkey
- 4.2. Israel
- 4.3. GCC
- 4.4. North Africa
- 4.5. South Africa
- 4.6. Rest of Middle East & Africa
-
5. Asia Pacific
- 5.1. China
- 5.2. India
- 5.3. Japan
- 5.4. South Korea
- 5.5. ASEAN
- 5.6. Oceania
- 5.7. Rest of Asia Pacific
Medical Image Annotation Software REPORT HIGHLIGHTS
| Aspects | Details |
|---|---|
| Study Period | 2019-2033 |
| Base Year | 2024 |
| Estimated Year | 2025 |
| Forecast Period | 2025-2033 |
| Historical Period | 2019-2024 |
| Growth Rate | CAGR of XX% from 2019-2033 |
| Segmentation |
|
Table of Contents
- 1. Introduction
- 1.1. Research Scope
- 1.2. Market Segmentation
- 1.3. Research Methodology
- 1.4. Definitions and Assumptions
- 2. Executive Summary
- 2.1. Introduction
- 3. Market Dynamics
- 3.1. Introduction
- 3.2. Market Drivers
- 3.3. Market Restrains
- 3.4. Market Trends
- 4. Market Factor Analysis
- 4.1. Porters Five Forces
- 4.2. Supply/Value Chain
- 4.3. PESTEL analysis
- 4.4. Market Entropy
- 4.5. Patent/Trademark Analysis
- 5. Global Medical Image Annotation Software Analysis, Insights and Forecast, 2019-2031
- 5.1. Market Analysis, Insights and Forecast - by Application
- 5.1.1. CT
- 5.1.2. X-ray
- 5.1.3. MRI
- 5.1.4. Others
- 5.2. Market Analysis, Insights and Forecast - by Types
- 5.2.1. AI Medical Image Annotation Software
- 5.2.2. Collaborative Medical Image Annotation Software
- 5.3. Market Analysis, Insights and Forecast - by Region
- 5.3.1. North America
- 5.3.2. South America
- 5.3.3. Europe
- 5.3.4. Middle East & Africa
- 5.3.5. Asia Pacific
- 5.1. Market Analysis, Insights and Forecast - by Application
- 6. North America Medical Image Annotation Software Analysis, Insights and Forecast, 2019-2031
- 6.1. Market Analysis, Insights and Forecast - by Application
- 6.1.1. CT
- 6.1.2. X-ray
- 6.1.3. MRI
- 6.1.4. Others
- 6.2. Market Analysis, Insights and Forecast - by Types
- 6.2.1. AI Medical Image Annotation Software
- 6.2.2. Collaborative Medical Image Annotation Software
- 6.1. Market Analysis, Insights and Forecast - by Application
- 7. South America Medical Image Annotation Software Analysis, Insights and Forecast, 2019-2031
- 7.1. Market Analysis, Insights and Forecast - by Application
- 7.1.1. CT
- 7.1.2. X-ray
- 7.1.3. MRI
- 7.1.4. Others
- 7.2. Market Analysis, Insights and Forecast - by Types
- 7.2.1. AI Medical Image Annotation Software
- 7.2.2. Collaborative Medical Image Annotation Software
- 7.1. Market Analysis, Insights and Forecast - by Application
- 8. Europe Medical Image Annotation Software Analysis, Insights and Forecast, 2019-2031
- 8.1. Market Analysis, Insights and Forecast - by Application
- 8.1.1. CT
- 8.1.2. X-ray
- 8.1.3. MRI
- 8.1.4. Others
- 8.2. Market Analysis, Insights and Forecast - by Types
- 8.2.1. AI Medical Image Annotation Software
- 8.2.2. Collaborative Medical Image Annotation Software
- 8.1. Market Analysis, Insights and Forecast - by Application
- 9. Middle East & Africa Medical Image Annotation Software Analysis, Insights and Forecast, 2019-2031
- 9.1. Market Analysis, Insights and Forecast - by Application
- 9.1.1. CT
- 9.1.2. X-ray
- 9.1.3. MRI
- 9.1.4. Others
- 9.2. Market Analysis, Insights and Forecast - by Types
- 9.2.1. AI Medical Image Annotation Software
- 9.2.2. Collaborative Medical Image Annotation Software
- 9.1. Market Analysis, Insights and Forecast - by Application
- 10. Asia Pacific Medical Image Annotation Software Analysis, Insights and Forecast, 2019-2031
- 10.1. Market Analysis, Insights and Forecast - by Application
- 10.1.1. CT
- 10.1.2. X-ray
- 10.1.3. MRI
- 10.1.4. Others
- 10.2. Market Analysis, Insights and Forecast - by Types
- 10.2.1. AI Medical Image Annotation Software
- 10.2.2. Collaborative Medical Image Annotation Software
- 10.1. Market Analysis, Insights and Forecast - by Application
- 11. Competitive Analysis
- 11.1. Global Market Share Analysis 2024
- 11.2. Company Profiles
- 11.2.1 Alegion
- 11.2.1.1. Overview
- 11.2.1.2. Products
- 11.2.1.3. SWOT Analysis
- 11.2.1.4. Recent Developments
- 11.2.1.5. Financials (Based on Availability)
- 11.2.2 Ango Service
- 11.2.2.1. Overview
- 11.2.2.2. Products
- 11.2.2.3. SWOT Analysis
- 11.2.2.4. Recent Developments
- 11.2.2.5. Financials (Based on Availability)
- 11.2.3 Anolytics
- 11.2.3.1. Overview
- 11.2.3.2. Products
- 11.2.3.3. SWOT Analysis
- 11.2.3.4. Recent Developments
- 11.2.3.5. Financials (Based on Availability)
- 11.2.4 BasicAI
- 11.2.4.1. Overview
- 11.2.4.2. Products
- 11.2.4.3. SWOT Analysis
- 11.2.4.4. Recent Developments
- 11.2.4.5. Financials (Based on Availability)
- 11.2.5 Darwin
- 11.2.5.1. Overview
- 11.2.5.2. Products
- 11.2.5.3. SWOT Analysis
- 11.2.5.4. Recent Developments
- 11.2.5.5. Financials (Based on Availability)
- 11.2.6 Encord
- 11.2.6.1. Overview
- 11.2.6.2. Products
- 11.2.6.3. SWOT Analysis
- 11.2.6.4. Recent Developments
- 11.2.6.5. Financials (Based on Availability)
- 11.2.7 ImFusion Labels
- 11.2.7.1. Overview
- 11.2.7.2. Products
- 11.2.7.3. SWOT Analysis
- 11.2.7.4. Recent Developments
- 11.2.7.5. Financials (Based on Availability)
- 11.2.8 Keylabs
- 11.2.8.1. Overview
- 11.2.8.2. Products
- 11.2.8.3. SWOT Analysis
- 11.2.8.4. Recent Developments
- 11.2.8.5. Financials (Based on Availability)
- 11.2.9 Keymakr
- 11.2.9.1. Overview
- 11.2.9.2. Products
- 11.2.9.3. SWOT Analysis
- 11.2.9.4. Recent Developments
- 11.2.9.5. Financials (Based on Availability)
- 11.2.10 Kili Technology
- 11.2.10.1. Overview
- 11.2.10.2. Products
- 11.2.10.3. SWOT Analysis
- 11.2.10.4. Recent Developments
- 11.2.10.5. Financials (Based on Availability)
- 11.2.11 Labelbox
- 11.2.11.1. Overview
- 11.2.11.2. Products
- 11.2.11.3. SWOT Analysis
- 11.2.11.4. Recent Developments
- 11.2.11.5. Financials (Based on Availability)
- 11.2.12 RedBrick AI
- 11.2.12.1. Overview
- 11.2.12.2. Products
- 11.2.12.3. SWOT Analysis
- 11.2.12.4. Recent Developments
- 11.2.12.5. Financials (Based on Availability)
- 11.2.13 V7
- 11.2.13.1. Overview
- 11.2.13.2. Products
- 11.2.13.3. SWOT Analysis
- 11.2.13.4. Recent Developments
- 11.2.13.5. Financials (Based on Availability)
- 11.2.1 Alegion
List of Figures
- Figure 1: Global Medical Image Annotation Software Revenue Breakdown (million, %) by Region 2024 & 2032
- Figure 2: North America Medical Image Annotation Software Revenue (million), by Application 2024 & 2032
- Figure 3: North America Medical Image Annotation Software Revenue Share (%), by Application 2024 & 2032
- Figure 4: North America Medical Image Annotation Software Revenue (million), by Types 2024 & 2032
- Figure 5: North America Medical Image Annotation Software Revenue Share (%), by Types 2024 & 2032
- Figure 6: North America Medical Image Annotation Software Revenue (million), by Country 2024 & 2032
- Figure 7: North America Medical Image Annotation Software Revenue Share (%), by Country 2024 & 2032
- Figure 8: South America Medical Image Annotation Software Revenue (million), by Application 2024 & 2032
- Figure 9: South America Medical Image Annotation Software Revenue Share (%), by Application 2024 & 2032
- Figure 10: South America Medical Image Annotation Software Revenue (million), by Types 2024 & 2032
- Figure 11: South America Medical Image Annotation Software Revenue Share (%), by Types 2024 & 2032
- Figure 12: South America Medical Image Annotation Software Revenue (million), by Country 2024 & 2032
- Figure 13: South America Medical Image Annotation Software Revenue Share (%), by Country 2024 & 2032
- Figure 14: Europe Medical Image Annotation Software Revenue (million), by Application 2024 & 2032
- Figure 15: Europe Medical Image Annotation Software Revenue Share (%), by Application 2024 & 2032
- Figure 16: Europe Medical Image Annotation Software Revenue (million), by Types 2024 & 2032
- Figure 17: Europe Medical Image Annotation Software Revenue Share (%), by Types 2024 & 2032
- Figure 18: Europe Medical Image Annotation Software Revenue (million), by Country 2024 & 2032
- Figure 19: Europe Medical Image Annotation Software Revenue Share (%), by Country 2024 & 2032
- Figure 20: Middle East & Africa Medical Image Annotation Software Revenue (million), by Application 2024 & 2032
- Figure 21: Middle East & Africa Medical Image Annotation Software Revenue Share (%), by Application 2024 & 2032
- Figure 22: Middle East & Africa Medical Image Annotation Software Revenue (million), by Types 2024 & 2032
- Figure 23: Middle East & Africa Medical Image Annotation Software Revenue Share (%), by Types 2024 & 2032
- Figure 24: Middle East & Africa Medical Image Annotation Software Revenue (million), by Country 2024 & 2032
- Figure 25: Middle East & Africa Medical Image Annotation Software Revenue Share (%), by Country 2024 & 2032
- Figure 26: Asia Pacific Medical Image Annotation Software Revenue (million), by Application 2024 & 2032
- Figure 27: Asia Pacific Medical Image Annotation Software Revenue Share (%), by Application 2024 & 2032
- Figure 28: Asia Pacific Medical Image Annotation Software Revenue (million), by Types 2024 & 2032
- Figure 29: Asia Pacific Medical Image Annotation Software Revenue Share (%), by Types 2024 & 2032
- Figure 30: Asia Pacific Medical Image Annotation Software Revenue (million), by Country 2024 & 2032
- Figure 31: Asia Pacific Medical Image Annotation Software Revenue Share (%), by Country 2024 & 2032
List of Tables
- Table 1: Global Medical Image Annotation Software Revenue million Forecast, by Region 2019 & 2032
- Table 2: Global Medical Image Annotation Software Revenue million Forecast, by Application 2019 & 2032
- Table 3: Global Medical Image Annotation Software Revenue million Forecast, by Types 2019 & 2032
- Table 4: Global Medical Image Annotation Software Revenue million Forecast, by Region 2019 & 2032
- Table 5: Global Medical Image Annotation Software Revenue million Forecast, by Application 2019 & 2032
- Table 6: Global Medical Image Annotation Software Revenue million Forecast, by Types 2019 & 2032
- Table 7: Global Medical Image Annotation Software Revenue million Forecast, by Country 2019 & 2032
- Table 8: United States Medical Image Annotation Software Revenue (million) Forecast, by Application 2019 & 2032
- Table 9: Canada Medical Image Annotation Software Revenue (million) Forecast, by Application 2019 & 2032
- Table 10: Mexico Medical Image Annotation Software Revenue (million) Forecast, by Application 2019 & 2032
- Table 11: Global Medical Image Annotation Software Revenue million Forecast, by Application 2019 & 2032
- Table 12: Global Medical Image Annotation Software Revenue million Forecast, by Types 2019 & 2032
- Table 13: Global Medical Image Annotation Software Revenue million Forecast, by Country 2019 & 2032
- Table 14: Brazil Medical Image Annotation Software Revenue (million) Forecast, by Application 2019 & 2032
- Table 15: Argentina Medical Image Annotation Software Revenue (million) Forecast, by Application 2019 & 2032
- Table 16: Rest of South America Medical Image Annotation Software Revenue (million) Forecast, by Application 2019 & 2032
- Table 17: Global Medical Image Annotation Software Revenue million Forecast, by Application 2019 & 2032
- Table 18: Global Medical Image Annotation Software Revenue million Forecast, by Types 2019 & 2032
- Table 19: Global Medical Image Annotation Software Revenue million Forecast, by Country 2019 & 2032
- Table 20: United Kingdom Medical Image Annotation Software Revenue (million) Forecast, by Application 2019 & 2032
- Table 21: Germany Medical Image Annotation Software Revenue (million) Forecast, by Application 2019 & 2032
- Table 22: France Medical Image Annotation Software Revenue (million) Forecast, by Application 2019 & 2032
- Table 23: Italy Medical Image Annotation Software Revenue (million) Forecast, by Application 2019 & 2032
- Table 24: Spain Medical Image Annotation Software Revenue (million) Forecast, by Application 2019 & 2032
- Table 25: Russia Medical Image Annotation Software Revenue (million) Forecast, by Application 2019 & 2032
- Table 26: Benelux Medical Image Annotation Software Revenue (million) Forecast, by Application 2019 & 2032
- Table 27: Nordics Medical Image Annotation Software Revenue (million) Forecast, by Application 2019 & 2032
- Table 28: Rest of Europe Medical Image Annotation Software Revenue (million) Forecast, by Application 2019 & 2032
- Table 29: Global Medical Image Annotation Software Revenue million Forecast, by Application 2019 & 2032
- Table 30: Global Medical Image Annotation Software Revenue million Forecast, by Types 2019 & 2032
- Table 31: Global Medical Image Annotation Software Revenue million Forecast, by Country 2019 & 2032
- Table 32: Turkey Medical Image Annotation Software Revenue (million) Forecast, by Application 2019 & 2032
- Table 33: Israel Medical Image Annotation Software Revenue (million) Forecast, by Application 2019 & 2032
- Table 34: GCC Medical Image Annotation Software Revenue (million) Forecast, by Application 2019 & 2032
- Table 35: North Africa Medical Image Annotation Software Revenue (million) Forecast, by Application 2019 & 2032
- Table 36: South Africa Medical Image Annotation Software Revenue (million) Forecast, by Application 2019 & 2032
- Table 37: Rest of Middle East & Africa Medical Image Annotation Software Revenue (million) Forecast, by Application 2019 & 2032
- Table 38: Global Medical Image Annotation Software Revenue million Forecast, by Application 2019 & 2032
- Table 39: Global Medical Image Annotation Software Revenue million Forecast, by Types 2019 & 2032
- Table 40: Global Medical Image Annotation Software Revenue million Forecast, by Country 2019 & 2032
- Table 41: China Medical Image Annotation Software Revenue (million) Forecast, by Application 2019 & 2032
- Table 42: India Medical Image Annotation Software Revenue (million) Forecast, by Application 2019 & 2032
- Table 43: Japan Medical Image Annotation Software Revenue (million) Forecast, by Application 2019 & 2032
- Table 44: South Korea Medical Image Annotation Software Revenue (million) Forecast, by Application 2019 & 2032
- Table 45: ASEAN Medical Image Annotation Software Revenue (million) Forecast, by Application 2019 & 2032
- Table 46: Oceania Medical Image Annotation Software Revenue (million) Forecast, by Application 2019 & 2032
- Table 47: Rest of Asia Pacific Medical Image Annotation Software Revenue (million) Forecast, by Application 2019 & 2032
Frequently Asked Questions
1. What is the projected Compound Annual Growth Rate (CAGR) of the Medical Image Annotation Software?
The projected CAGR is approximately XX%.
2. Which companies are prominent players in the Medical Image Annotation Software?
Key companies in the market include Alegion, Ango Service, Anolytics, BasicAI, Darwin, Encord, ImFusion Labels, Keylabs, Keymakr, Kili Technology, Labelbox, RedBrick AI, V7.
3. What are the main segments of the Medical Image Annotation Software?
The market segments include Application, Types.
4. Can you provide details about the market size?
The market size is estimated to be USD XXX million as of 2022.
5. What are some drivers contributing to market growth?
N/A
6. What are the notable trends driving market growth?
N/A
7. Are there any restraints impacting market growth?
N/A
8. Can you provide examples of recent developments in the market?
N/A
9. What pricing options are available for accessing the report?
Pricing options include single-user, multi-user, and enterprise licenses priced at USD 2900.00, USD 4350.00, and USD 5800.00 respectively.
10. Is the market size provided in terms of value or volume?
The market size is provided in terms of value, measured in million.
11. Are there any specific market keywords associated with the report?
Yes, the market keyword associated with the report is "Medical Image Annotation Software," which aids in identifying and referencing the specific market segment covered.
12. How do I determine which pricing option suits my needs best?
The pricing options vary based on user requirements and access needs. Individual users may opt for single-user licenses, while businesses requiring broader access may choose multi-user or enterprise licenses for cost-effective access to the report.
13. Are there any additional resources or data provided in the Medical Image Annotation Software report?
While the report offers comprehensive insights, it's advisable to review the specific contents or supplementary materials provided to ascertain if additional resources or data are available.
14. How can I stay updated on further developments or reports in the Medical Image Annotation Software?
To stay informed about further developments, trends, and reports in the Medical Image Annotation Software, consider subscribing to industry newsletters, following relevant companies and organizations, or regularly checking reputable industry news sources and publications.
Methodology
Step 1 - Identification of Relevant Samples Size from Population Database


Step 2 - Approaches for Defining Global Market Size (Value, Volume* & Price*)

Note*: In applicable scenarios
Step 3 - Data Sources
Primary Research
- Web Analytics
- Survey Reports
- Research Institute
- Latest Research Reports
- Opinion Leaders
Secondary Research
- Annual Reports
- White Paper
- Latest Press Release
- Industry Association
- Paid Database
- Investor Presentations

Step 4 - Data Triangulation
Involves using different sources of information in order to increase the validity of a study
These sources are likely to be stakeholders in a program - participants, other researchers, program staff, other community members, and so on.
Then we put all data in single framework & apply various statistical tools to find out the dynamic on the market.
During the analysis stage, feedback from the stakeholder groups would be compared to determine areas of agreement as well as areas of divergence


