


Key Insights
The global Medical Blood Bag market is projected to achieve a market size of USD 401 million by 2025, driven by a Compound Annual Growth Rate (CAGR) of 7.1%. This growth is propelled by increased demand for blood transfusions, technological advancements in blood collection and storage, and the rising prevalence of chronic diseases and surgical procedures. Key factors include the escalating need for safe blood components, heightened awareness of blood donation, and continuous innovation in blood bag materials and designs to enhance product viability and minimize transfusion complications. Market segmentation spans critical applications such as blood banks and hospitals, and product types including single to quadruple blood bags, underscoring their essential role in healthcare.
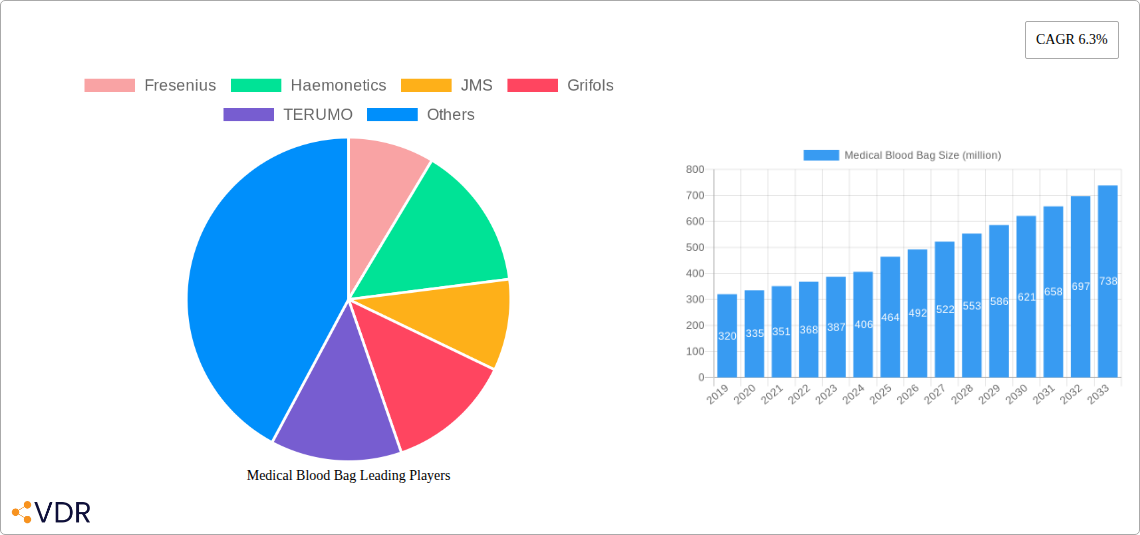
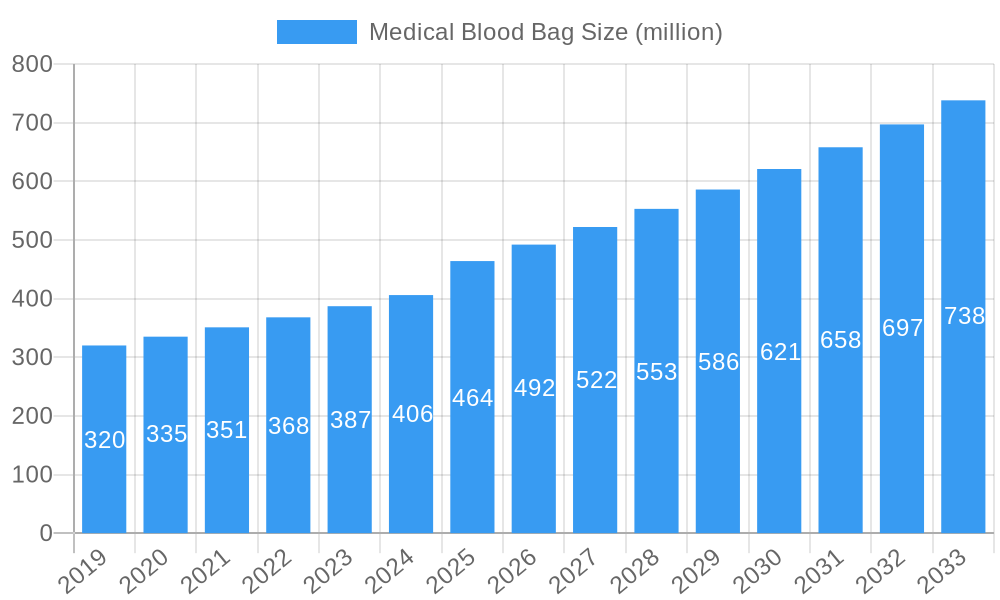
Medical Blood Bag Market Size (In Million)

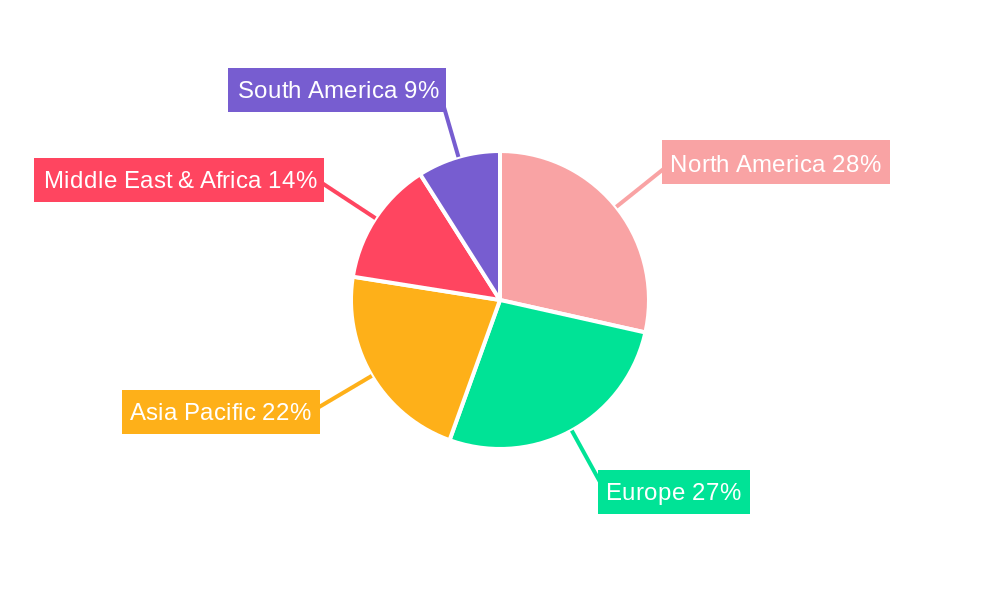
North America and Europe currently dominate the Medical Blood Bag market, supported by robust healthcare infrastructures, high disposable incomes, and advanced medical facilities. However, the Asia Pacific region is expected to exhibit the most rapid expansion, fueled by developing healthcare systems, a growing patient base requiring transfusions, increased healthcare investments, and more frequent blood donation drives. This surge is further supported by population growth and a rising incidence of conditions like anemia and thalassemia. While regulatory hurdles and the cost of advanced technologies may present challenges, the market's trajectory remains positive, emphasizing patient safety and the critical role of blood products in life-saving interventions.
Medical Blood Bag Company Market Share
This comprehensive report offers an in-depth analysis of the global Medical Blood Bag market, detailing its dynamics, growth trends, regional leadership, product innovations, key challenges, and emerging opportunities. With a study period from 2019 to 2033 and a base year of 2025, this research provides crucial insights for stakeholders navigating this vital healthcare segment. The report examines both parent and child markets for a holistic perspective on market evolution and future potential.
Medical Blood Bag Market Dynamics & Structure
The global medical blood bag market is characterized by a moderate to high concentration, with a few prominent players holding significant market shares. Technological innovation is a key driver, particularly in the development of advanced materials, improved storage solutions, and integrated functionalities such as leukoreduction filters and pre-connected tubing. Regulatory frameworks, overseen by bodies like the FDA and EMA, play a crucial role in ensuring product safety and efficacy, thereby influencing manufacturing standards and market access. Competitive product substitutes, while limited in direct blood storage, include advancements in synthetic blood substitutes and improved blood component fractionation technologies. End-user demographics are increasingly influenced by an aging global population, rising prevalence of chronic diseases, and expanding healthcare infrastructure, particularly in emerging economies. Mergers and acquisitions (M&A) trends are observed as companies aim to consolidate market presence, acquire new technologies, and expand their geographical reach. For instance, the last five years have seen an estimated 15-20 M&A deals, indicating active consolidation.
- Market Concentration: Moderate to High, with top 5 players estimated to hold 60-70% of the market share.
- Technological Innovation Drivers: Development of specialized blood bags for specific applications (e.g., apheresis), enhanced additive solutions, improved traceability features, and sustainable material alternatives.
- Regulatory Frameworks: Stringent approval processes and quality control standards imposed by global health authorities.
- Competitive Product Substitutes: Limited direct substitutes for whole blood storage, but advancements in blood substitutes and alternative transfusion therapies are monitored.
- End-User Demographics: Growing demand from aging populations, increased surgical procedures, and expanded blood transfusion services.
- M&A Trends: Strategic acquisitions and collaborations to expand product portfolios and market reach.
Medical Blood Bag Growth Trends & Insights
The global medical blood bag market is poised for robust growth, driven by a confluence of factors including increasing blood donation rates, rising demand for blood components in various medical procedures, and continuous technological advancements in blood bag design and functionality. The market size evolution is projected to witness a Compound Annual Growth Rate (CAGR) of approximately 5.5% from 2025 to 2033. Adoption rates for specialized blood bags, such as those with integrated filters for leukoreduction, are steadily increasing, reflecting a growing emphasis on transfusion safety and reduced alloimmunization. Technological disruptions, such as the development of novel anticoagulant solutions and improved material science for extended shelf-life, are further shaping market dynamics. Consumer behavior shifts are evident in healthcare providers' increasing preference for disposable, single-use blood bags due to their sterility and convenience, alongside a growing awareness of infection control protocols. Market penetration is expected to deepen in developing regions as healthcare infrastructure improves and public health initiatives promoting blood donation gain traction. The estimated market size for medical blood bags was approximately $3.5 billion in 2025, with projections indicating a reach of over $5.5 billion by 2033. This growth is underpinned by an increasing number of blood transfusions performed globally, estimated to be over 150 million units annually.
Dominant Regions, Countries, or Segments in Medical Blood Bag
The Hospitals segment, within the Application category, is identified as the dominant force driving growth in the global medical blood bag market. This dominance is attributed to the sheer volume of blood transfusions and component therapies routinely performed in hospital settings across the globe. North America and Europe currently represent the largest regional markets, owing to well-established healthcare systems, high per capita healthcare expenditure, and advanced transfusion medicine practices. However, the Asia-Pacific region is emerging as a significant growth engine, propelled by increasing healthcare investments, a burgeoning population, and improving access to medical services.
Within the Types segment, Single blood bags continue to hold a substantial market share due to their widespread use in routine blood donations and transfusions. However, the demand for Double and Triple blood bags is steadily rising, driven by the increasing practice of component separation at the point of collection, allowing for the efficient utilization of donated blood for various therapeutic purposes. This trend enhances the value derived from each donation.
- Dominant Application Segment: Hospitals
- Primary consumers of blood and blood components for surgeries, trauma care, and chronic disease management.
- High volume of procedures necessitates consistent supply of sterile blood bags.
- Increasing adoption of advanced transfusion technologies and component therapy.
- Dominant Regional Markets: North America and Europe, characterized by robust healthcare infrastructure and high demand.
- Emerging Growth Region: Asia-Pacific, driven by population growth, increasing healthcare spending, and expanding medical facilities.
- Dominant Type Segment: Single blood bags, for routine donations and transfusions.
- Growing Type Segments: Double and Triple blood bags, supporting component separation and optimized blood utilization.
- Key Drivers for Dominance: Economic policies supporting healthcare access, advanced medical infrastructure, high prevalence of blood-related procedures, and blood donation campaign effectiveness.
Medical Blood Bag Product Landscape
The medical blood bag product landscape is defined by continuous innovation aimed at enhancing safety, efficacy, and convenience. Modern blood bags are constructed from advanced polymeric materials, such as polyvinyl chloride (PVC) and increasingly, PVC-free alternatives, offering superior biocompatibility and reduced leachables. Key product innovations include integrated leukoreduction filters that efficiently remove white blood cells, thereby reducing the risk of transfusion-related immunomodulation and febrile non-hemolytic transfusion reactions. Other advancements include multi-component bags designed for the collection and storage of various blood fractions, pre-connected systems for automated blood processing, and specialized bags for platelet storage with improved viability. Performance metrics are rigorously monitored, focusing on maintaining the integrity of blood components, preventing microbial contamination, and ensuring optimal storage conditions for extended shelf-life, typically ranging from 21 to 42 days for red blood cells, and up to 5 days for platelets under refrigeration.
Key Drivers, Barriers & Challenges in Medical Blood Bag
Key Drivers:
- Increasing demand for blood and blood components: Driven by aging populations, rising surgical procedures, and chronic disease management.
- Technological advancements: Development of safer, more efficient, and specialized blood bags (e.g., leukoreduction filters, multi-component bags).
- Growing awareness of transfusion safety: Leading to increased adoption of advanced blood bag technologies.
- Expanding healthcare infrastructure: Particularly in emerging economies, increasing access to blood transfusion services.
- Government initiatives and blood donation campaigns: Promoting voluntary blood donation and ensuring adequate blood supply.
Barriers & Challenges:
- Stringent regulatory approvals: Time-consuming and costly processes for new product introductions.
- Supply chain complexities: Ensuring a consistent and reliable supply of raw materials and finished products globally.
- Price sensitivity: Competition and cost pressures can impact profitability and investment in R&D.
- Cold chain management: Maintaining the integrity of blood products throughout the supply chain is critical and resource-intensive.
- Risk of microbial contamination: While low, it remains a persistent concern requiring robust manufacturing and handling protocols.
- Competition from alternative treatments: Emerging synthetic blood substitutes and advanced therapeutic approaches could, in the long term, impact demand.
Emerging Opportunities in Medical Blood Bag
Emerging opportunities in the medical blood bag market lie in the development and adoption of sustainable and eco-friendly materials, such as PVC-free alternatives, to address growing environmental concerns. The expansion of blood processing and component therapy, particularly in low- and middle-income countries, presents a significant untapped market. Furthermore, innovations in smart blood bags, incorporating real-time monitoring of temperature and blood quality, offer potential for enhanced transfusion safety and efficiency. The increasing focus on personalized medicine may also drive the development of specialized blood bags for niche applications, such as stem cell collection and cellular therapies. The global market for sterile connection devices and automated blood processing systems also presents synergistic growth opportunities.
Growth Accelerators in the Medical Blood Bag Industry
Growth accelerators in the medical blood bag industry are predominantly driven by technological breakthroughs in material science and manufacturing processes. The increasing integration of leukoreduction filters directly into blood bags is a significant catalyst, enhancing product value and patient safety. Strategic partnerships between blood bag manufacturers and blood collection organizations or research institutions are fostering innovation and accelerating product development cycles. Furthermore, market expansion strategies focused on untapped geographical regions, coupled with supportive government policies promoting blood donation and transfusion services, are critical growth engines. The rising demand for apheresis products and specialized blood components is also a key accelerator, necessitating the development of tailored blood bag solutions.
Key Players Shaping the Medical Blood Bag Market
- Fresenius
- Haemonetics
- JMS
- Grifols
- TERUMO
- Wego
- Shandong Zhongbaokang
- Nigale Biomedical
- Celgene Biomedical
- Beijing Bodesant
- Macopharma
- Poly Medicure
- HLL Lifecare
Notable Milestones in Medical Blood Bag Sector
- 2019: Increased adoption of PVC-free blood bags due to environmental and health concerns.
- 2020: Enhanced focus on sterile connection technologies for blood bags amidst global health challenges.
- 2021: Significant advancements in leukoreduction filter technology, improving efficiency and reducing patient risks.
- 2022: Expansion of multi-component blood bag systems for optimized blood fractionation.
- 2023: Growing investment in R&D for novel anticoagulant solutions to extend blood product shelf-life.
- 2024: Rise in demand for specialized blood bags for cell and gene therapy applications.
In-Depth Medical Blood Bag Market Outlook
The future of the medical blood bag market appears highly promising, with continued growth fueled by an expanding global need for safe and effective blood transfusions. The market will likely witness further integration of smart technologies, enhancing traceability and quality control. Strategic collaborations and investments in emerging markets will be crucial for sustained expansion. The persistent drive towards improved patient outcomes and operational efficiency in healthcare settings will continue to push innovation in blood bag design and functionality, solidifying its indispensable role in modern medicine. Companies that prioritize sustainable manufacturing practices and adapt to evolving regulatory landscapes will be well-positioned for long-term success.
Medical Blood Bag Segmentation
-
1. Application
- 1.1. Blood Banks
- 1.2. Hospitals
- 1.3. Others
-
2. Types
- 2.1. Single
- 2.2. Double
- 2.3. Triple
- 2.4. Quadruple
- 2.5. Other
Medical Blood Bag Segmentation By Geography
-
1. North America
- 1.1. United States
- 1.2. Canada
- 1.3. Mexico
-
2. South America
- 2.1. Brazil
- 2.2. Argentina
- 2.3. Rest of South America
-
3. Europe
- 3.1. United Kingdom
- 3.2. Germany
- 3.3. France
- 3.4. Italy
- 3.5. Spain
- 3.6. Russia
- 3.7. Benelux
- 3.8. Nordics
- 3.9. Rest of Europe
-
4. Middle East & Africa
- 4.1. Turkey
- 4.2. Israel
- 4.3. GCC
- 4.4. North Africa
- 4.5. South Africa
- 4.6. Rest of Middle East & Africa
-
5. Asia Pacific
- 5.1. China
- 5.2. India
- 5.3. Japan
- 5.4. South Korea
- 5.5. ASEAN
- 5.6. Oceania
- 5.7. Rest of Asia Pacific
Medical Blood Bag Regional Market Share
Geographic Coverage of Medical Blood Bag
Medical Blood Bag REPORT HIGHLIGHTS
| Aspects | Details |
|---|---|
| Study Period | 2020-2034 |
| Base Year | 2025 |
| Estimated Year | 2026 |
| Forecast Period | 2026-2034 |
| Historical Period | 2020-2025 |
| Growth Rate | CAGR of 7.1% from 2020-2034 |
| Segmentation |
|
Table of Contents
- 1. Introduction
- 1.1. Research Scope
- 1.2. Market Segmentation
- 1.3. Research Methodology
- 1.4. Definitions and Assumptions
- 2. Executive Summary
- 2.1. Introduction
- 3. Market Dynamics
- 3.1. Introduction
- 3.2. Market Drivers
- 3.3. Market Restrains
- 3.4. Market Trends
- 4. Market Factor Analysis
- 4.1. Porters Five Forces
- 4.2. Supply/Value Chain
- 4.3. PESTEL analysis
- 4.4. Market Entropy
- 4.5. Patent/Trademark Analysis
- 5. Global Medical Blood Bag Analysis, Insights and Forecast, 2020-2032
- 5.1. Market Analysis, Insights and Forecast - by Application
- 5.1.1. Blood Banks
- 5.1.2. Hospitals
- 5.1.3. Others
- 5.2. Market Analysis, Insights and Forecast - by Types
- 5.2.1. Single
- 5.2.2. Double
- 5.2.3. Triple
- 5.2.4. Quadruple
- 5.2.5. Other
- 5.3. Market Analysis, Insights and Forecast - by Region
- 5.3.1. North America
- 5.3.2. South America
- 5.3.3. Europe
- 5.3.4. Middle East & Africa
- 5.3.5. Asia Pacific
- 5.1. Market Analysis, Insights and Forecast - by Application
- 6. North America Medical Blood Bag Analysis, Insights and Forecast, 2020-2032
- 6.1. Market Analysis, Insights and Forecast - by Application
- 6.1.1. Blood Banks
- 6.1.2. Hospitals
- 6.1.3. Others
- 6.2. Market Analysis, Insights and Forecast - by Types
- 6.2.1. Single
- 6.2.2. Double
- 6.2.3. Triple
- 6.2.4. Quadruple
- 6.2.5. Other
- 6.1. Market Analysis, Insights and Forecast - by Application
- 7. South America Medical Blood Bag Analysis, Insights and Forecast, 2020-2032
- 7.1. Market Analysis, Insights and Forecast - by Application
- 7.1.1. Blood Banks
- 7.1.2. Hospitals
- 7.1.3. Others
- 7.2. Market Analysis, Insights and Forecast - by Types
- 7.2.1. Single
- 7.2.2. Double
- 7.2.3. Triple
- 7.2.4. Quadruple
- 7.2.5. Other
- 7.1. Market Analysis, Insights and Forecast - by Application
- 8. Europe Medical Blood Bag Analysis, Insights and Forecast, 2020-2032
- 8.1. Market Analysis, Insights and Forecast - by Application
- 8.1.1. Blood Banks
- 8.1.2. Hospitals
- 8.1.3. Others
- 8.2. Market Analysis, Insights and Forecast - by Types
- 8.2.1. Single
- 8.2.2. Double
- 8.2.3. Triple
- 8.2.4. Quadruple
- 8.2.5. Other
- 8.1. Market Analysis, Insights and Forecast - by Application
- 9. Middle East & Africa Medical Blood Bag Analysis, Insights and Forecast, 2020-2032
- 9.1. Market Analysis, Insights and Forecast - by Application
- 9.1.1. Blood Banks
- 9.1.2. Hospitals
- 9.1.3. Others
- 9.2. Market Analysis, Insights and Forecast - by Types
- 9.2.1. Single
- 9.2.2. Double
- 9.2.3. Triple
- 9.2.4. Quadruple
- 9.2.5. Other
- 9.1. Market Analysis, Insights and Forecast - by Application
- 10. Asia Pacific Medical Blood Bag Analysis, Insights and Forecast, 2020-2032
- 10.1. Market Analysis, Insights and Forecast - by Application
- 10.1.1. Blood Banks
- 10.1.2. Hospitals
- 10.1.3. Others
- 10.2. Market Analysis, Insights and Forecast - by Types
- 10.2.1. Single
- 10.2.2. Double
- 10.2.3. Triple
- 10.2.4. Quadruple
- 10.2.5. Other
- 10.1. Market Analysis, Insights and Forecast - by Application
- 11. Competitive Analysis
- 11.1. Global Market Share Analysis 2025
- 11.2. Company Profiles
- 11.2.1 Fresenius
- 11.2.1.1. Overview
- 11.2.1.2. Products
- 11.2.1.3. SWOT Analysis
- 11.2.1.4. Recent Developments
- 11.2.1.5. Financials (Based on Availability)
- 11.2.2 Haemonetics
- 11.2.2.1. Overview
- 11.2.2.2. Products
- 11.2.2.3. SWOT Analysis
- 11.2.2.4. Recent Developments
- 11.2.2.5. Financials (Based on Availability)
- 11.2.3 JMS
- 11.2.3.1. Overview
- 11.2.3.2. Products
- 11.2.3.3. SWOT Analysis
- 11.2.3.4. Recent Developments
- 11.2.3.5. Financials (Based on Availability)
- 11.2.4 Grifols
- 11.2.4.1. Overview
- 11.2.4.2. Products
- 11.2.4.3. SWOT Analysis
- 11.2.4.4. Recent Developments
- 11.2.4.5. Financials (Based on Availability)
- 11.2.5 TERUMO
- 11.2.5.1. Overview
- 11.2.5.2. Products
- 11.2.5.3. SWOT Analysis
- 11.2.5.4. Recent Developments
- 11.2.5.5. Financials (Based on Availability)
- 11.2.6 Wego
- 11.2.6.1. Overview
- 11.2.6.2. Products
- 11.2.6.3. SWOT Analysis
- 11.2.6.4. Recent Developments
- 11.2.6.5. Financials (Based on Availability)
- 11.2.7 Shandong Zhongbaokang
- 11.2.7.1. Overview
- 11.2.7.2. Products
- 11.2.7.3. SWOT Analysis
- 11.2.7.4. Recent Developments
- 11.2.7.5. Financials (Based on Availability)
- 11.2.8 Nigale Biomedical
- 11.2.8.1. Overview
- 11.2.8.2. Products
- 11.2.8.3. SWOT Analysis
- 11.2.8.4. Recent Developments
- 11.2.8.5. Financials (Based on Availability)
- 11.2.9 Celgene Biomedical
- 11.2.9.1. Overview
- 11.2.9.2. Products
- 11.2.9.3. SWOT Analysis
- 11.2.9.4. Recent Developments
- 11.2.9.5. Financials (Based on Availability)
- 11.2.10 Beijing Bodesant
- 11.2.10.1. Overview
- 11.2.10.2. Products
- 11.2.10.3. SWOT Analysis
- 11.2.10.4. Recent Developments
- 11.2.10.5. Financials (Based on Availability)
- 11.2.11 Macopharma
- 11.2.11.1. Overview
- 11.2.11.2. Products
- 11.2.11.3. SWOT Analysis
- 11.2.11.4. Recent Developments
- 11.2.11.5. Financials (Based on Availability)
- 11.2.12 Poly Medicure
- 11.2.12.1. Overview
- 11.2.12.2. Products
- 11.2.12.3. SWOT Analysis
- 11.2.12.4. Recent Developments
- 11.2.12.5. Financials (Based on Availability)
- 11.2.13 HLL Lifecare
- 11.2.13.1. Overview
- 11.2.13.2. Products
- 11.2.13.3. SWOT Analysis
- 11.2.13.4. Recent Developments
- 11.2.13.5. Financials (Based on Availability)
- 11.2.1 Fresenius
List of Figures
- Figure 1: Global Medical Blood Bag Revenue Breakdown (million, %) by Region 2025 & 2033
- Figure 2: Global Medical Blood Bag Volume Breakdown (K, %) by Region 2025 & 2033
- Figure 3: North America Medical Blood Bag Revenue (million), by Application 2025 & 2033
- Figure 4: North America Medical Blood Bag Volume (K), by Application 2025 & 2033
- Figure 5: North America Medical Blood Bag Revenue Share (%), by Application 2025 & 2033
- Figure 6: North America Medical Blood Bag Volume Share (%), by Application 2025 & 2033
- Figure 7: North America Medical Blood Bag Revenue (million), by Types 2025 & 2033
- Figure 8: North America Medical Blood Bag Volume (K), by Types 2025 & 2033
- Figure 9: North America Medical Blood Bag Revenue Share (%), by Types 2025 & 2033
- Figure 10: North America Medical Blood Bag Volume Share (%), by Types 2025 & 2033
- Figure 11: North America Medical Blood Bag Revenue (million), by Country 2025 & 2033
- Figure 12: North America Medical Blood Bag Volume (K), by Country 2025 & 2033
- Figure 13: North America Medical Blood Bag Revenue Share (%), by Country 2025 & 2033
- Figure 14: North America Medical Blood Bag Volume Share (%), by Country 2025 & 2033
- Figure 15: South America Medical Blood Bag Revenue (million), by Application 2025 & 2033
- Figure 16: South America Medical Blood Bag Volume (K), by Application 2025 & 2033
- Figure 17: South America Medical Blood Bag Revenue Share (%), by Application 2025 & 2033
- Figure 18: South America Medical Blood Bag Volume Share (%), by Application 2025 & 2033
- Figure 19: South America Medical Blood Bag Revenue (million), by Types 2025 & 2033
- Figure 20: South America Medical Blood Bag Volume (K), by Types 2025 & 2033
- Figure 21: South America Medical Blood Bag Revenue Share (%), by Types 2025 & 2033
- Figure 22: South America Medical Blood Bag Volume Share (%), by Types 2025 & 2033
- Figure 23: South America Medical Blood Bag Revenue (million), by Country 2025 & 2033
- Figure 24: South America Medical Blood Bag Volume (K), by Country 2025 & 2033
- Figure 25: South America Medical Blood Bag Revenue Share (%), by Country 2025 & 2033
- Figure 26: South America Medical Blood Bag Volume Share (%), by Country 2025 & 2033
- Figure 27: Europe Medical Blood Bag Revenue (million), by Application 2025 & 2033
- Figure 28: Europe Medical Blood Bag Volume (K), by Application 2025 & 2033
- Figure 29: Europe Medical Blood Bag Revenue Share (%), by Application 2025 & 2033
- Figure 30: Europe Medical Blood Bag Volume Share (%), by Application 2025 & 2033
- Figure 31: Europe Medical Blood Bag Revenue (million), by Types 2025 & 2033
- Figure 32: Europe Medical Blood Bag Volume (K), by Types 2025 & 2033
- Figure 33: Europe Medical Blood Bag Revenue Share (%), by Types 2025 & 2033
- Figure 34: Europe Medical Blood Bag Volume Share (%), by Types 2025 & 2033
- Figure 35: Europe Medical Blood Bag Revenue (million), by Country 2025 & 2033
- Figure 36: Europe Medical Blood Bag Volume (K), by Country 2025 & 2033
- Figure 37: Europe Medical Blood Bag Revenue Share (%), by Country 2025 & 2033
- Figure 38: Europe Medical Blood Bag Volume Share (%), by Country 2025 & 2033
- Figure 39: Middle East & Africa Medical Blood Bag Revenue (million), by Application 2025 & 2033
- Figure 40: Middle East & Africa Medical Blood Bag Volume (K), by Application 2025 & 2033
- Figure 41: Middle East & Africa Medical Blood Bag Revenue Share (%), by Application 2025 & 2033
- Figure 42: Middle East & Africa Medical Blood Bag Volume Share (%), by Application 2025 & 2033
- Figure 43: Middle East & Africa Medical Blood Bag Revenue (million), by Types 2025 & 2033
- Figure 44: Middle East & Africa Medical Blood Bag Volume (K), by Types 2025 & 2033
- Figure 45: Middle East & Africa Medical Blood Bag Revenue Share (%), by Types 2025 & 2033
- Figure 46: Middle East & Africa Medical Blood Bag Volume Share (%), by Types 2025 & 2033
- Figure 47: Middle East & Africa Medical Blood Bag Revenue (million), by Country 2025 & 2033
- Figure 48: Middle East & Africa Medical Blood Bag Volume (K), by Country 2025 & 2033
- Figure 49: Middle East & Africa Medical Blood Bag Revenue Share (%), by Country 2025 & 2033
- Figure 50: Middle East & Africa Medical Blood Bag Volume Share (%), by Country 2025 & 2033
- Figure 51: Asia Pacific Medical Blood Bag Revenue (million), by Application 2025 & 2033
- Figure 52: Asia Pacific Medical Blood Bag Volume (K), by Application 2025 & 2033
- Figure 53: Asia Pacific Medical Blood Bag Revenue Share (%), by Application 2025 & 2033
- Figure 54: Asia Pacific Medical Blood Bag Volume Share (%), by Application 2025 & 2033
- Figure 55: Asia Pacific Medical Blood Bag Revenue (million), by Types 2025 & 2033
- Figure 56: Asia Pacific Medical Blood Bag Volume (K), by Types 2025 & 2033
- Figure 57: Asia Pacific Medical Blood Bag Revenue Share (%), by Types 2025 & 2033
- Figure 58: Asia Pacific Medical Blood Bag Volume Share (%), by Types 2025 & 2033
- Figure 59: Asia Pacific Medical Blood Bag Revenue (million), by Country 2025 & 2033
- Figure 60: Asia Pacific Medical Blood Bag Volume (K), by Country 2025 & 2033
- Figure 61: Asia Pacific Medical Blood Bag Revenue Share (%), by Country 2025 & 2033
- Figure 62: Asia Pacific Medical Blood Bag Volume Share (%), by Country 2025 & 2033
List of Tables
- Table 1: Global Medical Blood Bag Revenue million Forecast, by Application 2020 & 2033
- Table 2: Global Medical Blood Bag Volume K Forecast, by Application 2020 & 2033
- Table 3: Global Medical Blood Bag Revenue million Forecast, by Types 2020 & 2033
- Table 4: Global Medical Blood Bag Volume K Forecast, by Types 2020 & 2033
- Table 5: Global Medical Blood Bag Revenue million Forecast, by Region 2020 & 2033
- Table 6: Global Medical Blood Bag Volume K Forecast, by Region 2020 & 2033
- Table 7: Global Medical Blood Bag Revenue million Forecast, by Application 2020 & 2033
- Table 8: Global Medical Blood Bag Volume K Forecast, by Application 2020 & 2033
- Table 9: Global Medical Blood Bag Revenue million Forecast, by Types 2020 & 2033
- Table 10: Global Medical Blood Bag Volume K Forecast, by Types 2020 & 2033
- Table 11: Global Medical Blood Bag Revenue million Forecast, by Country 2020 & 2033
- Table 12: Global Medical Blood Bag Volume K Forecast, by Country 2020 & 2033
- Table 13: United States Medical Blood Bag Revenue (million) Forecast, by Application 2020 & 2033
- Table 14: United States Medical Blood Bag Volume (K) Forecast, by Application 2020 & 2033
- Table 15: Canada Medical Blood Bag Revenue (million) Forecast, by Application 2020 & 2033
- Table 16: Canada Medical Blood Bag Volume (K) Forecast, by Application 2020 & 2033
- Table 17: Mexico Medical Blood Bag Revenue (million) Forecast, by Application 2020 & 2033
- Table 18: Mexico Medical Blood Bag Volume (K) Forecast, by Application 2020 & 2033
- Table 19: Global Medical Blood Bag Revenue million Forecast, by Application 2020 & 2033
- Table 20: Global Medical Blood Bag Volume K Forecast, by Application 2020 & 2033
- Table 21: Global Medical Blood Bag Revenue million Forecast, by Types 2020 & 2033
- Table 22: Global Medical Blood Bag Volume K Forecast, by Types 2020 & 2033
- Table 23: Global Medical Blood Bag Revenue million Forecast, by Country 2020 & 2033
- Table 24: Global Medical Blood Bag Volume K Forecast, by Country 2020 & 2033
- Table 25: Brazil Medical Blood Bag Revenue (million) Forecast, by Application 2020 & 2033
- Table 26: Brazil Medical Blood Bag Volume (K) Forecast, by Application 2020 & 2033
- Table 27: Argentina Medical Blood Bag Revenue (million) Forecast, by Application 2020 & 2033
- Table 28: Argentina Medical Blood Bag Volume (K) Forecast, by Application 2020 & 2033
- Table 29: Rest of South America Medical Blood Bag Revenue (million) Forecast, by Application 2020 & 2033
- Table 30: Rest of South America Medical Blood Bag Volume (K) Forecast, by Application 2020 & 2033
- Table 31: Global Medical Blood Bag Revenue million Forecast, by Application 2020 & 2033
- Table 32: Global Medical Blood Bag Volume K Forecast, by Application 2020 & 2033
- Table 33: Global Medical Blood Bag Revenue million Forecast, by Types 2020 & 2033
- Table 34: Global Medical Blood Bag Volume K Forecast, by Types 2020 & 2033
- Table 35: Global Medical Blood Bag Revenue million Forecast, by Country 2020 & 2033
- Table 36: Global Medical Blood Bag Volume K Forecast, by Country 2020 & 2033
- Table 37: United Kingdom Medical Blood Bag Revenue (million) Forecast, by Application 2020 & 2033
- Table 38: United Kingdom Medical Blood Bag Volume (K) Forecast, by Application 2020 & 2033
- Table 39: Germany Medical Blood Bag Revenue (million) Forecast, by Application 2020 & 2033
- Table 40: Germany Medical Blood Bag Volume (K) Forecast, by Application 2020 & 2033
- Table 41: France Medical Blood Bag Revenue (million) Forecast, by Application 2020 & 2033
- Table 42: France Medical Blood Bag Volume (K) Forecast, by Application 2020 & 2033
- Table 43: Italy Medical Blood Bag Revenue (million) Forecast, by Application 2020 & 2033
- Table 44: Italy Medical Blood Bag Volume (K) Forecast, by Application 2020 & 2033
- Table 45: Spain Medical Blood Bag Revenue (million) Forecast, by Application 2020 & 2033
- Table 46: Spain Medical Blood Bag Volume (K) Forecast, by Application 2020 & 2033
- Table 47: Russia Medical Blood Bag Revenue (million) Forecast, by Application 2020 & 2033
- Table 48: Russia Medical Blood Bag Volume (K) Forecast, by Application 2020 & 2033
- Table 49: Benelux Medical Blood Bag Revenue (million) Forecast, by Application 2020 & 2033
- Table 50: Benelux Medical Blood Bag Volume (K) Forecast, by Application 2020 & 2033
- Table 51: Nordics Medical Blood Bag Revenue (million) Forecast, by Application 2020 & 2033
- Table 52: Nordics Medical Blood Bag Volume (K) Forecast, by Application 2020 & 2033
- Table 53: Rest of Europe Medical Blood Bag Revenue (million) Forecast, by Application 2020 & 2033
- Table 54: Rest of Europe Medical Blood Bag Volume (K) Forecast, by Application 2020 & 2033
- Table 55: Global Medical Blood Bag Revenue million Forecast, by Application 2020 & 2033
- Table 56: Global Medical Blood Bag Volume K Forecast, by Application 2020 & 2033
- Table 57: Global Medical Blood Bag Revenue million Forecast, by Types 2020 & 2033
- Table 58: Global Medical Blood Bag Volume K Forecast, by Types 2020 & 2033
- Table 59: Global Medical Blood Bag Revenue million Forecast, by Country 2020 & 2033
- Table 60: Global Medical Blood Bag Volume K Forecast, by Country 2020 & 2033
- Table 61: Turkey Medical Blood Bag Revenue (million) Forecast, by Application 2020 & 2033
- Table 62: Turkey Medical Blood Bag Volume (K) Forecast, by Application 2020 & 2033
- Table 63: Israel Medical Blood Bag Revenue (million) Forecast, by Application 2020 & 2033
- Table 64: Israel Medical Blood Bag Volume (K) Forecast, by Application 2020 & 2033
- Table 65: GCC Medical Blood Bag Revenue (million) Forecast, by Application 2020 & 2033
- Table 66: GCC Medical Blood Bag Volume (K) Forecast, by Application 2020 & 2033
- Table 67: North Africa Medical Blood Bag Revenue (million) Forecast, by Application 2020 & 2033
- Table 68: North Africa Medical Blood Bag Volume (K) Forecast, by Application 2020 & 2033
- Table 69: South Africa Medical Blood Bag Revenue (million) Forecast, by Application 2020 & 2033
- Table 70: South Africa Medical Blood Bag Volume (K) Forecast, by Application 2020 & 2033
- Table 71: Rest of Middle East & Africa Medical Blood Bag Revenue (million) Forecast, by Application 2020 & 2033
- Table 72: Rest of Middle East & Africa Medical Blood Bag Volume (K) Forecast, by Application 2020 & 2033
- Table 73: Global Medical Blood Bag Revenue million Forecast, by Application 2020 & 2033
- Table 74: Global Medical Blood Bag Volume K Forecast, by Application 2020 & 2033
- Table 75: Global Medical Blood Bag Revenue million Forecast, by Types 2020 & 2033
- Table 76: Global Medical Blood Bag Volume K Forecast, by Types 2020 & 2033
- Table 77: Global Medical Blood Bag Revenue million Forecast, by Country 2020 & 2033
- Table 78: Global Medical Blood Bag Volume K Forecast, by Country 2020 & 2033
- Table 79: China Medical Blood Bag Revenue (million) Forecast, by Application 2020 & 2033
- Table 80: China Medical Blood Bag Volume (K) Forecast, by Application 2020 & 2033
- Table 81: India Medical Blood Bag Revenue (million) Forecast, by Application 2020 & 2033
- Table 82: India Medical Blood Bag Volume (K) Forecast, by Application 2020 & 2033
- Table 83: Japan Medical Blood Bag Revenue (million) Forecast, by Application 2020 & 2033
- Table 84: Japan Medical Blood Bag Volume (K) Forecast, by Application 2020 & 2033
- Table 85: South Korea Medical Blood Bag Revenue (million) Forecast, by Application 2020 & 2033
- Table 86: South Korea Medical Blood Bag Volume (K) Forecast, by Application 2020 & 2033
- Table 87: ASEAN Medical Blood Bag Revenue (million) Forecast, by Application 2020 & 2033
- Table 88: ASEAN Medical Blood Bag Volume (K) Forecast, by Application 2020 & 2033
- Table 89: Oceania Medical Blood Bag Revenue (million) Forecast, by Application 2020 & 2033
- Table 90: Oceania Medical Blood Bag Volume (K) Forecast, by Application 2020 & 2033
- Table 91: Rest of Asia Pacific Medical Blood Bag Revenue (million) Forecast, by Application 2020 & 2033
- Table 92: Rest of Asia Pacific Medical Blood Bag Volume (K) Forecast, by Application 2020 & 2033
Frequently Asked Questions
1. What is the projected Compound Annual Growth Rate (CAGR) of the Medical Blood Bag?
The projected CAGR is approximately 7.1%.
2. Which companies are prominent players in the Medical Blood Bag?
Key companies in the market include Fresenius, Haemonetics, JMS, Grifols, TERUMO, Wego, Shandong Zhongbaokang, Nigale Biomedical, Celgene Biomedical, Beijing Bodesant, Macopharma, Poly Medicure, HLL Lifecare.
3. What are the main segments of the Medical Blood Bag?
The market segments include Application, Types.
4. Can you provide details about the market size?
The market size is estimated to be USD 401 million as of 2022.
5. What are some drivers contributing to market growth?
N/A
6. What are the notable trends driving market growth?
N/A
7. Are there any restraints impacting market growth?
N/A
8. Can you provide examples of recent developments in the market?
N/A
9. What pricing options are available for accessing the report?
Pricing options include single-user, multi-user, and enterprise licenses priced at USD 4350.00, USD 6525.00, and USD 8700.00 respectively.
10. Is the market size provided in terms of value or volume?
The market size is provided in terms of value, measured in million and volume, measured in K.
11. Are there any specific market keywords associated with the report?
Yes, the market keyword associated with the report is "Medical Blood Bag," which aids in identifying and referencing the specific market segment covered.
12. How do I determine which pricing option suits my needs best?
The pricing options vary based on user requirements and access needs. Individual users may opt for single-user licenses, while businesses requiring broader access may choose multi-user or enterprise licenses for cost-effective access to the report.
13. Are there any additional resources or data provided in the Medical Blood Bag report?
While the report offers comprehensive insights, it's advisable to review the specific contents or supplementary materials provided to ascertain if additional resources or data are available.
14. How can I stay updated on further developments or reports in the Medical Blood Bag?
To stay informed about further developments, trends, and reports in the Medical Blood Bag, consider subscribing to industry newsletters, following relevant companies and organizations, or regularly checking reputable industry news sources and publications.
Methodology
Step 1 - Identification of Relevant Samples Size from Population Database


Step 2 - Approaches for Defining Global Market Size (Value, Volume* & Price*)

Note*: In applicable scenarios
Step 3 - Data Sources
Primary Research
- Web Analytics
- Survey Reports
- Research Institute
- Latest Research Reports
- Opinion Leaders
Secondary Research
- Annual Reports
- White Paper
- Latest Press Release
- Industry Association
- Paid Database
- Investor Presentations

Step 4 - Data Triangulation
Involves using different sources of information in order to increase the validity of a study
These sources are likely to be stakeholders in a program - participants, other researchers, program staff, other community members, and so on.
Then we put all data in single framework & apply various statistical tools to find out the dynamic on the market.
During the analysis stage, feedback from the stakeholder groups would be compared to determine areas of agreement as well as areas of divergence