MEA Wine Industry Strategic Roadmap: Analysis and Forecasts 2025-2033

MEA Wine Industry by Type (Still Wine, Sparkling Wine, Dessert Wine, Fortified Wine), by Distribution Channel (On-Trade, Off-Trade), by North America (United States, Canada, Mexico), by South America (Brazil, Argentina, Rest of South America), by Europe (United Kingdom, Germany, France, Italy, Spain, Russia, Benelux, Nordics, Rest of Europe), by Middle East & Africa (Turkey, Israel, GCC, North Africa, South Africa, Rest of Middle East & Africa), by Asia Pacific (China, India, Japan, South Korea, ASEAN, Oceania, Rest of Asia Pacific) Forecast 2025-2033

Aug 11 2025
Base Year: 2024

210 Pages
Main Logo

MEA Wine Industry Strategic Roadmap: Analysis and Forecasts 2025-2033


Home
Industries
Food & Beverage
sponsor image
sponsor image
sponsor image
sponsor image

Tailored for you

  • In-depth Analysis Tailored to Specified Regions or Segments
  • Company Profiles Customized to User Preferences
  • Comprehensive Insights Focused on Specific Segments or Regions
  • Customized Evaluation of Competitive Landscape to Meet Your Needs
  • Tailored Customization to Address Other Specific Requirements
Ask for customization


Key Insights

The Middle East and Africa (MEA) wine market, while smaller than established markets in Europe and North America, exhibits promising growth potential. Driven by increasing disposable incomes, particularly in key urban centers, and a burgeoning tourism sector, wine consumption is steadily rising across the region. The preference for specific wine types varies significantly; still wines remain the dominant segment, followed by sparkling and fortified wines, with dessert wines catering to a niche market. The off-trade channel (supermarkets, liquor stores) is currently leading distribution, but the on-trade (restaurants, bars, hotels) sector shows strong potential for growth as the hospitality industry expands. However, cultural and religious factors impose significant constraints on market expansion. Strict regulations regarding alcohol sales and consumption in several MEA countries, coupled with high import tariffs and excise duties, hinder market growth. Furthermore, the relatively high price point of imported wines makes it less accessible to a large segment of the population. While established players like E&J Gallo Winery and Constellation Brands have a significant presence, local and regional wineries are also emerging, capitalizing on increasing consumer demand for regionally sourced products. This creates a dynamic market landscape marked by both global and regional competition.
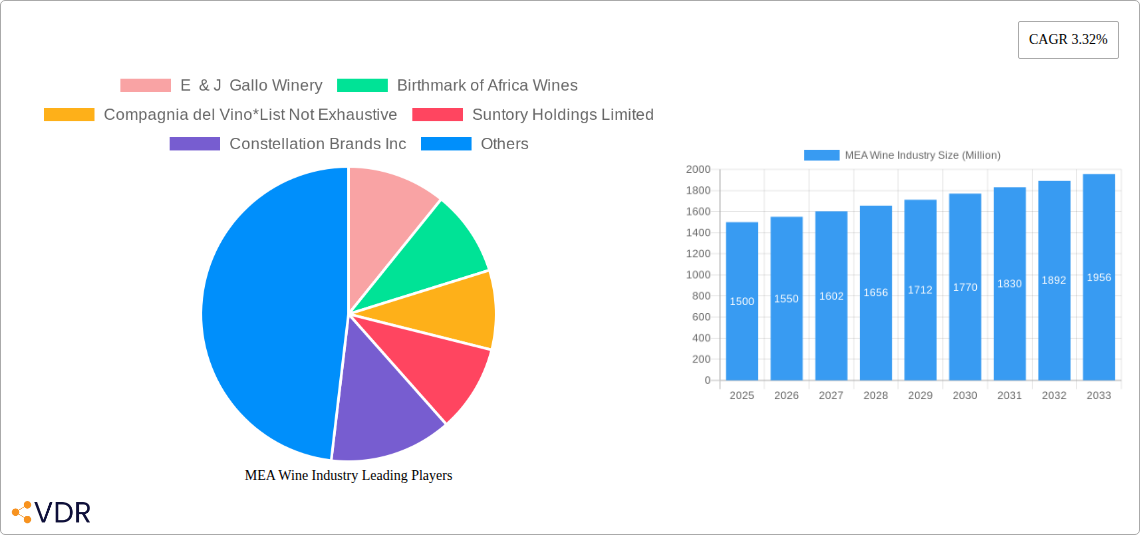
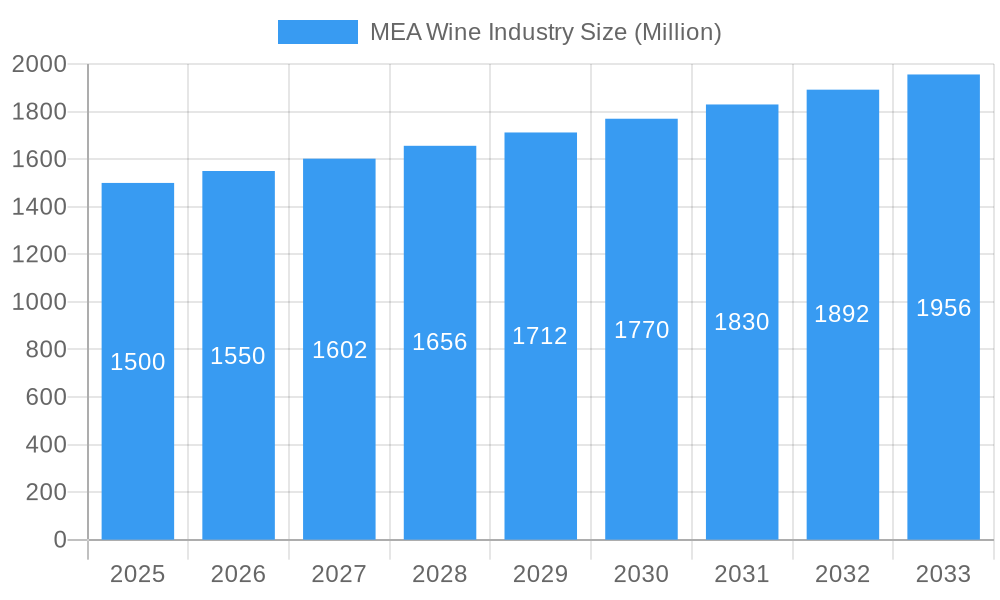
The projected Compound Annual Growth Rate (CAGR) of 3.32% suggests a moderate but consistent expansion of the MEA wine market over the forecast period (2025-2033). This growth is expected to be primarily driven by the increasing popularity of premium wine brands, diversification of product offerings, and targeted marketing campaigns focusing on younger demographics. However, sustainable growth will depend on addressing the current challenges: relaxing restrictive regulations, reducing import duties, and fostering a supportive environment for local wine producers. The focus should be on bridging the gap between high import costs and consumer affordability to enhance accessibility and market penetration. Furthermore, the development of strong distribution networks will be essential in successfully reaching diverse consumer segments across the region's diverse geographic and cultural landscapes.

MEA Wine Industry Research Report - Market Size, Growth & Forecast

MEA Wine Industry Market Report: 2019-2033

This comprehensive report provides a detailed analysis of the Middle East and Africa (MEA) wine industry, encompassing market dynamics, growth trends, key players, and future opportunities. With a study period spanning 2019-2033, a base year of 2025, and a forecast period of 2025-2033, this report is an essential resource for industry professionals, investors, and strategic decision-makers. The report utilizes data from the historical period (2019-2024) and provides insights into the estimated year (2025).

MEA Wine Industry Market Dynamics & Structure

This section analyzes the MEA wine market's competitive landscape, regulatory environment, and technological advancements. The market is characterized by a mix of established international players and emerging local brands. Market concentration is moderate, with a few dominant players alongside numerous smaller producers. Technological innovation, while present, faces barriers including infrastructure limitations and consumer preferences. Regulatory frameworks vary significantly across the MEA region, impacting market access and distribution. Consumer demographics are evolving, with a growing middle class and changing preferences influencing demand. M&A activity has been relatively moderate in recent years, with xx Million units worth of deals recorded between 2019-2024, representing a xx% market share consolidation.

  • Market Concentration: Moderate, with a few dominant players and numerous smaller producers.
  • Technological Innovation: Driven by improvements in winemaking techniques and packaging, but hampered by infrastructural challenges.
  • Regulatory Frameworks: Vary significantly across countries, impacting market access and distribution.
  • Competitive Substitutes: Other alcoholic beverages, soft drinks.
  • End-User Demographics: Growing middle class, increasing disposable income, changing consumer preferences.
  • M&A Trends: Moderate activity in recent years, with xx Million units of deals concluded from 2019 to 2024 resulting in xx% market share consolidation.

MEA Wine Industry Growth Trends & Insights

The MEA wine market exhibits a dynamic growth trajectory, driven by factors such as rising disposable incomes, changing consumer preferences, and increased tourism. The market size experienced steady growth in the historical period, from xx Million units in 2019 to xx Million units in 2024, registering a Compound Annual Growth Rate (CAGR) of xx%. This growth is anticipated to continue throughout the forecast period, reaching xx Million units by 2033. Adoption rates vary significantly across countries, with higher penetration in more developed markets. Technological disruptions, such as e-commerce platforms for wine sales, are gaining traction, reshaping consumer behavior and distribution channels. The shift toward premiumization and a preference for healthier lifestyle choices also influences consumer behavior.

MEA Wine Industry Growth

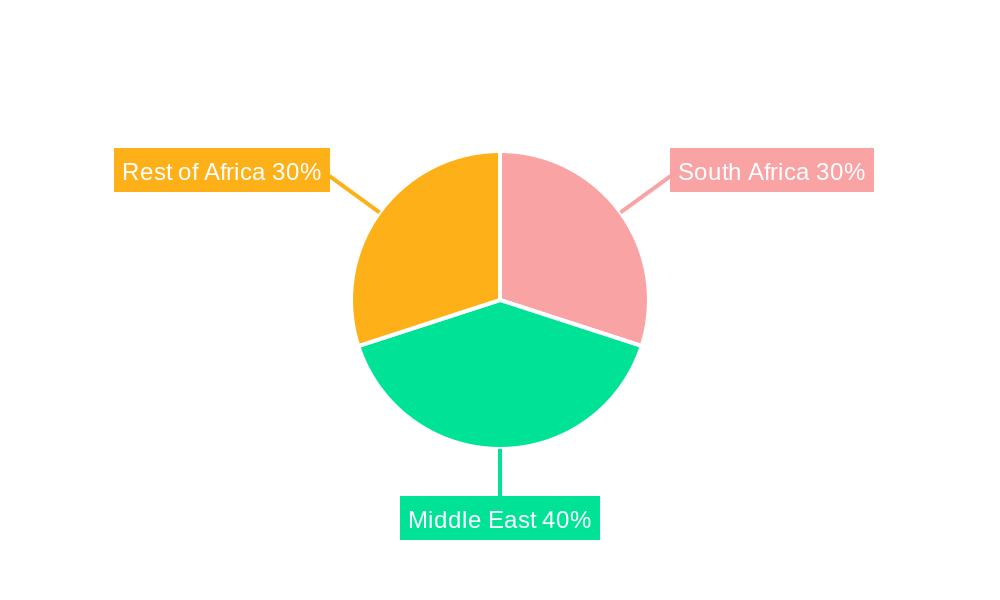
Dominant Regions, Countries, or Segments in MEA Wine Industry

The MEA wine market demonstrates regional disparities in growth and consumption patterns. South Africa currently leads the region in both production and consumption, holding a xx% market share in 2025. Within the MEA, the off-trade channel holds a larger share compared to the on-trade segment, driven by growing retail infrastructure and home consumption. Still wine is the dominant type of wine consumed, representing xx% of the total volume, followed by sparkling wine at xx% and others at xx%. Key drivers for this dominance include robust economic growth, increasing purchasing power, expanding distribution networks and tourism. The growth potential is high in newer markets, where awareness and consumption of wine is still developing.

  • Dominant Region: South Africa
  • Dominant Distribution Channel: Off-Trade
  • Dominant Wine Type: Still Wine
  • Key Growth Drivers: Rising disposable income, improved infrastructure, expanding distribution networks, and tourism growth.

MEA Wine Industry Product Landscape

The MEA wine market features a diverse range of products, catering to varied tastes and preferences. Innovations focus on enhancing quality, offering diverse flavor profiles, and employing sustainable winemaking practices. Premium wines, organic wines, and wines from specific regions are gaining popularity. Advancements in packaging and preservation technologies improve product shelf life and consumer experience. Unique selling propositions revolve around origin, flavor profiles, and sustainability credentials.

Key Drivers, Barriers & Challenges in MEA Wine Industry

Key Drivers:

  • Increasing disposable incomes and changing consumer preferences are fueling demand.
  • Tourism growth enhances exposure to international wines.
  • Growing retail infrastructure improves distribution and accessibility.
  • Governmental initiatives promoting local wine industries in certain regions of MEA spur growth.

Key Challenges:

  • Variable regulatory environments across MEA complicate market entry and distribution.
  • Supply chain inefficiencies, particularly in remote areas, lead to higher costs.
  • Competition from other alcoholic beverages and soft drinks presents a significant challenge.
  • Climate change and its impact on grape yields pose a risk to production.

Emerging Opportunities in MEA Wine Industry

  • Untapped markets in several MEA countries offer significant growth potential.
  • Niche wine segments, such as organic and biodynamic wines, hold promising prospects.
  • E-commerce and direct-to-consumer sales channels provide new avenues for distribution.
  • Collaborations with local producers can help international brands expand their reach and adapt to regional preferences.

Growth Accelerators in the MEA Wine Industry Industry

Strategic partnerships between international winemakers and local producers can facilitate knowledge transfer, enhance product quality, and expand market reach. Technological advancements in winemaking and packaging improve efficiency and reduce production costs. Governmental policies promoting sustainable viticulture and responsible alcohol consumption create favorable conditions for industry growth.

Key Players Shaping the MEA Wine Industry Market

  • E & J Gallo Winery
  • Birthmark of Africa Wines
  • Compagnia del Vino
  • Suntory Holdings Limited
  • Constellation Brands Inc
  • Treasury Wine Estates
  • Accolade Wines
  • The Wine Group
  • Davide Campari-Milano N V
  • Pernod Ricard

Notable Milestones in MEA Wine Industry Sector

  • December 2021: Launch of Princi wines (Pinal, Merlot, Cabernet Sauvignon) in Nigeria by Nigerian pharmacists in partnership with French winemakers.
  • April 2021: Birthmark of Africa Wines launches a new collection of wines in South Africa.
  • April 2020: Spinneys Liquor launches a home delivery service for wine, beer, and spirits in Abu Dhabi.

In-Depth MEA Wine Industry Market Outlook

The MEA wine market is poised for robust growth over the forecast period, driven by expanding consumer base, rising disposable incomes, and a growing preference for premium and diversified wine offerings. Strategic partnerships, technological innovations, and supportive government policies will further accelerate market expansion. Companies focusing on sustainable practices, unique regional offerings, and efficient distribution networks will be well-positioned to capitalize on emerging opportunities and shape the future of the MEA wine industry.

MEA Wine Industry Segmentation

  • 1. Type
    • 1.1. Still Wine
    • 1.2. Sparkling Wine
    • 1.3. Dessert Wine
    • 1.4. Fortified Wine
  • 2. Distribution Channel
    • 2.1. On-Trade
    • 2.2. Off-Trade
      • 2.2.1. Supermarkets/Hypermarkets
      • 2.2.2. Specialty Stores
      • 2.2.3. Other Distribution Channels

MEA Wine Industry Segmentation By Geography

  • 1. North America
    • 1.1. United States
    • 1.2. Canada
    • 1.3. Mexico
  • 2. South America
    • 2.1. Brazil
    • 2.2. Argentina
    • 2.3. Rest of South America
  • 3. Europe
    • 3.1. United Kingdom
    • 3.2. Germany
    • 3.3. France
    • 3.4. Italy
    • 3.5. Spain
    • 3.6. Russia
    • 3.7. Benelux
    • 3.8. Nordics
    • 3.9. Rest of Europe
  • 4. Middle East & Africa
    • 4.1. Turkey
    • 4.2. Israel
    • 4.3. GCC
    • 4.4. North Africa
    • 4.5. South Africa
    • 4.6. Rest of Middle East & Africa
  • 5. Asia Pacific
    • 5.1. China
    • 5.2. India
    • 5.3. Japan
    • 5.4. South Korea
    • 5.5. ASEAN
    • 5.6. Oceania
    • 5.7. Rest of Asia Pacific
MEA Wine Industry Regional Share


MEA Wine Industry REPORT HIGHLIGHTS

AspectsDetails
Study Period 2019-2033
Base Year 2024
Estimated Year 2025
Forecast Period2025-2033
Historical Period2019-2024
Growth RateCAGR of 3.32% from 2019-2033
Segmentation
    • By Type
      • Still Wine
      • Sparkling Wine
      • Dessert Wine
      • Fortified Wine
    • By Distribution Channel
      • On-Trade
      • Off-Trade
        • Supermarkets/Hypermarkets
        • Specialty Stores
        • Other Distribution Channels
  • By Geography
    • North America
      • United States
      • Canada
      • Mexico
    • South America
      • Brazil
      • Argentina
      • Rest of South America
    • Europe
      • United Kingdom
      • Germany
      • France
      • Italy
      • Spain
      • Russia
      • Benelux
      • Nordics
      • Rest of Europe
    • Middle East & Africa
      • Turkey
      • Israel
      • GCC
      • North Africa
      • South Africa
      • Rest of Middle East & Africa
    • Asia Pacific
      • China
      • India
      • Japan
      • South Korea
      • ASEAN
      • Oceania
      • Rest of Asia Pacific


Table of Contents

  1. 1. Introduction
    • 1.1. Research Scope
    • 1.2. Market Segmentation
    • 1.3. Research Methodology
    • 1.4. Definitions and Assumptions
  2. 2. Executive Summary
    • 2.1. Introduction
  3. 3. Market Dynamics
    • 3.1. Introduction
      • 3.2. Market Drivers
        • 3.2.1. Increasing Focus on Maintaining Health and Well-Being; Launching Supplements For Specific Purposes and Targeted Population
      • 3.3. Market Restrains
        • 3.3.1. Supplement Consumption and Their Side-effects; Inclination Towards Substitute Products
      • 3.4. Market Trends
        • 3.4.1. Changing Lifestyle and Consumption Habits of Wine
  4. 4. Market Factor Analysis
    • 4.1. Porters Five Forces
    • 4.2. Supply/Value Chain
    • 4.3. PESTEL analysis
    • 4.4. Market Entropy
    • 4.5. Patent/Trademark Analysis
  5. 5. Global MEA Wine Industry Analysis, Insights and Forecast, 2019-2031
    • 5.1. Market Analysis, Insights and Forecast - by Type
      • 5.1.1. Still Wine
      • 5.1.2. Sparkling Wine
      • 5.1.3. Dessert Wine
      • 5.1.4. Fortified Wine
    • 5.2. Market Analysis, Insights and Forecast - by Distribution Channel
      • 5.2.1. On-Trade
      • 5.2.2. Off-Trade
        • 5.2.2.1. Supermarkets/Hypermarkets
        • 5.2.2.2. Specialty Stores
        • 5.2.2.3. Other Distribution Channels
    • 5.3. Market Analysis, Insights and Forecast - by Region
      • 5.3.1. North America
      • 5.3.2. South America
      • 5.3.3. Europe
      • 5.3.4. Middle East & Africa
      • 5.3.5. Asia Pacific
  6. 6. North America MEA Wine Industry Analysis, Insights and Forecast, 2019-2031
    • 6.1. Market Analysis, Insights and Forecast - by Type
      • 6.1.1. Still Wine
      • 6.1.2. Sparkling Wine
      • 6.1.3. Dessert Wine
      • 6.1.4. Fortified Wine
    • 6.2. Market Analysis, Insights and Forecast - by Distribution Channel
      • 6.2.1. On-Trade
      • 6.2.2. Off-Trade
        • 6.2.2.1. Supermarkets/Hypermarkets
        • 6.2.2.2. Specialty Stores
        • 6.2.2.3. Other Distribution Channels
  7. 7. South America MEA Wine Industry Analysis, Insights and Forecast, 2019-2031
    • 7.1. Market Analysis, Insights and Forecast - by Type
      • 7.1.1. Still Wine
      • 7.1.2. Sparkling Wine
      • 7.1.3. Dessert Wine
      • 7.1.4. Fortified Wine
    • 7.2. Market Analysis, Insights and Forecast - by Distribution Channel
      • 7.2.1. On-Trade
      • 7.2.2. Off-Trade
        • 7.2.2.1. Supermarkets/Hypermarkets
        • 7.2.2.2. Specialty Stores
        • 7.2.2.3. Other Distribution Channels
  8. 8. Europe MEA Wine Industry Analysis, Insights and Forecast, 2019-2031
    • 8.1. Market Analysis, Insights and Forecast - by Type
      • 8.1.1. Still Wine
      • 8.1.2. Sparkling Wine
      • 8.1.3. Dessert Wine
      • 8.1.4. Fortified Wine
    • 8.2. Market Analysis, Insights and Forecast - by Distribution Channel
      • 8.2.1. On-Trade
      • 8.2.2. Off-Trade
        • 8.2.2.1. Supermarkets/Hypermarkets
        • 8.2.2.2. Specialty Stores
        • 8.2.2.3. Other Distribution Channels
  9. 9. Middle East & Africa MEA Wine Industry Analysis, Insights and Forecast, 2019-2031
    • 9.1. Market Analysis, Insights and Forecast - by Type
      • 9.1.1. Still Wine
      • 9.1.2. Sparkling Wine
      • 9.1.3. Dessert Wine
      • 9.1.4. Fortified Wine
    • 9.2. Market Analysis, Insights and Forecast - by Distribution Channel
      • 9.2.1. On-Trade
      • 9.2.2. Off-Trade
        • 9.2.2.1. Supermarkets/Hypermarkets
        • 9.2.2.2. Specialty Stores
        • 9.2.2.3. Other Distribution Channels
  10. 10. Asia Pacific MEA Wine Industry Analysis, Insights and Forecast, 2019-2031
    • 10.1. Market Analysis, Insights and Forecast - by Type
      • 10.1.1. Still Wine
      • 10.1.2. Sparkling Wine
      • 10.1.3. Dessert Wine
      • 10.1.4. Fortified Wine
    • 10.2. Market Analysis, Insights and Forecast - by Distribution Channel
      • 10.2.1. On-Trade
      • 10.2.2. Off-Trade
        • 10.2.2.1. Supermarkets/Hypermarkets
        • 10.2.2.2. Specialty Stores
        • 10.2.2.3. Other Distribution Channels
  11. 11. North America MEA Wine Industry Analysis, Insights and Forecast, 2019-2031
      • 11.1. Market Analysis, Insights and Forecast - By Country/Sub-region
        • 11.1.1 United States
        • 11.1.2 Canada
        • 11.1.3 Mexico
        • 11.1.4 Rest of North America
  12. 12. Europe MEA Wine Industry Analysis, Insights and Forecast, 2019-2031
      • 12.1. Market Analysis, Insights and Forecast - By Country/Sub-region
        • 12.1.1 United Kingdom
        • 12.1.2 Germany
        • 12.1.3 France
        • 12.1.4 Russia
        • 12.1.5 Italy
        • 12.1.6 Spain
        • 12.1.7 Rest of Europe
  13. 13. Asia Pacific MEA Wine Industry Analysis, Insights and Forecast, 2019-2031
      • 13.1. Market Analysis, Insights and Forecast - By Country/Sub-region
        • 13.1.1 India
        • 13.1.2 China
        • 13.1.3 Japan
        • 13.1.4 Australia
        • 13.1.5 Rest of Asia Pacific
  14. 14. South America MEA Wine Industry Analysis, Insights and Forecast, 2019-2031
      • 14.1. Market Analysis, Insights and Forecast - By Country/Sub-region
        • 14.1.1 Brazil
        • 14.1.2 Argentina
        • 14.1.3 Rest of South America
  15. 15. Middle East MEA Wine Industry Analysis, Insights and Forecast, 2019-2031
      • 15.1. Market Analysis, Insights and Forecast - By Country/Sub-region
        • 15.1.1.
  16. 16. South Africa MEA Wine Industry Analysis, Insights and Forecast, 2019-2031
      • 16.1. Market Analysis, Insights and Forecast - By Country/Sub-region
        • 16.1.1 Saudi Arabia
        • 16.1.2 Rest of Middle East
  17. 17. Competitive Analysis
    • 17.1. Global Market Share Analysis 2024
      • 17.2. Company Profiles
        • 17.2.1 E & J Gallo Winery
          • 17.2.1.1. Overview
          • 17.2.1.2. Products
          • 17.2.1.3. SWOT Analysis
          • 17.2.1.4. Recent Developments
          • 17.2.1.5. Financials (Based on Availability)
        • 17.2.2 Birthmark of Africa Wines
          • 17.2.2.1. Overview
          • 17.2.2.2. Products
          • 17.2.2.3. SWOT Analysis
          • 17.2.2.4. Recent Developments
          • 17.2.2.5. Financials (Based on Availability)
        • 17.2.3 Compagnia del Vino*List Not Exhaustive
          • 17.2.3.1. Overview
          • 17.2.3.2. Products
          • 17.2.3.3. SWOT Analysis
          • 17.2.3.4. Recent Developments
          • 17.2.3.5. Financials (Based on Availability)
        • 17.2.4 Suntory Holdings Limited
          • 17.2.4.1. Overview
          • 17.2.4.2. Products
          • 17.2.4.3. SWOT Analysis
          • 17.2.4.4. Recent Developments
          • 17.2.4.5. Financials (Based on Availability)
        • 17.2.5 Constellation Brands Inc
          • 17.2.5.1. Overview
          • 17.2.5.2. Products
          • 17.2.5.3. SWOT Analysis
          • 17.2.5.4. Recent Developments
          • 17.2.5.5. Financials (Based on Availability)
        • 17.2.6 Treasury Wine Estates
          • 17.2.6.1. Overview
          • 17.2.6.2. Products
          • 17.2.6.3. SWOT Analysis
          • 17.2.6.4. Recent Developments
          • 17.2.6.5. Financials (Based on Availability)
        • 17.2.7 Accolade Wines
          • 17.2.7.1. Overview
          • 17.2.7.2. Products
          • 17.2.7.3. SWOT Analysis
          • 17.2.7.4. Recent Developments
          • 17.2.7.5. Financials (Based on Availability)
        • 17.2.8 The Wine Group
          • 17.2.8.1. Overview
          • 17.2.8.2. Products
          • 17.2.8.3. SWOT Analysis
          • 17.2.8.4. Recent Developments
          • 17.2.8.5. Financials (Based on Availability)
        • 17.2.9 Davide Campari-Milano N V
          • 17.2.9.1. Overview
          • 17.2.9.2. Products
          • 17.2.9.3. SWOT Analysis
          • 17.2.9.4. Recent Developments
          • 17.2.9.5. Financials (Based on Availability)
        • 17.2.10 Pernod Ricard
          • 17.2.10.1. Overview
          • 17.2.10.2. Products
          • 17.2.10.3. SWOT Analysis
          • 17.2.10.4. Recent Developments
          • 17.2.10.5. Financials (Based on Availability)

List of Figures

  1. Figure 1: Global MEA Wine Industry Revenue Breakdown (Million, %) by Region 2024 & 2032
  2. Figure 2: North America MEA Wine Industry Revenue (Million), by Country 2024 & 2032
  3. Figure 3: North America MEA Wine Industry Revenue Share (%), by Country 2024 & 2032
  4. Figure 4: Europe MEA Wine Industry Revenue (Million), by Country 2024 & 2032
  5. Figure 5: Europe MEA Wine Industry Revenue Share (%), by Country 2024 & 2032
  6. Figure 6: Asia Pacific MEA Wine Industry Revenue (Million), by Country 2024 & 2032
  7. Figure 7: Asia Pacific MEA Wine Industry Revenue Share (%), by Country 2024 & 2032
  8. Figure 8: South America MEA Wine Industry Revenue (Million), by Country 2024 & 2032
  9. Figure 9: South America MEA Wine Industry Revenue Share (%), by Country 2024 & 2032
  10. Figure 10: Middle East MEA Wine Industry Revenue (Million), by Country 2024 & 2032
  11. Figure 11: Middle East MEA Wine Industry Revenue Share (%), by Country 2024 & 2032
  12. Figure 12: South Africa MEA Wine Industry Revenue (Million), by Country 2024 & 2032
  13. Figure 13: South Africa MEA Wine Industry Revenue Share (%), by Country 2024 & 2032
  14. Figure 14: North America MEA Wine Industry Revenue (Million), by Type 2024 & 2032
  15. Figure 15: North America MEA Wine Industry Revenue Share (%), by Type 2024 & 2032
  16. Figure 16: North America MEA Wine Industry Revenue (Million), by Distribution Channel 2024 & 2032
  17. Figure 17: North America MEA Wine Industry Revenue Share (%), by Distribution Channel 2024 & 2032
  18. Figure 18: North America MEA Wine Industry Revenue (Million), by Country 2024 & 2032
  19. Figure 19: North America MEA Wine Industry Revenue Share (%), by Country 2024 & 2032
  20. Figure 20: South America MEA Wine Industry Revenue (Million), by Type 2024 & 2032
  21. Figure 21: South America MEA Wine Industry Revenue Share (%), by Type 2024 & 2032
  22. Figure 22: South America MEA Wine Industry Revenue (Million), by Distribution Channel 2024 & 2032
  23. Figure 23: South America MEA Wine Industry Revenue Share (%), by Distribution Channel 2024 & 2032
  24. Figure 24: South America MEA Wine Industry Revenue (Million), by Country 2024 & 2032
  25. Figure 25: South America MEA Wine Industry Revenue Share (%), by Country 2024 & 2032
  26. Figure 26: Europe MEA Wine Industry Revenue (Million), by Type 2024 & 2032
  27. Figure 27: Europe MEA Wine Industry Revenue Share (%), by Type 2024 & 2032
  28. Figure 28: Europe MEA Wine Industry Revenue (Million), by Distribution Channel 2024 & 2032
  29. Figure 29: Europe MEA Wine Industry Revenue Share (%), by Distribution Channel 2024 & 2032
  30. Figure 30: Europe MEA Wine Industry Revenue (Million), by Country 2024 & 2032
  31. Figure 31: Europe MEA Wine Industry Revenue Share (%), by Country 2024 & 2032
  32. Figure 32: Middle East & Africa MEA Wine Industry Revenue (Million), by Type 2024 & 2032
  33. Figure 33: Middle East & Africa MEA Wine Industry Revenue Share (%), by Type 2024 & 2032
  34. Figure 34: Middle East & Africa MEA Wine Industry Revenue (Million), by Distribution Channel 2024 & 2032
  35. Figure 35: Middle East & Africa MEA Wine Industry Revenue Share (%), by Distribution Channel 2024 & 2032
  36. Figure 36: Middle East & Africa MEA Wine Industry Revenue (Million), by Country 2024 & 2032
  37. Figure 37: Middle East & Africa MEA Wine Industry Revenue Share (%), by Country 2024 & 2032
  38. Figure 38: Asia Pacific MEA Wine Industry Revenue (Million), by Type 2024 & 2032
  39. Figure 39: Asia Pacific MEA Wine Industry Revenue Share (%), by Type 2024 & 2032
  40. Figure 40: Asia Pacific MEA Wine Industry Revenue (Million), by Distribution Channel 2024 & 2032
  41. Figure 41: Asia Pacific MEA Wine Industry Revenue Share (%), by Distribution Channel 2024 & 2032
  42. Figure 42: Asia Pacific MEA Wine Industry Revenue (Million), by Country 2024 & 2032
  43. Figure 43: Asia Pacific MEA Wine Industry Revenue Share (%), by Country 2024 & 2032

List of Tables

  1. Table 1: Global MEA Wine Industry Revenue Million Forecast, by Region 2019 & 2032
  2. Table 2: Global MEA Wine Industry Revenue Million Forecast, by Type 2019 & 2032
  3. Table 3: Global MEA Wine Industry Revenue Million Forecast, by Distribution Channel 2019 & 2032
  4. Table 4: Global MEA Wine Industry Revenue Million Forecast, by Region 2019 & 2032
  5. Table 5: Global MEA Wine Industry Revenue Million Forecast, by Country 2019 & 2032
  6. Table 6: United States MEA Wine Industry Revenue (Million) Forecast, by Application 2019 & 2032
  7. Table 7: Canada MEA Wine Industry Revenue (Million) Forecast, by Application 2019 & 2032
  8. Table 8: Mexico MEA Wine Industry Revenue (Million) Forecast, by Application 2019 & 2032
  9. Table 9: Rest of North America MEA Wine Industry Revenue (Million) Forecast, by Application 2019 & 2032
  10. Table 10: Global MEA Wine Industry Revenue Million Forecast, by Country 2019 & 2032
  11. Table 11: United Kingdom MEA Wine Industry Revenue (Million) Forecast, by Application 2019 & 2032
  12. Table 12: Germany MEA Wine Industry Revenue (Million) Forecast, by Application 2019 & 2032
  13. Table 13: France MEA Wine Industry Revenue (Million) Forecast, by Application 2019 & 2032
  14. Table 14: Russia MEA Wine Industry Revenue (Million) Forecast, by Application 2019 & 2032
  15. Table 15: Italy MEA Wine Industry Revenue (Million) Forecast, by Application 2019 & 2032
  16. Table 16: Spain MEA Wine Industry Revenue (Million) Forecast, by Application 2019 & 2032
  17. Table 17: Rest of Europe MEA Wine Industry Revenue (Million) Forecast, by Application 2019 & 2032
  18. Table 18: Global MEA Wine Industry Revenue Million Forecast, by Country 2019 & 2032
  19. Table 19: India MEA Wine Industry Revenue (Million) Forecast, by Application 2019 & 2032
  20. Table 20: China MEA Wine Industry Revenue (Million) Forecast, by Application 2019 & 2032
  21. Table 21: Japan MEA Wine Industry Revenue (Million) Forecast, by Application 2019 & 2032
  22. Table 22: Australia MEA Wine Industry Revenue (Million) Forecast, by Application 2019 & 2032
  23. Table 23: Rest of Asia Pacific MEA Wine Industry Revenue (Million) Forecast, by Application 2019 & 2032
  24. Table 24: Global MEA Wine Industry Revenue Million Forecast, by Country 2019 & 2032
  25. Table 25: Brazil MEA Wine Industry Revenue (Million) Forecast, by Application 2019 & 2032
  26. Table 26: Argentina MEA Wine Industry Revenue (Million) Forecast, by Application 2019 & 2032
  27. Table 27: Rest of South America MEA Wine Industry Revenue (Million) Forecast, by Application 2019 & 2032
  28. Table 28: Global MEA Wine Industry Revenue Million Forecast, by Country 2019 & 2032
  29. Table 29: MEA Wine Industry Revenue (Million) Forecast, by Application 2019 & 2032
  30. Table 30: Global MEA Wine Industry Revenue Million Forecast, by Country 2019 & 2032
  31. Table 31: Saudi Arabia MEA Wine Industry Revenue (Million) Forecast, by Application 2019 & 2032
  32. Table 32: Rest of Middle East MEA Wine Industry Revenue (Million) Forecast, by Application 2019 & 2032
  33. Table 33: Global MEA Wine Industry Revenue Million Forecast, by Type 2019 & 2032
  34. Table 34: Global MEA Wine Industry Revenue Million Forecast, by Distribution Channel 2019 & 2032
  35. Table 35: Global MEA Wine Industry Revenue Million Forecast, by Country 2019 & 2032
  36. Table 36: United States MEA Wine Industry Revenue (Million) Forecast, by Application 2019 & 2032
  37. Table 37: Canada MEA Wine Industry Revenue (Million) Forecast, by Application 2019 & 2032
  38. Table 38: Mexico MEA Wine Industry Revenue (Million) Forecast, by Application 2019 & 2032
  39. Table 39: Global MEA Wine Industry Revenue Million Forecast, by Type 2019 & 2032
  40. Table 40: Global MEA Wine Industry Revenue Million Forecast, by Distribution Channel 2019 & 2032
  41. Table 41: Global MEA Wine Industry Revenue Million Forecast, by Country 2019 & 2032
  42. Table 42: Brazil MEA Wine Industry Revenue (Million) Forecast, by Application 2019 & 2032
  43. Table 43: Argentina MEA Wine Industry Revenue (Million) Forecast, by Application 2019 & 2032
  44. Table 44: Rest of South America MEA Wine Industry Revenue (Million) Forecast, by Application 2019 & 2032
  45. Table 45: Global MEA Wine Industry Revenue Million Forecast, by Type 2019 & 2032
  46. Table 46: Global MEA Wine Industry Revenue Million Forecast, by Distribution Channel 2019 & 2032
  47. Table 47: Global MEA Wine Industry Revenue Million Forecast, by Country 2019 & 2032
  48. Table 48: United Kingdom MEA Wine Industry Revenue (Million) Forecast, by Application 2019 & 2032
  49. Table 49: Germany MEA Wine Industry Revenue (Million) Forecast, by Application 2019 & 2032
  50. Table 50: France MEA Wine Industry Revenue (Million) Forecast, by Application 2019 & 2032
  51. Table 51: Italy MEA Wine Industry Revenue (Million) Forecast, by Application 2019 & 2032
  52. Table 52: Spain MEA Wine Industry Revenue (Million) Forecast, by Application 2019 & 2032
  53. Table 53: Russia MEA Wine Industry Revenue (Million) Forecast, by Application 2019 & 2032
  54. Table 54: Benelux MEA Wine Industry Revenue (Million) Forecast, by Application 2019 & 2032
  55. Table 55: Nordics MEA Wine Industry Revenue (Million) Forecast, by Application 2019 & 2032
  56. Table 56: Rest of Europe MEA Wine Industry Revenue (Million) Forecast, by Application 2019 & 2032
  57. Table 57: Global MEA Wine Industry Revenue Million Forecast, by Type 2019 & 2032
  58. Table 58: Global MEA Wine Industry Revenue Million Forecast, by Distribution Channel 2019 & 2032
  59. Table 59: Global MEA Wine Industry Revenue Million Forecast, by Country 2019 & 2032
  60. Table 60: Turkey MEA Wine Industry Revenue (Million) Forecast, by Application 2019 & 2032
  61. Table 61: Israel MEA Wine Industry Revenue (Million) Forecast, by Application 2019 & 2032
  62. Table 62: GCC MEA Wine Industry Revenue (Million) Forecast, by Application 2019 & 2032
  63. Table 63: North Africa MEA Wine Industry Revenue (Million) Forecast, by Application 2019 & 2032
  64. Table 64: South Africa MEA Wine Industry Revenue (Million) Forecast, by Application 2019 & 2032
  65. Table 65: Rest of Middle East & Africa MEA Wine Industry Revenue (Million) Forecast, by Application 2019 & 2032
  66. Table 66: Global MEA Wine Industry Revenue Million Forecast, by Type 2019 & 2032
  67. Table 67: Global MEA Wine Industry Revenue Million Forecast, by Distribution Channel 2019 & 2032
  68. Table 68: Global MEA Wine Industry Revenue Million Forecast, by Country 2019 & 2032
  69. Table 69: China MEA Wine Industry Revenue (Million) Forecast, by Application 2019 & 2032
  70. Table 70: India MEA Wine Industry Revenue (Million) Forecast, by Application 2019 & 2032
  71. Table 71: Japan MEA Wine Industry Revenue (Million) Forecast, by Application 2019 & 2032
  72. Table 72: South Korea MEA Wine Industry Revenue (Million) Forecast, by Application 2019 & 2032
  73. Table 73: ASEAN MEA Wine Industry Revenue (Million) Forecast, by Application 2019 & 2032
  74. Table 74: Oceania MEA Wine Industry Revenue (Million) Forecast, by Application 2019 & 2032
  75. Table 75: Rest of Asia Pacific MEA Wine Industry Revenue (Million) Forecast, by Application 2019 & 2032


Frequently Asked Questions

1. What is the projected Compound Annual Growth Rate (CAGR) of the MEA Wine Industry?

The projected CAGR is approximately 3.32%.

2. Which companies are prominent players in the MEA Wine Industry?

Key companies in the market include E & J Gallo Winery, Birthmark of Africa Wines, Compagnia del Vino*List Not Exhaustive, Suntory Holdings Limited, Constellation Brands Inc, Treasury Wine Estates, Accolade Wines, The Wine Group, Davide Campari-Milano N V, Pernod Ricard.

3. What are the main segments of the MEA Wine Industry?

The market segments include Type, Distribution Channel.

4. Can you provide details about the market size?

The market size is estimated to be USD XX Million as of 2022.

5. What are some drivers contributing to market growth?

Increasing Focus on Maintaining Health and Well-Being; Launching Supplements For Specific Purposes and Targeted Population.

6. What are the notable trends driving market growth?

Changing Lifestyle and Consumption Habits of Wine.

7. Are there any restraints impacting market growth?

Supplement Consumption and Their Side-effects; Inclination Towards Substitute Products.

8. Can you provide examples of recent developments in the market?

In December 2021, Nigerian pharmacists launched new wine brands in Nigeria. He partnered with leading wine makers in France to produce Princi wines like Princi Pinal, Princi Merlot, and Princi Cabernet Sauvignon for the Nigerian market.

9. What pricing options are available for accessing the report?

Pricing options include single-user, multi-user, and enterprise licenses priced at USD 4750, USD 4950, and USD 6800 respectively.

10. Is the market size provided in terms of value or volume?

The market size is provided in terms of value, measured in Million.

11. Are there any specific market keywords associated with the report?

Yes, the market keyword associated with the report is "MEA Wine Industry," which aids in identifying and referencing the specific market segment covered.

12. How do I determine which pricing option suits my needs best?

The pricing options vary based on user requirements and access needs. Individual users may opt for single-user licenses, while businesses requiring broader access may choose multi-user or enterprise licenses for cost-effective access to the report.

13. Are there any additional resources or data provided in the MEA Wine Industry report?

While the report offers comprehensive insights, it's advisable to review the specific contents or supplementary materials provided to ascertain if additional resources or data are available.

14. How can I stay updated on further developments or reports in the MEA Wine Industry?

To stay informed about further developments, trends, and reports in the MEA Wine Industry, consider subscribing to industry newsletters, following relevant companies and organizations, or regularly checking reputable industry news sources and publications.


Methodology

Step 1 - Identification of Relevant Samples Size from Population Database

Step Chart
Bar Chart
Method Chart

Step 2 - Approaches for Defining Global Market Size (Value, Volume* & Price*)

Approach Chart
Top-down and bottom-up approaches are used to validate the global market size and estimate the market size for manufactures, regional segments, product, and application.

Note*: In applicable scenarios

Step 3 - Data Sources

Primary Research

  • Web Analytics
  • Survey Reports
  • Research Institute
  • Latest Research Reports
  • Opinion Leaders

Secondary Research

  • Annual Reports
  • White Paper
  • Latest Press Release
  • Industry Association
  • Paid Database
  • Investor Presentations
Analyst Chart

Step 4 - Data Triangulation

Involves using different sources of information in order to increase the validity of a study

These sources are likely to be stakeholders in a program - participants, other researchers, program staff, other community members, and so on.

Then we put all data in single framework & apply various statistical tools to find out the dynamic on the market.

During the analysis stage, feedback from the stakeholder groups would be compared to determine areas of agreement as well as areas of divergence

Additionally, after gathering mixed and scattered data from a wide range of sources, data is triangulated and correlated to come up with estimated figures which are further validated through primary mediums or industry experts, opinion leaders.

About Visionary Data Reports

Visionary Data Reports provides future-focused market research, advanced analytics, and strategic insights for technology, healthcare, green energy, and finance. Our reports help you anticipate trends, innovate, and lead in your industry. Our expert team combines primary research, data science, and industry knowledge to deliver actionable intelligence. We offer syndicated reports, custom analytics, and consulting services tailored to your business needs. At Visionary Data Reports, we are committed to quality, transparency, and client satisfaction. Every report is rigorously validated to ensure accuracy and relevance. Our global perspective and forward-thinking approach help you understand both current and emerging market dynamics.

Stay ahead with Visionary Data Reports. Subscribe to our newsletter for the latest insights and research highlights, and follow us on social media for real-time updates. Visionary Data Reports – Your Guide to Tomorrow’s Opportunities.

artwork spiralartwork spiralRelated Reports
artwork underline

Tinned Fish Market Market Demand Dynamics: Insights 2025-2033

Explore the booming Tinned Fish Market analysis, CAGR 6.20%, key drivers, trends, and growth opportunities from 2019-2033. Discover market size, segments, and leading companies in this essential food sector.

December 2025
Base Year: 2024
No Of Pages: 234
Price: $4750

Analyzing the Future of North America Soy Beverages Market: Key Trends to 2033

Explore the booming North America Soy Beverages Market, driven by plant-based trends and nutritional benefits. Discover market size, CAGR of 6.14%, key drivers, and segment analysis from 2019-2033.

December 2025
Base Year: 2024
No Of Pages: 234
Price: $4750

Consumer-Centric Trends in North America Collagen Ingredients Market Industry

Explore the booming North America Collagen Ingredients Market, projected to reach USD 2,600 million by 2025 with a 5.30% CAGR. Discover key drivers like health supplements and cosmetics, dominant animal-based forms, and evolving trends.

December 2025
Base Year: 2024
No Of Pages: 210
Price: $4750

Demand Patterns in Europe Cheese Market Market: Projections to 2033

Explore the booming Europe cheese market, projected for significant growth from 2025-2033, driven by rising demand for natural and specialty cheeses, evolving distribution channels, and innovative trends. Get market size, CAGR, key drivers, and company insights.

December 2025
Base Year: 2024
No Of Pages: 180
Price: $3800

Netherlands Food Service Industry Market’s Growth Catalysts

The size of the Netherlands Food Service Industry market was valued at USD XX Million in 2024 and is projected to reach USD XXX Million by 2033, with an expected CAGR of 5.11% during the forecast period.

December 2025
Base Year: 2024
No Of Pages: 197
Price: $3800

North America Food Fortification Market Market Predictions: Growth and Size Trends to 2033

The size of the North America Food Fortification Market market was valued at USD XX Million in 2024 and is projected to reach USD XXX Million by 2033, with an expected CAGR of 6.20% during the forecast period.

November 2025
Base Year: 2024
No Of Pages: 234
Price: $4750

Malted Milk Market Analysis Uncovered: Market Drivers and Forecasts 2025-2033

The size of the Malted Milk Market market was valued at USD XX Million in 2024 and is projected to reach USD XXX Million by 2033, with an expected CAGR of 8.60% during the forecast period.

November 2025
Base Year: 2024
No Of Pages: 234
Price: $4750

Chocolate Spread Market Market Dynamics: Drivers and Barriers to Growth 2025-2033

Explore the booming Chocolate Spread Market. Discover key insights, market size projections, growth drivers like nut butter and online retail, and regional trends from 2019-2033.

November 2025
Base Year: 2024
No Of Pages: 234
Price: $4750

Non Thermal Processing Market Market’s Role in Emerging Tech: Insights and Projections 2025-2033

Explore the booming Non-Thermal Processing Market, driven by demand for safer, nutritious foods. Discover key technologies like HPP, PEF, and market trends across beverages, meat, dairy, and fruits. Get market size, CAGR, and regional insights for 2025-2033.

November 2025
Base Year: 2024
No Of Pages: 234
Price: $4750

North America Carrageenan Industry Market Expansion: Growth Outlook 2025-2033

The size of the North America Carrageenan Industry market was valued at USD XX Million in 2024 and is projected to reach USD XXX Million by 2033, with an expected CAGR of 4.78% during the forecast period.

November 2025
Base Year: 2024
No Of Pages: 210
Price: $4750

USA Ice Cream Market Market’s Consumer Preferences: Trends and Analysis 2025-2033

Explore the booming USA ice cream market with insights into key drivers, trends, and growth forecasts from 2025-2033. Discover market size, CAGR, restraints, and leading companies.

November 2025
Base Year: 2024
No Of Pages: 197
Price: $3800

Exploring Juices Market Market Ecosystem: Insights to 2033

Explore the booming Juices Market with a projected CAGR of 12.50%. Discover key drivers like health consciousness, innovative products, and evolving distribution. Get insights into market size, growth, and regional shares.

November 2025
Base Year: 2024
No Of Pages: 197
Price: $3800

North America Food Emulsifiers Market Competitive Strategies: Trends and Forecasts 2025-2033

Explore the booming North America food emulsifiers market forecast 2025-2033. Discover key growth drivers, segment analysis (Lecithin, Monoglycerides, Bakery, Dairy), market size, and CAGR trends.

November 2025
Base Year: 2024
No Of Pages: 234
Price: $4750

United States Textured Vegetable Protein Market Competitive Strategies: Trends and Forecasts 2025-2033

Explore the dynamic United States Textured Vegetable Protein (TVP) market. Discover key growth drivers, consumer trends towards plant-based diets, and market segmentation in this comprehensive analysis.

November 2025
Base Year: 2024
No Of Pages: 197
Price: $3800

Growth Strategies in MEA Gluten Free Food Industry Market: 2025-2033 Outlook

Explore the burgeoning MEA Gluten-Free Food Market with detailed analysis of market size, CAGR of 8.00%, key drivers, trends, restraints, and segment-wise growth. Discover opportunities in bakery, dairy-free, snacks, and beverages across key regions.

November 2025
Base Year: 2024
No Of Pages: 234
Price: $4750

Drivers of Change in Baobab Ingredient Market Market 2025-2033

The size of the Baobab Ingredient Market market was valued at USD XX Million in 2024 and is projected to reach USD XXX Million by 2033, with an expected CAGR of 6.11% during the forecast period.

November 2025
Base Year: 2024
No Of Pages: 234
Price: $4750

Sugar Confectionery Market Insightful Analysis: Trends, Competitor Dynamics, and Opportunities 2025-2033

Explore the thriving global sugar confectionery market, projected to reach USD 53,210 million by 2025 with a 5.45% CAGR. Discover key drivers, trends, and segment analysis for candy, gummies, and more.

November 2025
Base Year: 2024
No Of Pages: 180
Price: $3800

Strategic Drivers and Barriers in Asia-Pacific Vinegar Industry Market 2025-2033

Explore the booming Asia-Pacific Vinegar market forecast from 2025-2033, driven by health trends, diverse culinary applications, and key segments like Apple Cider and Rice Vinegar. Discover market size, CAGR, drivers, restraints, and top companies.

November 2025
Base Year: 2024
No Of Pages: 234
Price: $4750

Dried Processed Food Market Market Predictions and Opportunities 2025-2033

Explore the booming Dried Processed Food Market analysis, uncovering key insights, growth drivers, and trends. Discover market size projections, CAGR, and regional dynamics shaping the future of convenient and shelf-stable food options.

October 2025
Base Year: 2024
No Of Pages: 234
Price: $4750

Asia-Pacific Meat Substitutes Market Market’s Consumer Preferences: Trends and Analysis 2025-2033

Explore the booming Asia-Pacific meat substitutes market! Discover key insights, market size projections, growth drivers, and leading companies shaping the future of alternative proteins.

October 2025
Base Year: 2024
No Of Pages: 197
Price: $3800

GCC Bottled Water Industry Market Demand Dynamics: Insights 2025-2033

The size of the GCC Bottled Water Industry market was valued at USD 6.79 Million in 2024 and is projected to reach USD 14.24 Million by 2033, with an expected CAGR of 11.16% during the forecast period.

October 2025
Base Year: 2024
No Of Pages: 234
Price: $4750

Market Projections for India Plant Based Protein Industry Industry 2025-2033

Explore the booming Indian plant-based protein market, projected to reach over INR 733 million by 2025 with a steady CAGR. Discover key drivers, market segments, and leading companies shaping this vital industry.

October 2025
Base Year: 2024
No Of Pages: 180
Price: $3800

Strategic Insights for Spain Food Hydrocolloids Market Market Growth

Explore the Spain Food Hydrocolloids Market analysis, key drivers, restraints, and growth trends. Discover CAGR, market size, and segment insights for dairy, bakery, confectionery, and beverages.

October 2025
Base Year: 2024
No Of Pages: 197
Price: $3800

Europe Sugar Confectionery Market to Grow at XX CAGR: Market Size Analysis and Forecasts 2025-2033

The size of the Europe Sugar Confectionery Market market was valued at USD 13810 Million in 2024 and is projected to reach USD 19034.00 Million by 2033, with an expected CAGR of 4.69% during the forecast period.

October 2025
Base Year: 2024
No Of Pages: 180
Price: $3800

Beta-Glucan Market Market Demand and Consumption Trends: Outlook 2025-2033

Explore the dynamic Beta-Glucan market, driven by health benefits and food innovation. Discover market size, CAGR, key trends, and leading companies shaping the future of this expanding industry.

October 2025
Base Year: 2024
No Of Pages: 234
Price: $4750

Exploring Barriers in Almond Ingredient Market Market: Trends and Analysis 2025-2033

The size of the Almond Ingredient Market market was valued at USD 12400 Million in 2024 and is projected to reach USD 24707.46 Million by 2033, with an expected CAGR of 10.35% during the forecast period.

October 2025
Base Year: 2024
No Of Pages: 180
Price: $4750

Weight Management Product Market Report Probes the XXX Million Size, Share, Growth Report and Future Analysis by 2033

Explore the booming Weight Management Product Market, driven by health awareness and innovation. Discover market size, CAGR, key trends, restraints, segments, and regional growth from 2025-2033.

October 2025
Base Year: 2024
No Of Pages: 234
Price: $4750

India Protein Industry Market Predictions and Opportunities 2025-2033

Explore the booming Indian protein market, driven by health trends and diverse applications in food, beverages, supplements, and personal care. Discover key growth drivers, market segments, and leading companies shaping this dynamic industry.

October 2025
Base Year: 2024
No Of Pages: 197
Price: $3800

Asia-Pacific Food Preservatives Market Market’s Drivers and Challenges: Strategic Overview 2025-2033

The size of the Asia-Pacific Food Preservatives Market market was valued at USD XX Million in 2024 and is projected to reach USD XXX Million by 2033, with an expected CAGR of 3.60% during the forecast period.

October 2025
Base Year: 2024
No Of Pages: 234
Price: $4750

Comprehensive Insights into Wheat Protein Market: Trends and Growth Projections 2025-2033

Explore the booming Wheat Protein Market, driven by plant-based diets and functional food innovation. Discover market size, CAGR, key segments, and future growth trends impacting dairy, bakery, sports nutrition, and animal feed industries.

October 2025
Base Year: 2024
No Of Pages: 234
Price: $4750

Exploring North America Anti-Caking Industry’s Market Size Dynamics 2025-2033

Explore the burgeoning North American anti-caking agents market. Discover key trends, drivers like food processing growth, and segment analysis for bakery, dairy, cosmetics & more. Market size $920M, CAGR 5.20%.

October 2025
Base Year: 2024
No Of Pages: 234
Price: $4750

North America Low Intensity Sweeteners Industry 2025-2033 Trends: Unveiling Growth Opportunities and Competitor Dynamics

Explore the North America low-intensity sweeteners market analysis, CAGR 5.62%, driven by health trends. Discover market size, drivers, restraints, segments (Stevia, Sucralose), applications (Food, Beverages, Pharma), and key companies. Get insights for 2025-2033.

October 2025
Base Year: 2024
No Of Pages: 234
Price: $4750

Omega Ingredients Industry Size, Share, and Growth Report: In-Depth Analysis and Forecast to 2033

The size of the Omega Ingredients Industry market was valued at USD 1.26 Million in 2024 and is projected to reach USD 3.11 Million by 2033, with an expected CAGR of 13.79% during the forecast period.

October 2025
Base Year: 2024
No Of Pages: 234
Price: $4750

Pakistan Savory Snack Market Market Dynamics and Growth Analysis

Explore the dynamic Pakistan Savory Snack Market with in-depth analysis of market size, CAGR, key drivers, trends, and segment-wise growth. Discover growth opportunities in potato chips, extruded snacks, and online retail.

October 2025
Base Year: 2024
No Of Pages: 197
Price: $3800

China Anti-Caking Market Unlocking Growth Potential: Analysis and Forecasts 2025-2033

Explore the dynamic China anti-caking market trends, growth drivers, and key segments like food & beverage, cosmetics, and feed. Understand market size and CAGR for 2025-2033.

October 2025
Base Year: 2024
No Of Pages: 197
Price: $3800

North American Soup Market Strategic Roadmap: Analysis and Forecasts 2025-2033

Explore the North American soup market's projected USD 6.04 billion size in 2025, driven by convenience, health trends, and innovation. Discover growth drivers, restraints, and key segments for this evolving industry.

October 2025
Base Year: 2024
No Of Pages: 210
Price: $4750

Strategic Trends in North America Food Hydrocolloids Market Market 2025-2033

The size of the North America Food Hydrocolloids Market market was valued at USD XX Million in 2024 and is projected to reach USD XXX Million by 2033, with an expected CAGR of 4.90% during the forecast period.

October 2025
Base Year: 2024
No Of Pages: 234
Price: $4750

Regional Insights into Goat Meat and Cheese Market in Saudi Arabia Market Growth

Explore the booming Saudi Arabian Goat Meat and Cheese Market. Discover key insights into market size, growth drivers, and consumer trends shaping this evolving sector. Get informed on future projections and segmentation.

October 2025
Base Year: 2024
No Of Pages: 197
Price: $3800

China Food Service Market Market Strategies for the Next Decade: 2025-2033

Explore the booming China Food Service Market with a projected USD 560.11 million size and 4.40% CAGR. Discover key drivers, emerging trends, and dominant players shaping the future of dining in China.

October 2025
Base Year: 2024
No Of Pages: 197
Price: $3800

APAC Drinkable Yoghurt Market Insightful Market Analysis: Trends and Opportunities 2025-2033

The size of the APAC Drinkable Yoghurt Market market was valued at USD XX Million in 2024 and is projected to reach USD XXX Million by 2033, with an expected CAGR of 2.20% during the forecast period.

October 2025
Base Year: 2024
No Of Pages: 197
Price: $3800

Asia-Pacific Water Enhancer Industry 2025 Trends and Forecasts 2033: Analyzing Growth Opportunities

Explore the booming Asia-Pacific water enhancer market! Discover key growth drivers, emerging trends, and future projections for this $1.2 billion industry, driven by health consciousness and convenient hydration solutions.

October 2025
Base Year: 2024
No Of Pages: 234
Price: $4750

North America Canned Fruits Market Market Outlook and Strategic Insights

Explore the North America canned fruits market analysis, growth drivers, trends, and forecast from 2019-2033. Discover key segments like peaches, pineapple, and distribution channels including online retail.

October 2025
Base Year: 2024
No Of Pages: 234
Price: $4750

Clean Label Ingredients Market in Asia Pacific 2025-2033 Overview: Trends, Dynamics, and Growth Opportunities

Explore the dynamic Asia Pacific Clean Label Ingredients Market, projected for robust growth with a focus on natural colorants, flavors, and sweeteners. Discover key drivers, trends, and opportunities in this expanding sector.

October 2025
Base Year: 2024
No Of Pages: 234
Price: $4750

APAC Essential Oil Industry: Harnessing Emerging Innovations for Growth 2025-2033

The size of the APAC Essential Oil Industry market was valued at USD 2.26 Million in 2024 and is projected to reach USD 3.93 Million by 2033, with an expected CAGR of 8.21% during the forecast period.

October 2025
Base Year: 2024
No Of Pages: 180
Price: $4750

Asia-Pacific Phytosterols Market Market Analysis and Forecasts

Explore the booming Asia-Pacific phytosterols market forecast, driven by health trends and functional food innovation. Discover key drivers, restraints, product segments, and regional insights for this rapidly growing industry.

October 2025
Base Year: 2024
No Of Pages: 180
Price: $4750

Future Forecasts for Sri Lanka Starch and Starch Derivative Market Industry Growth

Explore the booming Sri Lanka Starch and Starch Derivative Market, driven by food, pharma, and paper industries. Discover market size, CAGR, key drivers, and growth opportunities to 2033.

October 2025
Base Year: 2024
No Of Pages: 197
Price: $3800

Strategic Growth Drivers for Australia Anti Caking Market Market

Explore the burgeoning Australian anti-caking agents market analysis, revealing a market size of AUD 822 million by 2025 with a 4.50% CAGR. Discover key drivers, restraints, and segment insights for food & beverage, cosmetics, and animal feed.

October 2025
Base Year: 2024
No Of Pages: 197
Price: $3800

Understanding Growth Trends in Desiccated Coconut Powder Market Market

The size of the Desiccated Coconut Powder Market market was valued at USD XX Million in 2024 and is projected to reach USD XXX Million by 2033, with an expected CAGR of 7.45% during the forecast period.

October 2025
Base Year: 2024
No Of Pages: 234
Price: $4750

Bread Industry Market Expansion: Growth Outlook 2025-2033

Explore the dynamic global bread market, analyzing key growth drivers, emerging trends like artisanal and gluten-free options, and market size projections. Discover insights into product segments, distribution channels, and regional opportunities.

October 2025
Base Year: 2024
No Of Pages: 234
Price: $4750

Exploring Milk Protein Market in India Market Disruption and Innovation

Explore the dynamic Indian Milk Protein Market forecast, key growth drivers, and emerging trends. Discover market size, CAGR, and dominant segments for strategic insights.

October 2025
Base Year: 2024
No Of Pages: 197
Price: $3800
  • Home
  • About Us
  • Industries
    • Packaging
    • Automotive
    • Home and Property Improvement
    • Retail
    • Energy & Power
    • Food & Beverage
    • Real Estate and Construction
    • Hospitality and Tourism
    • Agriculture
    • Manufacturing Products and Services
    • Healthcare
    • Logistics
    • Aerospace & Defense
    • Chemicals & Materials
    • Professional and Commercial Services
    • Financial Services and Investment Intelligence
    • Consumer Goods and Services
    • Animal Nutrition & Wellness
    • Technology, Media and Telecom
  • Services
  • Contact
Main Logo
  • Home
  • About Us
  • Industries
    • Packaging
    • Automotive
    • Home and Property Improvement
    • Retail
    • Energy & Power
    • Food & Beverage
    • Real Estate and Construction
    • Hospitality and Tourism
    • Agriculture
    • Manufacturing Products and Services
    • Healthcare
    • Logistics
    • Aerospace & Defense
    • Chemicals & Materials
    • Professional and Commercial Services
    • Financial Services and Investment Intelligence
    • Consumer Goods and Services
    • Animal Nutrition & Wellness
    • Technology, Media and Telecom
  • Services
  • Contact
+17162654855
[email protected]

+17162654855

[email protected]

Business Address

Head Office

Ansec House 3 rd floor Tank Road, Yerwada, Pune, Maharashtra 411014

Contact Information

Craig Francis

Business Development Head

+17162654855

[email protected]

Secure Payment Partners

payment image
RetailPackagingLogisticsAutomotiveHealthcareAgricultureEnergy & PowerFood & BeverageAerospace & DefenseChemicals & MaterialsHospitality and TourismConsumer Goods and ServicesAnimal Nutrition & WellnessReal Estate and ConstructionHome and Property ImprovementTechnology, Media and TelecomManufacturing Products and ServicesFinancial Services and Investment Intelligence

© 2025 PRDUA Research & Media Private Limited, All rights reserved

Privacy Policy
Terms and Conditions
FAQ