

Key Insights
The Middle East and Africa (MEA) refining catalysts market exhibits robust growth, driven by increasing investments in refinery expansions and upgrades across the region. The market's Compound Annual Growth Rate (CAGR) exceeding 3% from 2019 to 2024 indicates a consistently expanding demand for catalysts crucial to optimizing refining processes. Key drivers include the rising energy consumption fueled by population growth and industrialization, coupled with stringent environmental regulations pushing refiners to adopt cleaner technologies. The demand is spread across various catalyst types, including fluid catalytic cracking (FCC), reforming, hydrotreating, hydrocracking, isomerization, and alkylation catalysts. Zeolite, metal, and chemical compounds constitute the major ingredient categories driving innovation and performance improvements in these catalysts. Leading players like Haldor Topsoe, Axens, Honeywell, and Clariant are significantly contributing to the market's growth, continuously developing advanced catalyst formulations to meet the evolving needs of MEA refineries. The forecast period (2025-2033) promises sustained expansion, driven by planned refinery projects and ongoing efforts to enhance operational efficiency and product quality. While challenges exist in the form of fluctuating crude oil prices and potential geopolitical instability, the long-term outlook for the MEA refining catalysts market remains positive.
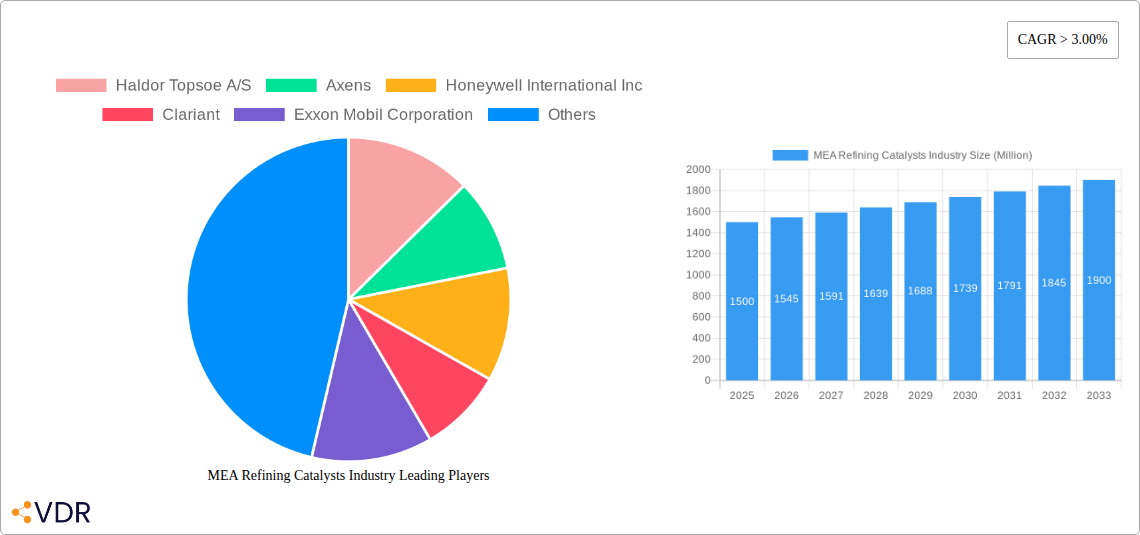
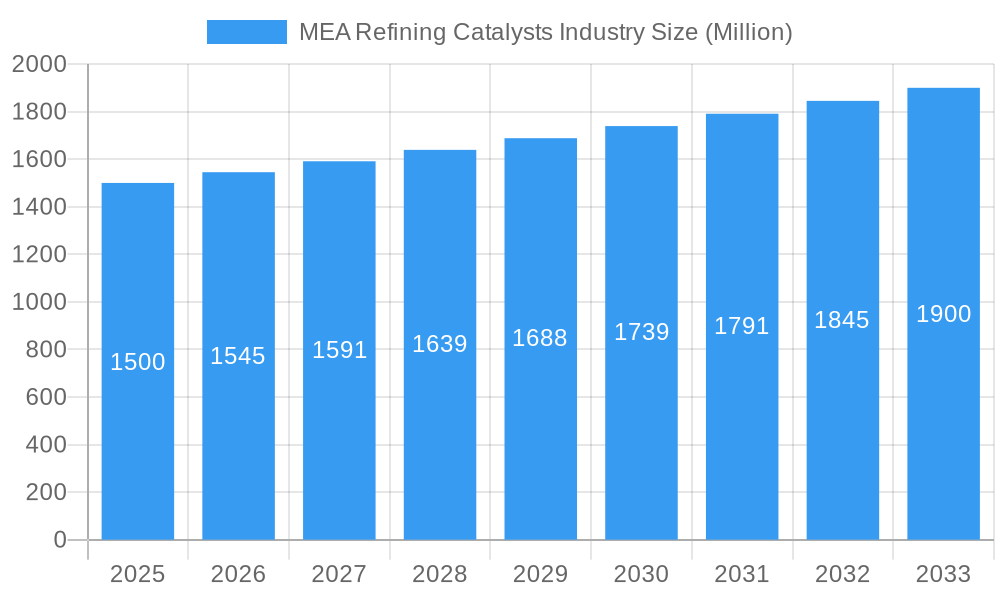
MEA Refining Catalysts Industry Market Size (In Billion)
The segmental analysis reveals that Fluid Catalytic Cracking Catalysts holds the largest market share due to its widespread use in processing various crude oil types. However, growing demand for cleaner fuels is propelling the growth of hydrotreating and hydrocracking catalysts, which are essential for removing sulfur and enhancing fuel quality. Competition is intense among established multinational companies and regional players. Strategic partnerships, technological advancements, and continuous R&D investments will be crucial for maintaining market leadership and capturing new opportunities within this expanding market. The MEA region's unique characteristics, including a significant concentration of oil and gas reserves and refineries, position it favorably for sustained growth within the refining catalyst industry. Further, investments in downstream petrochemical industries contribute to the rising demand for high-quality refined products, strengthening the need for efficient and effective refining catalysts.
MEA Refining Catalysts Industry Company Market Share
MEA Refining Catalysts Industry Market Report: 2019-2033
This comprehensive report provides an in-depth analysis of the Middle East and Africa (MEA) Refining Catalysts industry, offering valuable insights for industry professionals, investors, and strategic decision-makers. The report covers the period 2019-2033, with a focus on the forecast period 2025-2033 and a base year of 2025. The market is segmented by ingredient (Zeolite, Metal, Chemical Compounds) and type (Fluid Catalytic Cracking Catalysts, Reforming Catalysts, Hydrotreating Catalysts, Hydrocracking Catalysts, Isomerization Catalysts, Alkylation Catalysts). Key players analyzed include Haldor Topsoe A/S, Axens, Honeywell International Inc, Clariant, Exxon Mobil Corporation, Evonik Industries AG, W R Grace & Co -Conn, BASF SE, Chevron Corporation, DuPont, Saudi Arabian Oil Co, JGC C & C, Johnson Matthey, and Albemarle Corporation. The total market size in 2025 is estimated at XX Million.
MEA Refining Catalysts Industry Market Dynamics & Structure
The MEA refining catalysts market is characterized by moderate concentration, with a few major players holding significant market share. Technological innovation, driven by the need for improved efficiency and environmental compliance, is a key driver. Stringent environmental regulations are shaping the industry landscape, pushing for the development of cleaner and more sustainable catalysts. Competitive pressures from substitute materials are also present, while M&A activity remains relatively stable. The end-user demographic is primarily focused on large-scale refineries in the region.
- Market Concentration: The top 5 players hold approximately XX% of the market share in 2025.
- Technological Innovation: Focus on improving catalyst activity, selectivity, and lifetime. R&D investment is estimated at XX Million in 2025.
- Regulatory Framework: Stringent emission standards are driving demand for advanced catalysts.
- Competitive Substitutes: Biocatalysts and other advanced materials pose a potential threat.
- M&A Activity: The number of M&A deals in the last 5 years averaged approximately XX deals per year.
- Innovation Barriers: High R&D costs and long development cycles hinder rapid innovation.
MEA Refining Catalysts Industry Growth Trends & Insights
The MEA refining catalysts market is projected to experience substantial growth during the forecast period, driven by increasing refining capacity, rising demand for cleaner fuels, and ongoing investments in refinery modernization. The adoption rate of advanced catalysts is steadily increasing, particularly in countries with stricter environmental regulations. Technological disruptions, such as the development of novel catalyst materials and advanced manufacturing techniques, are further fueling market expansion. Shifts in consumer behavior towards higher-quality fuels are also impacting demand. The CAGR for the forecast period (2025-2033) is estimated at XX%, with market penetration expected to reach XX% by 2033. Specific growth trajectories for each catalyst type will be detailed within the full report.
Dominant Regions, Countries, or Segments in MEA Refining Catalysts Industry
The Middle East and Africa (MEA) Refining Catalysts Industry is witnessing significant activity, with the GCC (Gulf Cooperation Council) region currently establishing itself as the leading market. This dominance is underpinned by substantial refining capacity, coupled with ongoing and planned investments in refinery upgrades and expansions. Within the GCC, Saudi Arabia stands out as a market with immense growth potential, driven by its large-scale refining projects and a strong national emphasis on enhancing fuel quality and meeting international standards. Across the MEA, Fluid Catalytic Cracking (FCC) catalysts continue to hold the largest market share, essential for gasoline production. Following closely are hydrotreating catalysts, crucial for sulfur removal and meeting stringent environmental regulations. Within the catalyst ingredients landscape, zeolite-based catalysts command a substantial and vital market share due to their versatile catalytic properties.
- Key Drivers: Robust government support for refinery expansion and modernization projects, a consistently growing demand for transportation fuels across the region, and the increasing implementation of stringent environmental regulations mandating cleaner fuel production.
- Dominance Factors: The region's substantial existing refining capacity, its strategic geographical location as a global energy hub, and significant government-led investments in the petrochemical and refining sectors.
- Growth Potential: The Saudi Arabian market is particularly well-positioned for accelerated growth, with projections indicating a Compound Annual Growth Rate (CAGR) of XX% during the specified forecast period. Other MEA countries are also expected to contribute to this upward trend.
MEA Refining Catalysts Industry Product Landscape
The MEA refining catalysts market showcases a diverse range of products tailored to specific refining processes and fuel specifications. Innovations focus on improving catalyst activity, selectivity, and lifespan, leading to enhanced refinery efficiency and reduced environmental impact. Key advancements include the development of metal-supported catalysts with improved resistance to deactivation and novel zeolite structures for optimized cracking performance. Unique selling propositions often center on superior performance metrics such as increased yield, improved selectivity, and extended catalyst life.
Key Drivers, Barriers & Challenges in MEA Refining Catalysts Industry
Key Drivers: Increasing demand for cleaner fuels driven by stricter environmental regulations, growing refining capacity expansion in the MEA region, and technological advancements resulting in improved catalyst performance are the primary drivers.
Challenges & Restraints: Supply chain disruptions, particularly those caused by geopolitical instability, can significantly impact catalyst availability and pricing. Regulatory hurdles related to environmental compliance and import/export regulations pose additional challenges. Intense competition among established players further complicates the market dynamics. The estimated impact of supply chain issues on market growth in 2025 is approximately XX%.
Emerging Opportunities in MEA Refining Catalysts Industry
The MEA refining catalysts market is ripe with emerging opportunities, particularly in the development and deployment of specialized catalysts. These advanced catalysts are designed to efficiently process heavier and more challenging crude oil feedstocks, a common characteristic in many MEA reserves, and to facilitate the production of ultra-low sulfur fuels and other cleaner fuel products that meet evolving global environmental standards. Untapped market potential also exists within smaller, independent refineries and in the rapidly developing economies across the broader MEA region that are undergoing industrialization and increasing their refining capabilities. Furthermore, the innovative application of catalysts in the burgeoning field of biofuel production and the integration into other green technologies represent significant growth avenues. The persistent evolution of consumer preferences towards higher quality, environmentally benign fuels globally, and increasingly within the MEA, directly fuels market expansion and the demand for advanced catalytic solutions.
Growth Accelerators in the MEA Refining Catalysts Industry
The acceleration of the MEA refining catalysts market is being significantly propelled by several key factors. Technological breakthroughs in catalyst design, material science, and synthesis processes are leading to the development of more efficient, selective, and durable catalysts. These advancements enable refiners to achieve higher yields, reduce energy consumption, and minimize environmental impact. Additionally, strategic partnerships and collaborations between leading catalyst manufacturers and major refining companies across the MEA are proving pivotal. These alliances foster co-development, ensure market access, and facilitate the timely deployment of new catalyst technologies. Aggressive expansion strategies targeting emerging markets within the MEA, coupled with substantial and continuous investments in research and development (R&D) for next-generation catalyst technologies, are critical components for ensuring sustained long-term success and competitive advantage in this dynamic and evolving industry sector.
Key Players Shaping the MEA Refining Catalysts Industry Market
Notable Milestones in MEA Refining Catalysts Industry Sector
- 2020: A prominent catalyst manufacturer introduced a new generation of Fluid Catalytic Cracking (FCC) catalysts featuring significantly improved product selectivity and enhanced operational efficiency, marking a key advancement in gasoline production technology.
- 2022: A leading global catalyst provider announced a strategic partnership with a major refinery located in the United Arab Emirates, focusing on optimizing catalyst performance and co-developing tailored solutions for the refinery's specific operational needs.
- 2023: Significant capital investment was channeled into the establishment of a new, state-of-the-art catalyst manufacturing plant in Saudi Arabia by a key industry player, aimed at bolstering local production capacity and supporting the Kingdom's downstream sector expansion.
- [Year]: [Event Description - e.g., A regional player successfully launched a novel hydrocracking catalyst designed for processing sour crude, receiving widespread adoption across several key refineries in North Africa.]
In-Depth MEA Refining Catalysts Industry Market Outlook
The outlook for the MEA refining catalysts market remains exceptionally positive, indicating a trajectory of continued and robust growth. This optimistic forecast is driven by a confluence of powerful factors, including the ongoing and ambitious refinery expansion and modernization projects across the region, a sustained and increasing demand for cleaner, higher-quality fuels that meet global environmental standards, and the widespread adoption of advanced catalyst technologies by refiners seeking to optimize their operations and competitiveness. Strategic opportunities are abundant for companies capable of developing, innovating, and commercializing cutting-edge catalyst solutions that are precisely tailored to the unique operational challenges and specific feedstock characteristics of the region's diverse refineries. In this dynamic and rapidly evolving market, a steadfast focus on sustainability, stringent environmental compliance, and the development of catalysts that support a lower carbon footprint will be absolutely crucial for achieving and maintaining long-term success and market leadership.
MEA Refining Catalysts Industry Segmentation
-
1. Ingredient
- 1.1. Zeolite
- 1.2. Metal
- 1.3. Chemical Compounds
-
2. Type
- 2.1. Fluid Catalytic Cracking Catalysts
- 2.2. Reforming Catalysts
- 2.3. Hydrotreating Catalysts
- 2.4. Hydrocracking Catalysts
- 2.5. Isomerization Catalysts
- 2.6. Alkylation Catalysts
-
3. Geography
- 3.1. Saudi Arabia
- 3.2. Kuwait
- 3.3. Qatar
- 3.4. Nigeria
- 3.5. United Arab Emirates
- 3.6. Rest of Middle-East and Africa
MEA Refining Catalysts Industry Segmentation By Geography
- 1. Saudi Arabia
- 2. Kuwait
- 3. Qatar
- 4. Nigeria
- 5. United Arab Emirates
- 6. Rest of Middle East and Africa
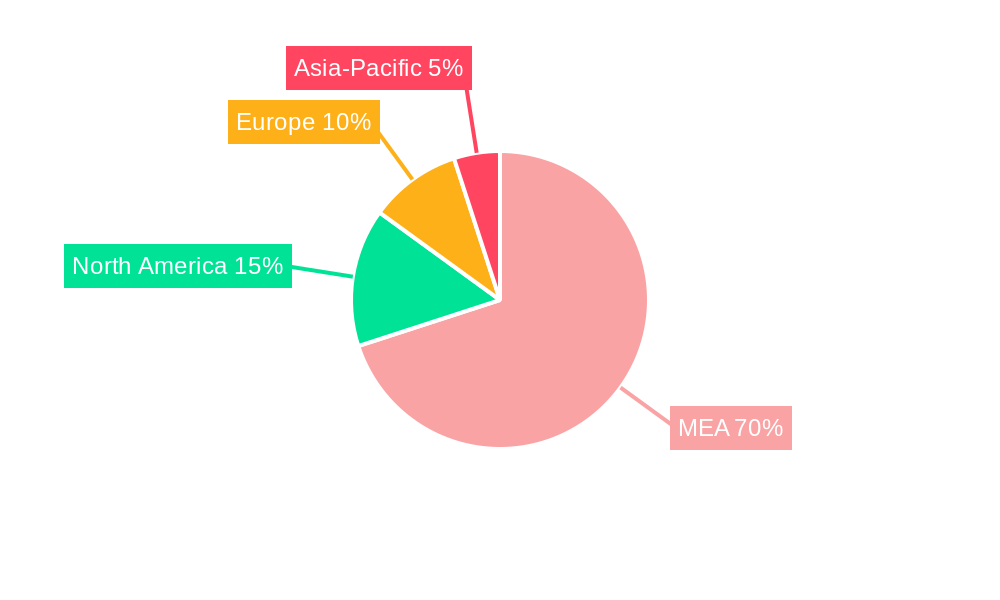
MEA Refining Catalysts Industry Regional Market Share
Geographic Coverage of MEA Refining Catalysts Industry
MEA Refining Catalysts Industry REPORT HIGHLIGHTS
| Aspects | Details |
|---|---|
| Study Period | 2020-2034 |
| Base Year | 2025 |
| Estimated Year | 2026 |
| Forecast Period | 2026-2034 |
| Historical Period | 2020-2025 |
| Growth Rate | CAGR of 5.85% from 2020-2034 |
| Segmentation |
|
Table of Contents
- 1. Introduction
- 1.1. Research Scope
- 1.2. Market Segmentation
- 1.3. Research Objective
- 1.4. Definitions and Assumptions
- 2. Executive Summary
- 2.1. Market Snapshot
- 3. Market Dynamics
- 3.1. Market Drivers
- 3.2. Market Restrains
- 3.3. Market Trends
- 3.4. Market Opportunities
- 4. Market Factor Analysis
- 4.1. Porters Five Forces
- 4.1.1. Bargaining Power of Suppliers
- 4.1.2. Bargaining Power of Buyers
- 4.1.3. Threat of New Entrants
- 4.1.4. Threat of Substitutes
- 4.1.5. Competitive Rivalry
- 4.2. PESTEL analysis
- 4.3. BCG Analysis
- 4.3.1. Stars (High Growth, High Market Share)
- 4.3.2. Cash Cows (Low Growth, High Market Share)
- 4.3.3. Question Mark (High Growth, Low Market Share)
- 4.3.4. Dogs (Low Growth, Low Market Share)
- 4.4. Ansoff Matrix Analysis
- 4.5. Supply Chain Analysis
- 4.6. Regulatory Landscape
- 4.7. Current Market Potential and Opportunity Assessment (TAM–SAM–SOM Framework)
- 4.8. VDR Analyst Note
- 4.1. Porters Five Forces
- 5. Market Analysis, Insights and Forecast 2021-2033
- 5.1. Market Analysis, Insights and Forecast - by Ingredient
- 5.1.1. Zeolite
- 5.1.2. Metal
- 5.1.3. Chemical Compounds
- 5.2. Market Analysis, Insights and Forecast - by Type
- 5.2.1. Fluid Catalytic Cracking Catalysts
- 5.2.2. Reforming Catalysts
- 5.2.3. Hydrotreating Catalysts
- 5.2.4. Hydrocracking Catalysts
- 5.2.5. Isomerization Catalysts
- 5.2.6. Alkylation Catalysts
- 5.3. Market Analysis, Insights and Forecast - by Geography
- 5.3.1. Saudi Arabia
- 5.3.2. Kuwait
- 5.3.3. Qatar
- 5.3.4. Nigeria
- 5.3.5. United Arab Emirates
- 5.3.6. Rest of Middle-East and Africa
- 5.4. Market Analysis, Insights and Forecast - by Region
- 5.4.1. Saudi Arabia
- 5.4.2. Kuwait
- 5.4.3. Qatar
- 5.4.4. Nigeria
- 5.4.5. United Arab Emirates
- 5.4.6. Rest of Middle East and Africa
- 5.1. Market Analysis, Insights and Forecast - by Ingredient
- 6. MEA Refining Catalysts Industry Analysis, Insights and Forecast, 2021-2033
- 6.1. Market Analysis, Insights and Forecast - by Ingredient
- 6.1.1. Zeolite
- 6.1.2. Metal
- 6.1.3. Chemical Compounds
- 6.2. Market Analysis, Insights and Forecast - by Type
- 6.2.1. Fluid Catalytic Cracking Catalysts
- 6.2.2. Reforming Catalysts
- 6.2.3. Hydrotreating Catalysts
- 6.2.4. Hydrocracking Catalysts
- 6.2.5. Isomerization Catalysts
- 6.2.6. Alkylation Catalysts
- 6.3. Market Analysis, Insights and Forecast - by Geography
- 6.3.1. Saudi Arabia
- 6.3.2. Kuwait
- 6.3.3. Qatar
- 6.3.4. Nigeria
- 6.3.5. United Arab Emirates
- 6.3.6. Rest of Middle-East and Africa
- 6.1. Market Analysis, Insights and Forecast - by Ingredient
- 7. Saudi Arabia MEA Refining Catalysts Industry Analysis, Insights and Forecast, 2021-2033
- 7.1. Market Analysis, Insights and Forecast - by Ingredient
- 7.1.1. Zeolite
- 7.1.2. Metal
- 7.1.3. Chemical Compounds
- 7.2. Market Analysis, Insights and Forecast - by Type
- 7.2.1. Fluid Catalytic Cracking Catalysts
- 7.2.2. Reforming Catalysts
- 7.2.3. Hydrotreating Catalysts
- 7.2.4. Hydrocracking Catalysts
- 7.2.5. Isomerization Catalysts
- 7.2.6. Alkylation Catalysts
- 7.3. Market Analysis, Insights and Forecast - by Geography
- 7.3.1. Saudi Arabia
- 7.3.2. Kuwait
- 7.3.3. Qatar
- 7.3.4. Nigeria
- 7.3.5. United Arab Emirates
- 7.3.6. Rest of Middle-East and Africa
- 7.1. Market Analysis, Insights and Forecast - by Ingredient
- 8. Kuwait MEA Refining Catalysts Industry Analysis, Insights and Forecast, 2021-2033
- 8.1. Market Analysis, Insights and Forecast - by Ingredient
- 8.1.1. Zeolite
- 8.1.2. Metal
- 8.1.3. Chemical Compounds
- 8.2. Market Analysis, Insights and Forecast - by Type
- 8.2.1. Fluid Catalytic Cracking Catalysts
- 8.2.2. Reforming Catalysts
- 8.2.3. Hydrotreating Catalysts
- 8.2.4. Hydrocracking Catalysts
- 8.2.5. Isomerization Catalysts
- 8.2.6. Alkylation Catalysts
- 8.3. Market Analysis, Insights and Forecast - by Geography
- 8.3.1. Saudi Arabia
- 8.3.2. Kuwait
- 8.3.3. Qatar
- 8.3.4. Nigeria
- 8.3.5. United Arab Emirates
- 8.3.6. Rest of Middle-East and Africa
- 8.1. Market Analysis, Insights and Forecast - by Ingredient
- 9. Qatar MEA Refining Catalysts Industry Analysis, Insights and Forecast, 2021-2033
- 9.1. Market Analysis, Insights and Forecast - by Ingredient
- 9.1.1. Zeolite
- 9.1.2. Metal
- 9.1.3. Chemical Compounds
- 9.2. Market Analysis, Insights and Forecast - by Type
- 9.2.1. Fluid Catalytic Cracking Catalysts
- 9.2.2. Reforming Catalysts
- 9.2.3. Hydrotreating Catalysts
- 9.2.4. Hydrocracking Catalysts
- 9.2.5. Isomerization Catalysts
- 9.2.6. Alkylation Catalysts
- 9.3. Market Analysis, Insights and Forecast - by Geography
- 9.3.1. Saudi Arabia
- 9.3.2. Kuwait
- 9.3.3. Qatar
- 9.3.4. Nigeria
- 9.3.5. United Arab Emirates
- 9.3.6. Rest of Middle-East and Africa
- 9.1. Market Analysis, Insights and Forecast - by Ingredient
- 10. Nigeria MEA Refining Catalysts Industry Analysis, Insights and Forecast, 2021-2033
- 10.1. Market Analysis, Insights and Forecast - by Ingredient
- 10.1.1. Zeolite
- 10.1.2. Metal
- 10.1.3. Chemical Compounds
- 10.2. Market Analysis, Insights and Forecast - by Type
- 10.2.1. Fluid Catalytic Cracking Catalysts
- 10.2.2. Reforming Catalysts
- 10.2.3. Hydrotreating Catalysts
- 10.2.4. Hydrocracking Catalysts
- 10.2.5. Isomerization Catalysts
- 10.2.6. Alkylation Catalysts
- 10.3. Market Analysis, Insights and Forecast - by Geography
- 10.3.1. Saudi Arabia
- 10.3.2. Kuwait
- 10.3.3. Qatar
- 10.3.4. Nigeria
- 10.3.5. United Arab Emirates
- 10.3.6. Rest of Middle-East and Africa
- 10.1. Market Analysis, Insights and Forecast - by Ingredient
- 11. United Arab Emirates MEA Refining Catalysts Industry Analysis, Insights and Forecast, 2021-2033
- 11.1. Market Analysis, Insights and Forecast - by Ingredient
- 11.1.1. Zeolite
- 11.1.2. Metal
- 11.1.3. Chemical Compounds
- 11.2. Market Analysis, Insights and Forecast - by Type
- 11.2.1. Fluid Catalytic Cracking Catalysts
- 11.2.2. Reforming Catalysts
- 11.2.3. Hydrotreating Catalysts
- 11.2.4. Hydrocracking Catalysts
- 11.2.5. Isomerization Catalysts
- 11.2.6. Alkylation Catalysts
- 11.3. Market Analysis, Insights and Forecast - by Geography
- 11.3.1. Saudi Arabia
- 11.3.2. Kuwait
- 11.3.3. Qatar
- 11.3.4. Nigeria
- 11.3.5. United Arab Emirates
- 11.3.6. Rest of Middle-East and Africa
- 11.1. Market Analysis, Insights and Forecast - by Ingredient
- 12. Rest of Middle East and Africa MEA Refining Catalysts Industry Analysis, Insights and Forecast, 2021-2033
- 12.1. Market Analysis, Insights and Forecast - by Ingredient
- 12.1.1. Zeolite
- 12.1.2. Metal
- 12.1.3. Chemical Compounds
- 12.2. Market Analysis, Insights and Forecast - by Type
- 12.2.1. Fluid Catalytic Cracking Catalysts
- 12.2.2. Reforming Catalysts
- 12.2.3. Hydrotreating Catalysts
- 12.2.4. Hydrocracking Catalysts
- 12.2.5. Isomerization Catalysts
- 12.2.6. Alkylation Catalysts
- 12.3. Market Analysis, Insights and Forecast - by Geography
- 12.3.1. Saudi Arabia
- 12.3.2. Kuwait
- 12.3.3. Qatar
- 12.3.4. Nigeria
- 12.3.5. United Arab Emirates
- 12.3.6. Rest of Middle-East and Africa
- 12.1. Market Analysis, Insights and Forecast - by Ingredient
- 13. Competitive Analysis
- 13.1. Company Profiles
- 13.1.1 Haldor Topsoe A/S
- 13.1.1.1. Company Overview
- 13.1.1.2. Products
- 13.1.1.3. Company Financials
- 13.1.1.4. SWOT Analysis
- 13.1.2 Axens
- 13.1.2.1. Company Overview
- 13.1.2.2. Products
- 13.1.2.3. Company Financials
- 13.1.2.4. SWOT Analysis
- 13.1.3 Honeywell International Inc
- 13.1.3.1. Company Overview
- 13.1.3.2. Products
- 13.1.3.3. Company Financials
- 13.1.3.4. SWOT Analysis
- 13.1.4 Clariant
- 13.1.4.1. Company Overview
- 13.1.4.2. Products
- 13.1.4.3. Company Financials
- 13.1.4.4. SWOT Analysis
- 13.1.5 Exxon Mobil Corporation
- 13.1.5.1. Company Overview
- 13.1.5.2. Products
- 13.1.5.3. Company Financials
- 13.1.5.4. SWOT Analysis
- 13.1.6 Evonik Industries AG
- 13.1.6.1. Company Overview
- 13.1.6.2. Products
- 13.1.6.3. Company Financials
- 13.1.6.4. SWOT Analysis
- 13.1.7 W R Grace & Co -Conn
- 13.1.7.1. Company Overview
- 13.1.7.2. Products
- 13.1.7.3. Company Financials
- 13.1.7.4. SWOT Analysis
- 13.1.8 BASF SE
- 13.1.8.1. Company Overview
- 13.1.8.2. Products
- 13.1.8.3. Company Financials
- 13.1.8.4. SWOT Analysis
- 13.1.9 Chevron Corporation
- 13.1.9.1. Company Overview
- 13.1.9.2. Products
- 13.1.9.3. Company Financials
- 13.1.9.4. SWOT Analysis
- 13.1.10 DuPont
- 13.1.10.1. Company Overview
- 13.1.10.2. Products
- 13.1.10.3. Company Financials
- 13.1.10.4. SWOT Analysis
- 13.1.11 Saudi Arabian Oil Co
- 13.1.11.1. Company Overview
- 13.1.11.2. Products
- 13.1.11.3. Company Financials
- 13.1.11.4. SWOT Analysis
- 13.1.12 JGC C & C
- 13.1.12.1. Company Overview
- 13.1.12.2. Products
- 13.1.12.3. Company Financials
- 13.1.12.4. SWOT Analysis
- 13.1.13 Johnson Matthey
- 13.1.13.1. Company Overview
- 13.1.13.2. Products
- 13.1.13.3. Company Financials
- 13.1.13.4. SWOT Analysis
- 13.1.14 Albemarle Corporation
- 13.1.14.1. Company Overview
- 13.1.14.2. Products
- 13.1.14.3. Company Financials
- 13.1.14.4. SWOT Analysis
- 13.1.1 Haldor Topsoe A/S
- 13.2. Market Entropy
- 13.2.1 Company's Key Areas Served
- 13.2.2 Recent Developments
- 13.3. Company Market Share Analysis 2025
- 13.3.1 Top 5 Companies Market Share Analysis
- 13.3.2 Top 3 Companies Market Share Analysis
- 13.4. List of Potential Customers
- 14. Research Methodology
List of Figures
- Figure 1: MEA Refining Catalysts Industry Revenue Breakdown (billion, %) by Product 2025 & 2033
- Figure 2: MEA Refining Catalysts Industry Share (%) by Company 2025
List of Tables
- Table 1: MEA Refining Catalysts Industry Revenue billion Forecast, by Ingredient 2020 & 2033
- Table 2: MEA Refining Catalysts Industry Volume K Tons Forecast, by Ingredient 2020 & 2033
- Table 3: MEA Refining Catalysts Industry Revenue billion Forecast, by Type 2020 & 2033
- Table 4: MEA Refining Catalysts Industry Volume K Tons Forecast, by Type 2020 & 2033
- Table 5: MEA Refining Catalysts Industry Revenue billion Forecast, by Geography 2020 & 2033
- Table 6: MEA Refining Catalysts Industry Volume K Tons Forecast, by Geography 2020 & 2033
- Table 7: MEA Refining Catalysts Industry Revenue billion Forecast, by Region 2020 & 2033
- Table 8: MEA Refining Catalysts Industry Volume K Tons Forecast, by Region 2020 & 2033
- Table 9: MEA Refining Catalysts Industry Revenue billion Forecast, by Ingredient 2020 & 2033
- Table 10: MEA Refining Catalysts Industry Volume K Tons Forecast, by Ingredient 2020 & 2033
- Table 11: MEA Refining Catalysts Industry Revenue billion Forecast, by Type 2020 & 2033
- Table 12: MEA Refining Catalysts Industry Volume K Tons Forecast, by Type 2020 & 2033
- Table 13: MEA Refining Catalysts Industry Revenue billion Forecast, by Geography 2020 & 2033
- Table 14: MEA Refining Catalysts Industry Volume K Tons Forecast, by Geography 2020 & 2033
- Table 15: MEA Refining Catalysts Industry Revenue billion Forecast, by Country 2020 & 2033
- Table 16: MEA Refining Catalysts Industry Volume K Tons Forecast, by Country 2020 & 2033
- Table 17: MEA Refining Catalysts Industry Revenue billion Forecast, by Ingredient 2020 & 2033
- Table 18: MEA Refining Catalysts Industry Volume K Tons Forecast, by Ingredient 2020 & 2033
- Table 19: MEA Refining Catalysts Industry Revenue billion Forecast, by Type 2020 & 2033
- Table 20: MEA Refining Catalysts Industry Volume K Tons Forecast, by Type 2020 & 2033
- Table 21: MEA Refining Catalysts Industry Revenue billion Forecast, by Geography 2020 & 2033
- Table 22: MEA Refining Catalysts Industry Volume K Tons Forecast, by Geography 2020 & 2033
- Table 23: MEA Refining Catalysts Industry Revenue billion Forecast, by Country 2020 & 2033
- Table 24: MEA Refining Catalysts Industry Volume K Tons Forecast, by Country 2020 & 2033
- Table 25: MEA Refining Catalysts Industry Revenue billion Forecast, by Ingredient 2020 & 2033
- Table 26: MEA Refining Catalysts Industry Volume K Tons Forecast, by Ingredient 2020 & 2033
- Table 27: MEA Refining Catalysts Industry Revenue billion Forecast, by Type 2020 & 2033
- Table 28: MEA Refining Catalysts Industry Volume K Tons Forecast, by Type 2020 & 2033
- Table 29: MEA Refining Catalysts Industry Revenue billion Forecast, by Geography 2020 & 2033
- Table 30: MEA Refining Catalysts Industry Volume K Tons Forecast, by Geography 2020 & 2033
- Table 31: MEA Refining Catalysts Industry Revenue billion Forecast, by Country 2020 & 2033
- Table 32: MEA Refining Catalysts Industry Volume K Tons Forecast, by Country 2020 & 2033
- Table 33: MEA Refining Catalysts Industry Revenue billion Forecast, by Ingredient 2020 & 2033
- Table 34: MEA Refining Catalysts Industry Volume K Tons Forecast, by Ingredient 2020 & 2033
- Table 35: MEA Refining Catalysts Industry Revenue billion Forecast, by Type 2020 & 2033
- Table 36: MEA Refining Catalysts Industry Volume K Tons Forecast, by Type 2020 & 2033
- Table 37: MEA Refining Catalysts Industry Revenue billion Forecast, by Geography 2020 & 2033
- Table 38: MEA Refining Catalysts Industry Volume K Tons Forecast, by Geography 2020 & 2033
- Table 39: MEA Refining Catalysts Industry Revenue billion Forecast, by Country 2020 & 2033
- Table 40: MEA Refining Catalysts Industry Volume K Tons Forecast, by Country 2020 & 2033
- Table 41: MEA Refining Catalysts Industry Revenue billion Forecast, by Ingredient 2020 & 2033
- Table 42: MEA Refining Catalysts Industry Volume K Tons Forecast, by Ingredient 2020 & 2033
- Table 43: MEA Refining Catalysts Industry Revenue billion Forecast, by Type 2020 & 2033
- Table 44: MEA Refining Catalysts Industry Volume K Tons Forecast, by Type 2020 & 2033
- Table 45: MEA Refining Catalysts Industry Revenue billion Forecast, by Geography 2020 & 2033
- Table 46: MEA Refining Catalysts Industry Volume K Tons Forecast, by Geography 2020 & 2033
- Table 47: MEA Refining Catalysts Industry Revenue billion Forecast, by Country 2020 & 2033
- Table 48: MEA Refining Catalysts Industry Volume K Tons Forecast, by Country 2020 & 2033
- Table 49: MEA Refining Catalysts Industry Revenue billion Forecast, by Ingredient 2020 & 2033
- Table 50: MEA Refining Catalysts Industry Volume K Tons Forecast, by Ingredient 2020 & 2033
- Table 51: MEA Refining Catalysts Industry Revenue billion Forecast, by Type 2020 & 2033
- Table 52: MEA Refining Catalysts Industry Volume K Tons Forecast, by Type 2020 & 2033
- Table 53: MEA Refining Catalysts Industry Revenue billion Forecast, by Geography 2020 & 2033
- Table 54: MEA Refining Catalysts Industry Volume K Tons Forecast, by Geography 2020 & 2033
- Table 55: MEA Refining Catalysts Industry Revenue billion Forecast, by Country 2020 & 2033
- Table 56: MEA Refining Catalysts Industry Volume K Tons Forecast, by Country 2020 & 2033
Frequently Asked Questions
1. What is the projected Compound Annual Growth Rate (CAGR) of the MEA Refining Catalysts Industry?
The projected CAGR is approximately 5.85%.
2. Which companies are prominent players in the MEA Refining Catalysts Industry?
Key companies in the market include Haldor Topsoe A/S, Axens, Honeywell International Inc, Clariant, Exxon Mobil Corporation, Evonik Industries AG, W R Grace & Co -Conn, BASF SE, Chevron Corporation, DuPont, Saudi Arabian Oil Co, JGC C & C, Johnson Matthey, Albemarle Corporation.
3. What are the main segments of the MEA Refining Catalysts Industry?
The market segments include Ingredient, Type, Geography.
4. Can you provide details about the market size?
The market size is estimated to be USD 1.2 billion as of 2022.
5. What are some drivers contributing to market growth?
; Accelerating Demand For Higher Octane Fuels; Increasing Investments in Refineries.
6. What are the notable trends driving market growth?
Fluid Catalytic Cracking (FCC) Catalysts to Dominate the Market.
7. Are there any restraints impacting market growth?
; Volatility in Precious Metal Prices.
8. Can you provide examples of recent developments in the market?
N/A
9. What pricing options are available for accessing the report?
Pricing options include single-user, multi-user, and enterprise licenses priced at USD 3,950, USD 4,950, and USD 6,950 respectively.
10. Is the market size provided in terms of value or volume?
The market size is provided in terms of value, measured in billion and volume, measured in K Tons.
11. Are there any specific market keywords associated with the report?
Yes, the market keyword associated with the report is "MEA Refining Catalysts Industry," which aids in identifying and referencing the specific market segment covered.
12. How do I determine which pricing option suits my needs best?
The pricing options vary based on user requirements and access needs. Individual users may opt for single-user licenses, while businesses requiring broader access may choose multi-user or enterprise licenses for cost-effective access to the report.
13. Are there any additional resources or data provided in the MEA Refining Catalysts Industry report?
While the report offers comprehensive insights, it's advisable to review the specific contents or supplementary materials provided to ascertain if additional resources or data are available.
14. How can I stay updated on further developments or reports in the MEA Refining Catalysts Industry?
To stay informed about further developments, trends, and reports in the MEA Refining Catalysts Industry, consider subscribing to industry newsletters, following relevant companies and organizations, or regularly checking reputable industry news sources and publications.
Methodology
Step 1 - Identification of Relevant Samples Size from Population Database


Step 2 - Approaches for Defining Global Market Size (Value, Volume* & Price*)

Note*: In applicable scenarios
Step 3 - Data Sources
Primary Research
- Web Analytics
- Survey Reports
- Research Institute
- Latest Research Reports
- Opinion Leaders
Secondary Research
- Annual Reports
- White Paper
- Latest Press Release
- Industry Association
- Paid Database
- Investor Presentations

Step 4 - Data Triangulation
Involves using different sources of information in order to increase the validity of a study
These sources are likely to be stakeholders in a program - participants, other researchers, program staff, other community members, and so on.
Then we put all data in single framework & apply various statistical tools to find out the dynamic on the market.
During the analysis stage, feedback from the stakeholder groups would be compared to determine areas of agreement as well as areas of divergence