

Key Insights
The Middle East and Africa (MEA) lithium market is experiencing robust growth, fueled by the burgeoning demand for lithium-ion batteries in the burgeoning electric vehicle (EV) sector and the expanding energy storage systems market. The region's considerable reserves of lithium, coupled with supportive government policies promoting renewable energy adoption and sustainable transportation, are key drivers of this expansion. While precise market size figures for 2025 are unavailable, a CAGR of 12.93% from a base year (assuming 2019 data as a starting point), suggests significant growth. Considering the global lithium market size and growth rate, it’s reasonable to estimate the MEA lithium market value in 2025 to be in the range of $200-$300 million. This is supported by the increased investments in lithium extraction and processing facilities within the region. The market segmentation reveals that battery applications, primarily driven by EV adoption, are the most dominant segment, followed by energy storage applications in the industrial and utility sectors. Significant potential also exists within other applications like grease, air treatment, and specialized industries.
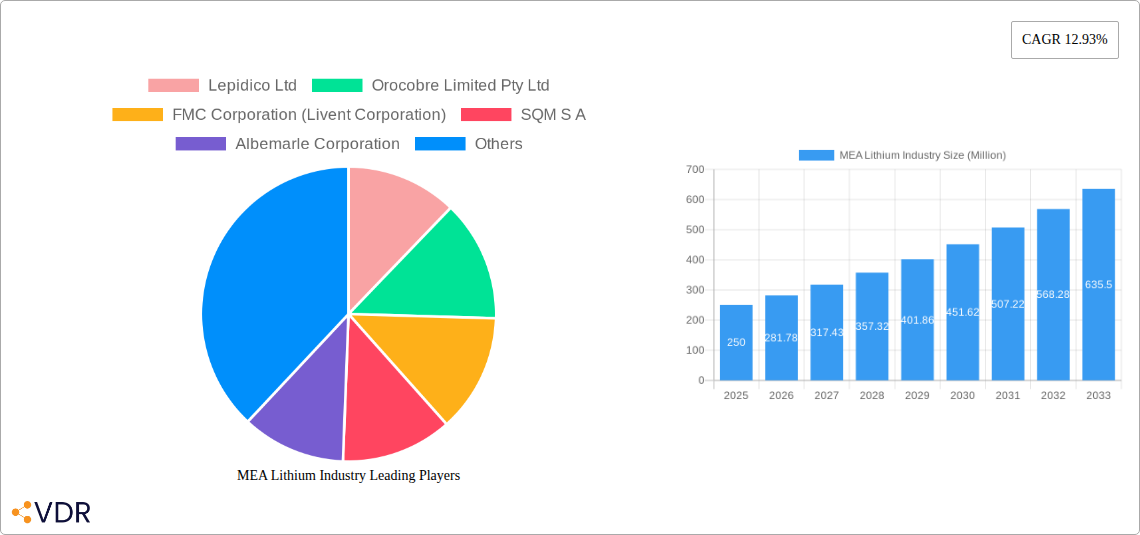
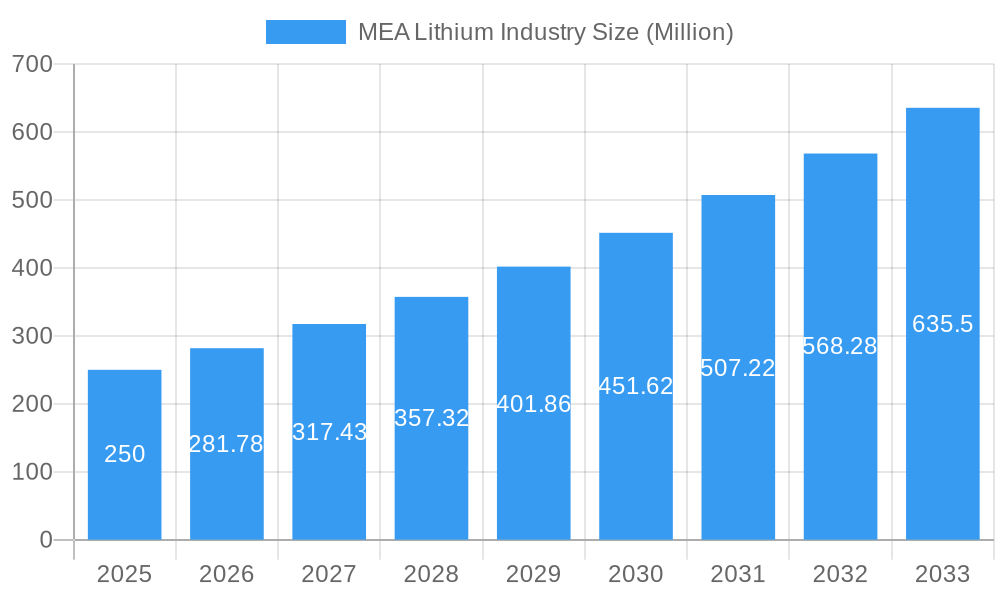
MEA Lithium Industry Market Size (In Million)
However, the MEA lithium market faces some challenges. The relatively nascent nature of the lithium industry in the region means that production capacity is still developing. Supply chain complexities and infrastructure limitations can hamper growth. Furthermore, environmental concerns surrounding lithium mining and processing, coupled with price volatility tied to global lithium supply, present obstacles. Despite these constraints, the long-term outlook for the MEA lithium market remains positive. Strategic investments in sustainable mining practices, improvements in processing technologies, and regional collaborations to strengthen the supply chain are crucial for unlocking the full potential of this vital resource. The increasing focus on regional self-sufficiency in key materials like lithium will further contribute to the market’s continued expansion in the coming years.
MEA Lithium Industry Company Market Share
MEA Lithium Industry Market Report: 2019-2033
This comprehensive report provides a detailed analysis of the Middle East and Africa (MEA) lithium industry, encompassing market dynamics, growth trends, key players, and future outlook. The report covers the historical period (2019-2024), the base year (2025), and forecasts until 2033, offering invaluable insights for industry professionals, investors, and strategic decision-makers. The report segments the market by Type (Metal, Compound, Hydroxide, Alloy), Application (Battery, Grease, Air Treatment, Pharmaceuticals, Glass/Ceramic, Polymer, Other Applications), and End-user Industry (Industrial, Consumer Electronics, Energy Storage, Medical, Automotive, Other End-user Industries).
MEA Lithium Industry Market Dynamics & Structure
The MEA lithium market is characterized by moderate concentration, with key players such as Albemarle Corporation, SQM S.A, and FMC Corporation (Livent Corporation) holding significant market share. However, new entrants and technological advancements are gradually shifting the competitive landscape. The market is driven by the burgeoning electric vehicle (EV) sector and growing demand for lithium-ion batteries in energy storage solutions. Regulatory frameworks promoting renewable energy and sustainable technologies are also playing a crucial role. While technological innovation is accelerating, high capital expenditures and complex extraction processes pose significant barriers to entry. The market also witnesses frequent mergers and acquisitions (M&A) activities, aiming to secure lithium resources and expand market presence. In 2024, the M&A deal volume was estimated at xx Million USD.
- Market Concentration: Moderately concentrated, with top 3 players holding xx% market share in 2024.
- Technological Innovation: Driven by advancements in battery technology and extraction methods.
- Regulatory Framework: Supportive policies promoting renewable energy adoption.
- Competitive Substitutes: Limited substitutes exist for lithium in many applications.
- End-User Demographics: Primarily driven by growing industrial and automotive sectors.
- M&A Trends: Significant activity observed, with xx deals valued at xx Million USD in 2024.
MEA Lithium Industry Growth Trends & Insights
The MEA lithium market is witnessing robust growth, driven by the region's expanding industrialization and increasing adoption of electric vehicles. The market size is projected to expand significantly from xx Million units in 2025 to xx Million units by 2033, registering a Compound Annual Growth Rate (CAGR) of xx%. This growth is fueled by technological advancements leading to improved battery performance and efficiency, as well as government initiatives supporting the deployment of renewable energy technologies. Changing consumer behavior, particularly a heightened preference for electric vehicles, further bolsters demand. The market penetration rate for lithium-ion batteries in the energy storage sector is projected to increase from xx% in 2025 to xx% by 2033.
Dominant Regions, Countries, or Segments in MEA Lithium Industry
The battery application segment dominates the MEA lithium market, accounting for xx% of total market value in 2024, followed by the industrial and consumer electronics end-user sectors. Within the MEA region, [Country Name, e.g., Saudi Arabia] shows the highest growth potential due to its focus on renewable energy projects and strategic investments in lithium extraction. Key growth drivers include supportive government policies, growing investments in infrastructure, and rising disposable incomes.
- Key Drivers:
- Growing demand from the automotive industry.
- Supportive government policies and incentives.
- Investments in renewable energy infrastructure.
- Increasing adoption of electric vehicles.
- Dominant Segment: Battery application segment holds the largest market share (xx%).
- Leading Country: [Country Name, e.g., Saudi Arabia]
MEA Lithium Industry Product Landscape
The MEA lithium market offers a diverse range of products, including lithium metal, lithium compounds, lithium hydroxide, and lithium alloys. Recent innovations focus on improving lithium extraction efficiency, enhancing battery performance, and developing sustainable production processes. Key product differentiators include purity levels, cost-effectiveness, and environmental impact. The market is witnessing the emergence of high-nickel cathode materials and solid-state batteries, promising significant improvements in energy density and safety.
Key Drivers, Barriers & Challenges in MEA Lithium Industry
Key Drivers:
- Growing demand from the electric vehicle sector.
- Rising investments in renewable energy infrastructure.
- Supportive government policies and incentives.
Challenges & Restraints:
- High capital expenditure for lithium extraction and processing.
- Geopolitical risks and supply chain disruptions.
- Environmental concerns related to lithium mining and processing.
- Price volatility of lithium raw materials.
Emerging Opportunities in MEA Lithium Industry
Emerging opportunities include the development of lithium-sulfur and solid-state batteries, the exploration of new lithium resources, and the expansion into niche applications like pharmaceuticals and glass ceramics. Untapped markets in the MEA region present significant potential for growth, especially in countries with ambitious renewable energy targets. The increasing focus on sustainable sourcing and ethical production practices also opens up new market avenues for responsible lithium producers.
Growth Accelerators in the MEA Lithium Industry Industry
Technological breakthroughs in battery technology, strategic partnerships between lithium producers and battery manufacturers, and strategic market expansion initiatives will accelerate growth in the MEA lithium industry. This includes investment in R&D for enhanced extraction techniques and downstream processing capabilities, thus solidifying the region's position in the global lithium value chain. Furthermore, establishing robust and transparent supply chains will mitigate risks and attract further investment.
Key Players Shaping the MEA Lithium Industry Market
Notable Milestones in MEA Lithium Industry Sector
- April 2022: SQM S.A announced a USD 900 million investment to increase lithium carbonate and hydroxide production capacity, aiming for 180,000 metric tons annually by the end of 2022, and potentially reaching 210,000 tons by early 2023.
In-Depth MEA Lithium Industry Market Outlook
The MEA lithium market is poised for significant growth over the forecast period, driven by increasing demand from the electric vehicle and energy storage sectors. Strategic investments in lithium extraction, processing, and battery manufacturing will be key to realizing this potential. Collaboration between governments, industry players, and research institutions will be essential in developing a sustainable and resilient lithium industry in the MEA region. The future outlook remains positive, presenting significant opportunities for businesses to capitalize on the growing demand for lithium and its related applications.
MEA Lithium Industry Segmentation
-
1. Type
- 1.1. Metal
-
1.2. Compound
- 1.2.1. Carbonate
- 1.2.2. Chloride
- 1.2.3. Hydroxide
- 1.3. Alloy
-
2. Application
- 2.1. Battery
- 2.2. Grease
- 2.3. Air Treatment
- 2.4. Pharmaceuticals
- 2.5. Glass/Ceramic (including Frits)
- 2.6. Polymer
- 2.7. Other Applications
-
3. End-user Industry
- 3.1. Industrial
- 3.2. Consumer Electronics
- 3.3. Energy storage
- 3.4. Medical
- 3.5. Automotive
- 3.6. Other End-user Industries
MEA Lithium Industry Segmentation By Geography
-
1. North America
- 1.1. United States
- 1.2. Canada
- 1.3. Mexico
-
2. South America
- 2.1. Brazil
- 2.2. Argentina
- 2.3. Rest of South America
-
3. Europe
- 3.1. United Kingdom
- 3.2. Germany
- 3.3. France
- 3.4. Italy
- 3.5. Spain
- 3.6. Russia
- 3.7. Benelux
- 3.8. Nordics
- 3.9. Rest of Europe
-
4. Middle East & Africa
- 4.1. Turkey
- 4.2. Israel
- 4.3. GCC
- 4.4. North Africa
- 4.5. South Africa
- 4.6. Rest of Middle East & Africa
-
5. Asia Pacific
- 5.1. China
- 5.2. India
- 5.3. Japan
- 5.4. South Korea
- 5.5. ASEAN
- 5.6. Oceania
- 5.7. Rest of Asia Pacific
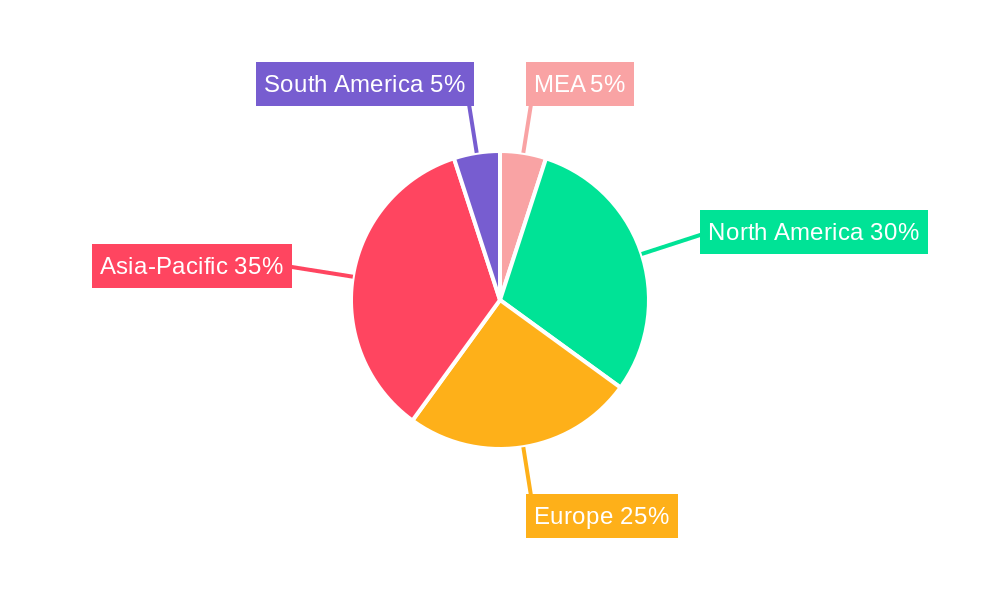
MEA Lithium Industry Regional Market Share
Geographic Coverage of MEA Lithium Industry
MEA Lithium Industry REPORT HIGHLIGHTS
| Aspects | Details |
|---|---|
| Study Period | 2020-2034 |
| Base Year | 2025 |
| Estimated Year | 2026 |
| Forecast Period | 2026-2034 |
| Historical Period | 2020-2025 |
| Growth Rate | CAGR of 6.8% from 2020-2034 |
| Segmentation |
|
Table of Contents
- 1. Introduction
- 1.1. Research Scope
- 1.2. Market Segmentation
- 1.3. Research Objective
- 1.4. Definitions and Assumptions
- 2. Executive Summary
- 2.1. Market Snapshot
- 3. Market Dynamics
- 3.1. Market Drivers
- 3.2. Market Restrains
- 3.3. Market Trends
- 3.4. Market Opportunities
- 4. Market Factor Analysis
- 4.1. Porters Five Forces
- 4.1.1. Bargaining Power of Suppliers
- 4.1.2. Bargaining Power of Buyers
- 4.1.3. Threat of New Entrants
- 4.1.4. Threat of Substitutes
- 4.1.5. Competitive Rivalry
- 4.2. PESTEL analysis
- 4.3. BCG Analysis
- 4.3.1. Stars (High Growth, High Market Share)
- 4.3.2. Cash Cows (Low Growth, High Market Share)
- 4.3.3. Question Mark (High Growth, Low Market Share)
- 4.3.4. Dogs (Low Growth, Low Market Share)
- 4.4. Ansoff Matrix Analysis
- 4.5. Supply Chain Analysis
- 4.6. Regulatory Landscape
- 4.7. Current Market Potential and Opportunity Assessment (TAM–SAM–SOM Framework)
- 4.8. VDR Analyst Note
- 4.1. Porters Five Forces
- 5. Market Analysis, Insights and Forecast 2021-2033
- 5.1. Market Analysis, Insights and Forecast - by Type
- 5.1.1. Metal
- 5.1.2. Compound
- 5.1.2.1. Carbonate
- 5.1.2.2. Chloride
- 5.1.2.3. Hydroxide
- 5.1.3. Alloy
- 5.2. Market Analysis, Insights and Forecast - by Application
- 5.2.1. Battery
- 5.2.2. Grease
- 5.2.3. Air Treatment
- 5.2.4. Pharmaceuticals
- 5.2.5. Glass/Ceramic (including Frits)
- 5.2.6. Polymer
- 5.2.7. Other Applications
- 5.3. Market Analysis, Insights and Forecast - by End-user Industry
- 5.3.1. Industrial
- 5.3.2. Consumer Electronics
- 5.3.3. Energy storage
- 5.3.4. Medical
- 5.3.5. Automotive
- 5.3.6. Other End-user Industries
- 5.4. Market Analysis, Insights and Forecast - by Region
- 5.4.1. North America
- 5.4.2. South America
- 5.4.3. Europe
- 5.4.4. Middle East & Africa
- 5.4.5. Asia Pacific
- 5.1. Market Analysis, Insights and Forecast - by Type
- 6. Global MEA Lithium Industry Analysis, Insights and Forecast, 2021-2033
- 6.1. Market Analysis, Insights and Forecast - by Type
- 6.1.1. Metal
- 6.1.2. Compound
- 6.1.2.1. Carbonate
- 6.1.2.2. Chloride
- 6.1.2.3. Hydroxide
- 6.1.3. Alloy
- 6.2. Market Analysis, Insights and Forecast - by Application
- 6.2.1. Battery
- 6.2.2. Grease
- 6.2.3. Air Treatment
- 6.2.4. Pharmaceuticals
- 6.2.5. Glass/Ceramic (including Frits)
- 6.2.6. Polymer
- 6.2.7. Other Applications
- 6.3. Market Analysis, Insights and Forecast - by End-user Industry
- 6.3.1. Industrial
- 6.3.2. Consumer Electronics
- 6.3.3. Energy storage
- 6.3.4. Medical
- 6.3.5. Automotive
- 6.3.6. Other End-user Industries
- 6.1. Market Analysis, Insights and Forecast - by Type
- 7. North America MEA Lithium Industry Analysis, Insights and Forecast, 2021-2033
- 7.1. Market Analysis, Insights and Forecast - by Type
- 7.1.1. Metal
- 7.1.2. Compound
- 7.1.2.1. Carbonate
- 7.1.2.2. Chloride
- 7.1.2.3. Hydroxide
- 7.1.3. Alloy
- 7.2. Market Analysis, Insights and Forecast - by Application
- 7.2.1. Battery
- 7.2.2. Grease
- 7.2.3. Air Treatment
- 7.2.4. Pharmaceuticals
- 7.2.5. Glass/Ceramic (including Frits)
- 7.2.6. Polymer
- 7.2.7. Other Applications
- 7.3. Market Analysis, Insights and Forecast - by End-user Industry
- 7.3.1. Industrial
- 7.3.2. Consumer Electronics
- 7.3.3. Energy storage
- 7.3.4. Medical
- 7.3.5. Automotive
- 7.3.6. Other End-user Industries
- 7.1. Market Analysis, Insights and Forecast - by Type
- 8. South America MEA Lithium Industry Analysis, Insights and Forecast, 2021-2033
- 8.1. Market Analysis, Insights and Forecast - by Type
- 8.1.1. Metal
- 8.1.2. Compound
- 8.1.2.1. Carbonate
- 8.1.2.2. Chloride
- 8.1.2.3. Hydroxide
- 8.1.3. Alloy
- 8.2. Market Analysis, Insights and Forecast - by Application
- 8.2.1. Battery
- 8.2.2. Grease
- 8.2.3. Air Treatment
- 8.2.4. Pharmaceuticals
- 8.2.5. Glass/Ceramic (including Frits)
- 8.2.6. Polymer
- 8.2.7. Other Applications
- 8.3. Market Analysis, Insights and Forecast - by End-user Industry
- 8.3.1. Industrial
- 8.3.2. Consumer Electronics
- 8.3.3. Energy storage
- 8.3.4. Medical
- 8.3.5. Automotive
- 8.3.6. Other End-user Industries
- 8.1. Market Analysis, Insights and Forecast - by Type
- 9. Europe MEA Lithium Industry Analysis, Insights and Forecast, 2021-2033
- 9.1. Market Analysis, Insights and Forecast - by Type
- 9.1.1. Metal
- 9.1.2. Compound
- 9.1.2.1. Carbonate
- 9.1.2.2. Chloride
- 9.1.2.3. Hydroxide
- 9.1.3. Alloy
- 9.2. Market Analysis, Insights and Forecast - by Application
- 9.2.1. Battery
- 9.2.2. Grease
- 9.2.3. Air Treatment
- 9.2.4. Pharmaceuticals
- 9.2.5. Glass/Ceramic (including Frits)
- 9.2.6. Polymer
- 9.2.7. Other Applications
- 9.3. Market Analysis, Insights and Forecast - by End-user Industry
- 9.3.1. Industrial
- 9.3.2. Consumer Electronics
- 9.3.3. Energy storage
- 9.3.4. Medical
- 9.3.5. Automotive
- 9.3.6. Other End-user Industries
- 9.1. Market Analysis, Insights and Forecast - by Type
- 10. Middle East & Africa MEA Lithium Industry Analysis, Insights and Forecast, 2021-2033
- 10.1. Market Analysis, Insights and Forecast - by Type
- 10.1.1. Metal
- 10.1.2. Compound
- 10.1.2.1. Carbonate
- 10.1.2.2. Chloride
- 10.1.2.3. Hydroxide
- 10.1.3. Alloy
- 10.2. Market Analysis, Insights and Forecast - by Application
- 10.2.1. Battery
- 10.2.2. Grease
- 10.2.3. Air Treatment
- 10.2.4. Pharmaceuticals
- 10.2.5. Glass/Ceramic (including Frits)
- 10.2.6. Polymer
- 10.2.7. Other Applications
- 10.3. Market Analysis, Insights and Forecast - by End-user Industry
- 10.3.1. Industrial
- 10.3.2. Consumer Electronics
- 10.3.3. Energy storage
- 10.3.4. Medical
- 10.3.5. Automotive
- 10.3.6. Other End-user Industries
- 10.1. Market Analysis, Insights and Forecast - by Type
- 11. Asia Pacific MEA Lithium Industry Analysis, Insights and Forecast, 2021-2033
- 11.1. Market Analysis, Insights and Forecast - by Type
- 11.1.1. Metal
- 11.1.2. Compound
- 11.1.2.1. Carbonate
- 11.1.2.2. Chloride
- 11.1.2.3. Hydroxide
- 11.1.3. Alloy
- 11.2. Market Analysis, Insights and Forecast - by Application
- 11.2.1. Battery
- 11.2.2. Grease
- 11.2.3. Air Treatment
- 11.2.4. Pharmaceuticals
- 11.2.5. Glass/Ceramic (including Frits)
- 11.2.6. Polymer
- 11.2.7. Other Applications
- 11.3. Market Analysis, Insights and Forecast - by End-user Industry
- 11.3.1. Industrial
- 11.3.2. Consumer Electronics
- 11.3.3. Energy storage
- 11.3.4. Medical
- 11.3.5. Automotive
- 11.3.6. Other End-user Industries
- 11.1. Market Analysis, Insights and Forecast - by Type
- 12. Competitive Analysis
- 12.1. Company Profiles
- 12.1.1 Lepidico Ltd
- 12.1.1.1. Company Overview
- 12.1.1.2. Products
- 12.1.1.3. Company Financials
- 12.1.1.4. SWOT Analysis
- 12.1.2 Orocobre Limited Pty Ltd
- 12.1.2.1. Company Overview
- 12.1.2.2. Products
- 12.1.2.3. Company Financials
- 12.1.2.4. SWOT Analysis
- 12.1.3 FMC Corporation (Livent Corporation)
- 12.1.3.1. Company Overview
- 12.1.3.2. Products
- 12.1.3.3. Company Financials
- 12.1.3.4. SWOT Analysis
- 12.1.4 SQM S A
- 12.1.4.1. Company Overview
- 12.1.4.2. Products
- 12.1.4.3. Company Financials
- 12.1.4.4. SWOT Analysis
- 12.1.5 Albemarle Corporation
- 12.1.5.1. Company Overview
- 12.1.5.2. Products
- 12.1.5.3. Company Financials
- 12.1.5.4. SWOT Analysis
- 12.1.1 Lepidico Ltd
- 12.2. Market Entropy
- 12.2.1 Company's Key Areas Served
- 12.2.2 Recent Developments
- 12.3. Company Market Share Analysis 2025
- 12.3.1 Top 5 Companies Market Share Analysis
- 12.3.2 Top 3 Companies Market Share Analysis
- 12.4. List of Potential Customers
- 13. Research Methodology
List of Figures
- Figure 1: Global MEA Lithium Industry Revenue Breakdown (billion, %) by Region 2025 & 2033
- Figure 2: Global MEA Lithium Industry Volume Breakdown (K Tons, %) by Region 2025 & 2033
- Figure 3: North America MEA Lithium Industry Revenue (billion), by Type 2025 & 2033
- Figure 4: North America MEA Lithium Industry Volume (K Tons), by Type 2025 & 2033
- Figure 5: North America MEA Lithium Industry Revenue Share (%), by Type 2025 & 2033
- Figure 6: North America MEA Lithium Industry Volume Share (%), by Type 2025 & 2033
- Figure 7: North America MEA Lithium Industry Revenue (billion), by Application 2025 & 2033
- Figure 8: North America MEA Lithium Industry Volume (K Tons), by Application 2025 & 2033
- Figure 9: North America MEA Lithium Industry Revenue Share (%), by Application 2025 & 2033
- Figure 10: North America MEA Lithium Industry Volume Share (%), by Application 2025 & 2033
- Figure 11: North America MEA Lithium Industry Revenue (billion), by End-user Industry 2025 & 2033
- Figure 12: North America MEA Lithium Industry Volume (K Tons), by End-user Industry 2025 & 2033
- Figure 13: North America MEA Lithium Industry Revenue Share (%), by End-user Industry 2025 & 2033
- Figure 14: North America MEA Lithium Industry Volume Share (%), by End-user Industry 2025 & 2033
- Figure 15: North America MEA Lithium Industry Revenue (billion), by Country 2025 & 2033
- Figure 16: North America MEA Lithium Industry Volume (K Tons), by Country 2025 & 2033
- Figure 17: North America MEA Lithium Industry Revenue Share (%), by Country 2025 & 2033
- Figure 18: North America MEA Lithium Industry Volume Share (%), by Country 2025 & 2033
- Figure 19: South America MEA Lithium Industry Revenue (billion), by Type 2025 & 2033
- Figure 20: South America MEA Lithium Industry Volume (K Tons), by Type 2025 & 2033
- Figure 21: South America MEA Lithium Industry Revenue Share (%), by Type 2025 & 2033
- Figure 22: South America MEA Lithium Industry Volume Share (%), by Type 2025 & 2033
- Figure 23: South America MEA Lithium Industry Revenue (billion), by Application 2025 & 2033
- Figure 24: South America MEA Lithium Industry Volume (K Tons), by Application 2025 & 2033
- Figure 25: South America MEA Lithium Industry Revenue Share (%), by Application 2025 & 2033
- Figure 26: South America MEA Lithium Industry Volume Share (%), by Application 2025 & 2033
- Figure 27: South America MEA Lithium Industry Revenue (billion), by End-user Industry 2025 & 2033
- Figure 28: South America MEA Lithium Industry Volume (K Tons), by End-user Industry 2025 & 2033
- Figure 29: South America MEA Lithium Industry Revenue Share (%), by End-user Industry 2025 & 2033
- Figure 30: South America MEA Lithium Industry Volume Share (%), by End-user Industry 2025 & 2033
- Figure 31: South America MEA Lithium Industry Revenue (billion), by Country 2025 & 2033
- Figure 32: South America MEA Lithium Industry Volume (K Tons), by Country 2025 & 2033
- Figure 33: South America MEA Lithium Industry Revenue Share (%), by Country 2025 & 2033
- Figure 34: South America MEA Lithium Industry Volume Share (%), by Country 2025 & 2033
- Figure 35: Europe MEA Lithium Industry Revenue (billion), by Type 2025 & 2033
- Figure 36: Europe MEA Lithium Industry Volume (K Tons), by Type 2025 & 2033
- Figure 37: Europe MEA Lithium Industry Revenue Share (%), by Type 2025 & 2033
- Figure 38: Europe MEA Lithium Industry Volume Share (%), by Type 2025 & 2033
- Figure 39: Europe MEA Lithium Industry Revenue (billion), by Application 2025 & 2033
- Figure 40: Europe MEA Lithium Industry Volume (K Tons), by Application 2025 & 2033
- Figure 41: Europe MEA Lithium Industry Revenue Share (%), by Application 2025 & 2033
- Figure 42: Europe MEA Lithium Industry Volume Share (%), by Application 2025 & 2033
- Figure 43: Europe MEA Lithium Industry Revenue (billion), by End-user Industry 2025 & 2033
- Figure 44: Europe MEA Lithium Industry Volume (K Tons), by End-user Industry 2025 & 2033
- Figure 45: Europe MEA Lithium Industry Revenue Share (%), by End-user Industry 2025 & 2033
- Figure 46: Europe MEA Lithium Industry Volume Share (%), by End-user Industry 2025 & 2033
- Figure 47: Europe MEA Lithium Industry Revenue (billion), by Country 2025 & 2033
- Figure 48: Europe MEA Lithium Industry Volume (K Tons), by Country 2025 & 2033
- Figure 49: Europe MEA Lithium Industry Revenue Share (%), by Country 2025 & 2033
- Figure 50: Europe MEA Lithium Industry Volume Share (%), by Country 2025 & 2033
- Figure 51: Middle East & Africa MEA Lithium Industry Revenue (billion), by Type 2025 & 2033
- Figure 52: Middle East & Africa MEA Lithium Industry Volume (K Tons), by Type 2025 & 2033
- Figure 53: Middle East & Africa MEA Lithium Industry Revenue Share (%), by Type 2025 & 2033
- Figure 54: Middle East & Africa MEA Lithium Industry Volume Share (%), by Type 2025 & 2033
- Figure 55: Middle East & Africa MEA Lithium Industry Revenue (billion), by Application 2025 & 2033
- Figure 56: Middle East & Africa MEA Lithium Industry Volume (K Tons), by Application 2025 & 2033
- Figure 57: Middle East & Africa MEA Lithium Industry Revenue Share (%), by Application 2025 & 2033
- Figure 58: Middle East & Africa MEA Lithium Industry Volume Share (%), by Application 2025 & 2033
- Figure 59: Middle East & Africa MEA Lithium Industry Revenue (billion), by End-user Industry 2025 & 2033
- Figure 60: Middle East & Africa MEA Lithium Industry Volume (K Tons), by End-user Industry 2025 & 2033
- Figure 61: Middle East & Africa MEA Lithium Industry Revenue Share (%), by End-user Industry 2025 & 2033
- Figure 62: Middle East & Africa MEA Lithium Industry Volume Share (%), by End-user Industry 2025 & 2033
- Figure 63: Middle East & Africa MEA Lithium Industry Revenue (billion), by Country 2025 & 2033
- Figure 64: Middle East & Africa MEA Lithium Industry Volume (K Tons), by Country 2025 & 2033
- Figure 65: Middle East & Africa MEA Lithium Industry Revenue Share (%), by Country 2025 & 2033
- Figure 66: Middle East & Africa MEA Lithium Industry Volume Share (%), by Country 2025 & 2033
- Figure 67: Asia Pacific MEA Lithium Industry Revenue (billion), by Type 2025 & 2033
- Figure 68: Asia Pacific MEA Lithium Industry Volume (K Tons), by Type 2025 & 2033
- Figure 69: Asia Pacific MEA Lithium Industry Revenue Share (%), by Type 2025 & 2033
- Figure 70: Asia Pacific MEA Lithium Industry Volume Share (%), by Type 2025 & 2033
- Figure 71: Asia Pacific MEA Lithium Industry Revenue (billion), by Application 2025 & 2033
- Figure 72: Asia Pacific MEA Lithium Industry Volume (K Tons), by Application 2025 & 2033
- Figure 73: Asia Pacific MEA Lithium Industry Revenue Share (%), by Application 2025 & 2033
- Figure 74: Asia Pacific MEA Lithium Industry Volume Share (%), by Application 2025 & 2033
- Figure 75: Asia Pacific MEA Lithium Industry Revenue (billion), by End-user Industry 2025 & 2033
- Figure 76: Asia Pacific MEA Lithium Industry Volume (K Tons), by End-user Industry 2025 & 2033
- Figure 77: Asia Pacific MEA Lithium Industry Revenue Share (%), by End-user Industry 2025 & 2033
- Figure 78: Asia Pacific MEA Lithium Industry Volume Share (%), by End-user Industry 2025 & 2033
- Figure 79: Asia Pacific MEA Lithium Industry Revenue (billion), by Country 2025 & 2033
- Figure 80: Asia Pacific MEA Lithium Industry Volume (K Tons), by Country 2025 & 2033
- Figure 81: Asia Pacific MEA Lithium Industry Revenue Share (%), by Country 2025 & 2033
- Figure 82: Asia Pacific MEA Lithium Industry Volume Share (%), by Country 2025 & 2033
List of Tables
- Table 1: Global MEA Lithium Industry Revenue billion Forecast, by Type 2020 & 2033
- Table 2: Global MEA Lithium Industry Volume K Tons Forecast, by Type 2020 & 2033
- Table 3: Global MEA Lithium Industry Revenue billion Forecast, by Application 2020 & 2033
- Table 4: Global MEA Lithium Industry Volume K Tons Forecast, by Application 2020 & 2033
- Table 5: Global MEA Lithium Industry Revenue billion Forecast, by End-user Industry 2020 & 2033
- Table 6: Global MEA Lithium Industry Volume K Tons Forecast, by End-user Industry 2020 & 2033
- Table 7: Global MEA Lithium Industry Revenue billion Forecast, by Region 2020 & 2033
- Table 8: Global MEA Lithium Industry Volume K Tons Forecast, by Region 2020 & 2033
- Table 9: Global MEA Lithium Industry Revenue billion Forecast, by Type 2020 & 2033
- Table 10: Global MEA Lithium Industry Volume K Tons Forecast, by Type 2020 & 2033
- Table 11: Global MEA Lithium Industry Revenue billion Forecast, by Application 2020 & 2033
- Table 12: Global MEA Lithium Industry Volume K Tons Forecast, by Application 2020 & 2033
- Table 13: Global MEA Lithium Industry Revenue billion Forecast, by End-user Industry 2020 & 2033
- Table 14: Global MEA Lithium Industry Volume K Tons Forecast, by End-user Industry 2020 & 2033
- Table 15: Global MEA Lithium Industry Revenue billion Forecast, by Country 2020 & 2033
- Table 16: Global MEA Lithium Industry Volume K Tons Forecast, by Country 2020 & 2033
- Table 17: United States MEA Lithium Industry Revenue (billion) Forecast, by Application 2020 & 2033
- Table 18: United States MEA Lithium Industry Volume (K Tons) Forecast, by Application 2020 & 2033
- Table 19: Canada MEA Lithium Industry Revenue (billion) Forecast, by Application 2020 & 2033
- Table 20: Canada MEA Lithium Industry Volume (K Tons) Forecast, by Application 2020 & 2033
- Table 21: Mexico MEA Lithium Industry Revenue (billion) Forecast, by Application 2020 & 2033
- Table 22: Mexico MEA Lithium Industry Volume (K Tons) Forecast, by Application 2020 & 2033
- Table 23: Global MEA Lithium Industry Revenue billion Forecast, by Type 2020 & 2033
- Table 24: Global MEA Lithium Industry Volume K Tons Forecast, by Type 2020 & 2033
- Table 25: Global MEA Lithium Industry Revenue billion Forecast, by Application 2020 & 2033
- Table 26: Global MEA Lithium Industry Volume K Tons Forecast, by Application 2020 & 2033
- Table 27: Global MEA Lithium Industry Revenue billion Forecast, by End-user Industry 2020 & 2033
- Table 28: Global MEA Lithium Industry Volume K Tons Forecast, by End-user Industry 2020 & 2033
- Table 29: Global MEA Lithium Industry Revenue billion Forecast, by Country 2020 & 2033
- Table 30: Global MEA Lithium Industry Volume K Tons Forecast, by Country 2020 & 2033
- Table 31: Brazil MEA Lithium Industry Revenue (billion) Forecast, by Application 2020 & 2033
- Table 32: Brazil MEA Lithium Industry Volume (K Tons) Forecast, by Application 2020 & 2033
- Table 33: Argentina MEA Lithium Industry Revenue (billion) Forecast, by Application 2020 & 2033
- Table 34: Argentina MEA Lithium Industry Volume (K Tons) Forecast, by Application 2020 & 2033
- Table 35: Rest of South America MEA Lithium Industry Revenue (billion) Forecast, by Application 2020 & 2033
- Table 36: Rest of South America MEA Lithium Industry Volume (K Tons) Forecast, by Application 2020 & 2033
- Table 37: Global MEA Lithium Industry Revenue billion Forecast, by Type 2020 & 2033
- Table 38: Global MEA Lithium Industry Volume K Tons Forecast, by Type 2020 & 2033
- Table 39: Global MEA Lithium Industry Revenue billion Forecast, by Application 2020 & 2033
- Table 40: Global MEA Lithium Industry Volume K Tons Forecast, by Application 2020 & 2033
- Table 41: Global MEA Lithium Industry Revenue billion Forecast, by End-user Industry 2020 & 2033
- Table 42: Global MEA Lithium Industry Volume K Tons Forecast, by End-user Industry 2020 & 2033
- Table 43: Global MEA Lithium Industry Revenue billion Forecast, by Country 2020 & 2033
- Table 44: Global MEA Lithium Industry Volume K Tons Forecast, by Country 2020 & 2033
- Table 45: United Kingdom MEA Lithium Industry Revenue (billion) Forecast, by Application 2020 & 2033
- Table 46: United Kingdom MEA Lithium Industry Volume (K Tons) Forecast, by Application 2020 & 2033
- Table 47: Germany MEA Lithium Industry Revenue (billion) Forecast, by Application 2020 & 2033
- Table 48: Germany MEA Lithium Industry Volume (K Tons) Forecast, by Application 2020 & 2033
- Table 49: France MEA Lithium Industry Revenue (billion) Forecast, by Application 2020 & 2033
- Table 50: France MEA Lithium Industry Volume (K Tons) Forecast, by Application 2020 & 2033
- Table 51: Italy MEA Lithium Industry Revenue (billion) Forecast, by Application 2020 & 2033
- Table 52: Italy MEA Lithium Industry Volume (K Tons) Forecast, by Application 2020 & 2033
- Table 53: Spain MEA Lithium Industry Revenue (billion) Forecast, by Application 2020 & 2033
- Table 54: Spain MEA Lithium Industry Volume (K Tons) Forecast, by Application 2020 & 2033
- Table 55: Russia MEA Lithium Industry Revenue (billion) Forecast, by Application 2020 & 2033
- Table 56: Russia MEA Lithium Industry Volume (K Tons) Forecast, by Application 2020 & 2033
- Table 57: Benelux MEA Lithium Industry Revenue (billion) Forecast, by Application 2020 & 2033
- Table 58: Benelux MEA Lithium Industry Volume (K Tons) Forecast, by Application 2020 & 2033
- Table 59: Nordics MEA Lithium Industry Revenue (billion) Forecast, by Application 2020 & 2033
- Table 60: Nordics MEA Lithium Industry Volume (K Tons) Forecast, by Application 2020 & 2033
- Table 61: Rest of Europe MEA Lithium Industry Revenue (billion) Forecast, by Application 2020 & 2033
- Table 62: Rest of Europe MEA Lithium Industry Volume (K Tons) Forecast, by Application 2020 & 2033
- Table 63: Global MEA Lithium Industry Revenue billion Forecast, by Type 2020 & 2033
- Table 64: Global MEA Lithium Industry Volume K Tons Forecast, by Type 2020 & 2033
- Table 65: Global MEA Lithium Industry Revenue billion Forecast, by Application 2020 & 2033
- Table 66: Global MEA Lithium Industry Volume K Tons Forecast, by Application 2020 & 2033
- Table 67: Global MEA Lithium Industry Revenue billion Forecast, by End-user Industry 2020 & 2033
- Table 68: Global MEA Lithium Industry Volume K Tons Forecast, by End-user Industry 2020 & 2033
- Table 69: Global MEA Lithium Industry Revenue billion Forecast, by Country 2020 & 2033
- Table 70: Global MEA Lithium Industry Volume K Tons Forecast, by Country 2020 & 2033
- Table 71: Turkey MEA Lithium Industry Revenue (billion) Forecast, by Application 2020 & 2033
- Table 72: Turkey MEA Lithium Industry Volume (K Tons) Forecast, by Application 2020 & 2033
- Table 73: Israel MEA Lithium Industry Revenue (billion) Forecast, by Application 2020 & 2033
- Table 74: Israel MEA Lithium Industry Volume (K Tons) Forecast, by Application 2020 & 2033
- Table 75: GCC MEA Lithium Industry Revenue (billion) Forecast, by Application 2020 & 2033
- Table 76: GCC MEA Lithium Industry Volume (K Tons) Forecast, by Application 2020 & 2033
- Table 77: North Africa MEA Lithium Industry Revenue (billion) Forecast, by Application 2020 & 2033
- Table 78: North Africa MEA Lithium Industry Volume (K Tons) Forecast, by Application 2020 & 2033
- Table 79: South Africa MEA Lithium Industry Revenue (billion) Forecast, by Application 2020 & 2033
- Table 80: South Africa MEA Lithium Industry Volume (K Tons) Forecast, by Application 2020 & 2033
- Table 81: Rest of Middle East & Africa MEA Lithium Industry Revenue (billion) Forecast, by Application 2020 & 2033
- Table 82: Rest of Middle East & Africa MEA Lithium Industry Volume (K Tons) Forecast, by Application 2020 & 2033
- Table 83: Global MEA Lithium Industry Revenue billion Forecast, by Type 2020 & 2033
- Table 84: Global MEA Lithium Industry Volume K Tons Forecast, by Type 2020 & 2033
- Table 85: Global MEA Lithium Industry Revenue billion Forecast, by Application 2020 & 2033
- Table 86: Global MEA Lithium Industry Volume K Tons Forecast, by Application 2020 & 2033
- Table 87: Global MEA Lithium Industry Revenue billion Forecast, by End-user Industry 2020 & 2033
- Table 88: Global MEA Lithium Industry Volume K Tons Forecast, by End-user Industry 2020 & 2033
- Table 89: Global MEA Lithium Industry Revenue billion Forecast, by Country 2020 & 2033
- Table 90: Global MEA Lithium Industry Volume K Tons Forecast, by Country 2020 & 2033
- Table 91: China MEA Lithium Industry Revenue (billion) Forecast, by Application 2020 & 2033
- Table 92: China MEA Lithium Industry Volume (K Tons) Forecast, by Application 2020 & 2033
- Table 93: India MEA Lithium Industry Revenue (billion) Forecast, by Application 2020 & 2033
- Table 94: India MEA Lithium Industry Volume (K Tons) Forecast, by Application 2020 & 2033
- Table 95: Japan MEA Lithium Industry Revenue (billion) Forecast, by Application 2020 & 2033
- Table 96: Japan MEA Lithium Industry Volume (K Tons) Forecast, by Application 2020 & 2033
- Table 97: South Korea MEA Lithium Industry Revenue (billion) Forecast, by Application 2020 & 2033
- Table 98: South Korea MEA Lithium Industry Volume (K Tons) Forecast, by Application 2020 & 2033
- Table 99: ASEAN MEA Lithium Industry Revenue (billion) Forecast, by Application 2020 & 2033
- Table 100: ASEAN MEA Lithium Industry Volume (K Tons) Forecast, by Application 2020 & 2033
- Table 101: Oceania MEA Lithium Industry Revenue (billion) Forecast, by Application 2020 & 2033
- Table 102: Oceania MEA Lithium Industry Volume (K Tons) Forecast, by Application 2020 & 2033
- Table 103: Rest of Asia Pacific MEA Lithium Industry Revenue (billion) Forecast, by Application 2020 & 2033
- Table 104: Rest of Asia Pacific MEA Lithium Industry Volume (K Tons) Forecast, by Application 2020 & 2033
Frequently Asked Questions
1. What is the projected Compound Annual Growth Rate (CAGR) of the MEA Lithium Industry?
The projected CAGR is approximately 6.8%.
2. Which companies are prominent players in the MEA Lithium Industry?
Key companies in the market include Lepidico Ltd, Orocobre Limited Pty Ltd, FMC Corporation (Livent Corporation), SQM S A, Albemarle Corporation.
3. What are the main segments of the MEA Lithium Industry?
The market segments include Type, Application, End-user Industry.
4. Can you provide details about the market size?
The market size is estimated to be USD 4.79 billion as of 2022.
5. What are some drivers contributing to market growth?
Accelerating Demand for Electric Vehicles; Growing Usage and Demand from the Portable Consumer Electronics; Other Drivers.
6. What are the notable trends driving market growth?
Growing Demand from Battery Applications.
7. Are there any restraints impacting market growth?
High Dependency on Imports for Consumption; Other Restraints.
8. Can you provide examples of recent developments in the market?
April 2022: SQM SA planned to invest USD 900 million in 2022 to increase lithium carbonate and hydroxide production capacity. The company planned to increase lithium carbonate production capacity to 180,000 metric tons annually. Furthermore, the capacity is likely to reach 210,000 tons by early 2023.
9. What pricing options are available for accessing the report?
Pricing options include single-user, multi-user, and enterprise licenses priced at USD 3,950, USD 4,950, and USD 6,950 respectively.
10. Is the market size provided in terms of value or volume?
The market size is provided in terms of value, measured in billion and volume, measured in K Tons.
11. Are there any specific market keywords associated with the report?
Yes, the market keyword associated with the report is "MEA Lithium Industry," which aids in identifying and referencing the specific market segment covered.
12. How do I determine which pricing option suits my needs best?
The pricing options vary based on user requirements and access needs. Individual users may opt for single-user licenses, while businesses requiring broader access may choose multi-user or enterprise licenses for cost-effective access to the report.
13. Are there any additional resources or data provided in the MEA Lithium Industry report?
While the report offers comprehensive insights, it's advisable to review the specific contents or supplementary materials provided to ascertain if additional resources or data are available.
14. How can I stay updated on further developments or reports in the MEA Lithium Industry?
To stay informed about further developments, trends, and reports in the MEA Lithium Industry, consider subscribing to industry newsletters, following relevant companies and organizations, or regularly checking reputable industry news sources and publications.
Methodology
Step 1 - Identification of Relevant Samples Size from Population Database


Step 2 - Approaches for Defining Global Market Size (Value, Volume* & Price*)

Note*: In applicable scenarios
Step 3 - Data Sources
Primary Research
- Web Analytics
- Survey Reports
- Research Institute
- Latest Research Reports
- Opinion Leaders
Secondary Research
- Annual Reports
- White Paper
- Latest Press Release
- Industry Association
- Paid Database
- Investor Presentations

Step 4 - Data Triangulation
Involves using different sources of information in order to increase the validity of a study
These sources are likely to be stakeholders in a program - participants, other researchers, program staff, other community members, and so on.
Then we put all data in single framework & apply various statistical tools to find out the dynamic on the market.
During the analysis stage, feedback from the stakeholder groups would be compared to determine areas of agreement as well as areas of divergence