

Key Insights
The MEA Flat Glass Market, exhibiting a CAGR exceeding 3.50%, presents significant growth opportunities across diverse end-user industries. Driven by robust infrastructure development, particularly in the construction sector within countries like the UAE and Saudi Arabia, the market is experiencing considerable expansion. The rising adoption of solar energy, fueling demand for solar glass, further contributes to market growth. While the automotive sector remains a key consumer, the construction sector's influence is increasingly dominant, particularly given ongoing mega-projects and urbanization across the region. Growth is also spurred by advancements in glass processing techniques, leading to the production of more durable, energy-efficient, and aesthetically pleasing flat glass products. However, fluctuating raw material prices and potential supply chain disruptions represent key restraints. Segment-wise, annealed glass currently holds the largest market share due to its cost-effectiveness, followed by coated glass, reflective glass, and processed glass, with each catering to specific applications. The competitive landscape involves both established international players and regional manufacturers, leading to a dynamic market environment characterized by product innovation and pricing strategies.
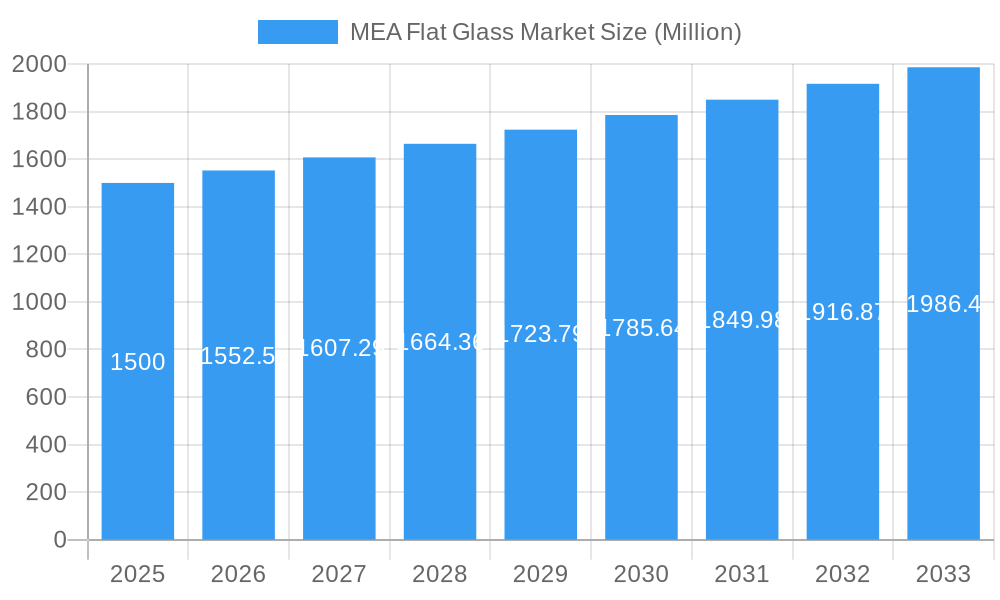
MEA Flat Glass Market Market Size (In Billion)
Looking ahead, the MEA Flat Glass Market's trajectory remains positive, supported by government initiatives promoting sustainable development and infrastructure investments. Increased focus on energy efficiency in buildings and vehicles is bolstering demand for specialized glass products. The market's regional distribution shows considerable variation, with the UAE and Saudi Arabia accounting for a substantial portion of market share due to their higher economic activity and ongoing construction projects. Other countries in the region, including South Africa, are also experiencing growth, although at a slower pace. The market is expected to witness further consolidation as leading players expand their production capacities and distribution networks, driving competition and innovation in the years to come. Continued focus on technological advancements and customized solutions will be crucial for success in this evolving market.
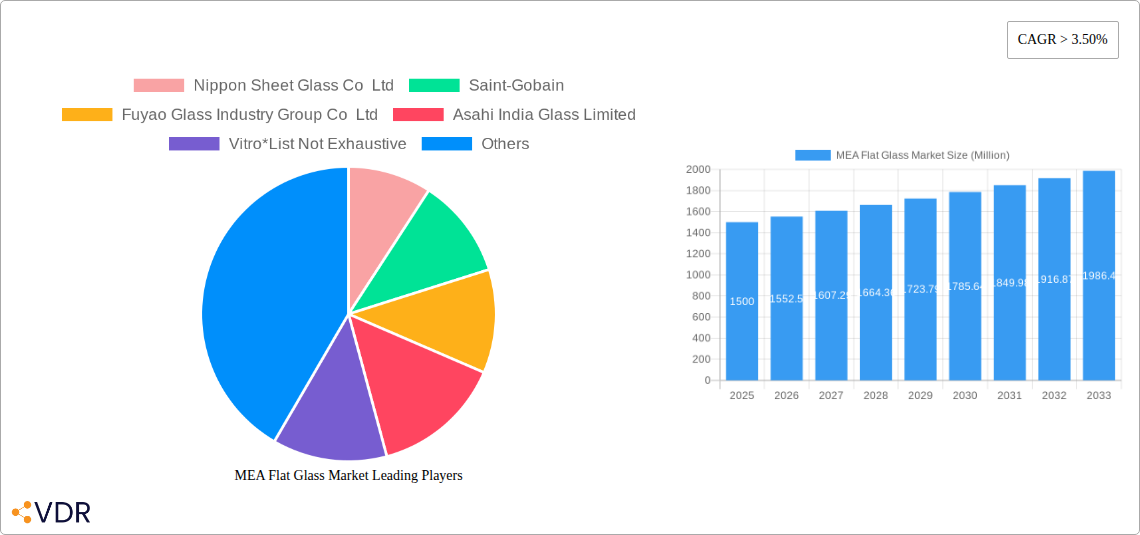
MEA Flat Glass Market Company Market Share
MEA Flat Glass Market: A Comprehensive Market Report (2019-2033)
This in-depth report provides a comprehensive analysis of the Middle East and Africa (MEA) flat glass market, offering invaluable insights for industry professionals, investors, and strategic decision-makers. The report covers the period 2019-2033, with a focus on the forecast period 2025-2033 (Base Year: 2025, Estimated Year: 2025). The analysis encompasses market dynamics, growth trends, dominant segments, product landscapes, key players, and emerging opportunities across the parent market and various child markets, helping you navigate the complexities of this dynamic sector.
MEA Flat Glass Market Market Dynamics & Structure
This section delves into the intricate dynamics shaping the MEA flat glass market. We analyze the competitive landscape, identify key technological advancements, examine the prevailing regulatory environment, and highlight significant market trends. The market is characterized by a moderate level of consolidation, with established global giants such as Nippon Sheet Glass Co Ltd, Saint-Gobain, Fuyao Glass Industry Group Co Ltd, Asahi India Glass Limited, Vitro, GUARDIAN GLASS LLC, Sisecam Group, AGC Inc, SCHOTT AG, and Phoenicia actively participating. Alongside these prominent players, a vibrant ecosystem of smaller, agile regional manufacturers contributes to the market's diversity and responsiveness to local demands.
- Market Concentration: The top five players are projected to hold an estimated XX% market share in 2025, signifying a moderately concentrated market with significant influence wielded by major entities.
- Technological Innovation: Continuous advancements in sophisticated glass processing techniques, including the refinement of float glass production methods and the development of high-performance, energy-efficient coatings, are potent catalysts for market expansion. However, the substantial capital expenditure required for these cutting-edge technologies presents a considerable barrier to entry for nascent or smaller-scale players.
- Regulatory Frameworks: Evolving building codes and increasingly stringent energy efficiency standards are significantly influencing the demand for specific types of flat glass. This is particularly evident in the burgeoning building and construction sector, where compliance with these regulations is paramount.
- Competitive Product Substitutes: While flat glass remains a dominant material, the market faces competitive pressure from alternative materials such as advanced plastics and various composite materials. These substitutes pose a particular threat in cost-sensitive applications where functionality and price are the primary decision-making factors.
- M&A Trends: The past five years have witnessed a notable number of mergers and acquisitions (M&A) in the MEA flat glass market, totaling approximately XX significant deals. These strategic moves are primarily driven by a desire to expand regional footprint, gain access to new markets, and acquire specialized technologies and intellectual property. The significant investments made by industry leaders like Saint-Gobain and Vitro in Egypt, as detailed in the "Notable Milestones" section, underscore the strategic importance of expansion and consolidation within the region.
- End-user Demographics: The accelerating pace of population growth and rapid urbanization across the vast MEA region are fundamental drivers of sustained market growth. This demographic shift, particularly the burgeoning demand for housing, commercial spaces, and infrastructure, directly fuels the expansion of the building and construction segment.
MEA Flat Glass Market Growth Trends & Insights
The MEA flat glass market is projected to witness significant growth over the forecast period, driven by factors such as increasing infrastructure development, rising urbanization, and the expanding automotive and solar energy sectors. The market size is estimated at xx Million units in 2025 and is projected to reach xx Million units by 2033, exhibiting a CAGR of xx%. This growth is further fueled by increasing adoption of energy-efficient glass and the growing demand for advanced glass products in various applications. Technological disruptions, including the development of self-cleaning glass and smart glass, are expected to further boost market growth. Changes in consumer preferences toward aesthetically pleasing and energy-efficient building materials are also contributing factors.
Dominant Regions, Countries, or Segments in MEA Flat Glass Market
The building and construction segment stands as the undisputed leader in the MEA flat glass market, commanding an estimated market share of XX% in 2025. Following closely are the dynamic automotive and the rapidly expanding solar energy segments. Within the product type categorization, annealed glass continues to hold the largest market share, a testament to its inherent cost-effectiveness and versatile applicability across a wide spectrum of uses.
- Building and Construction: Robust growth in this segment is propelled by a confluence of factors, including the execution of ambitious large-scale infrastructure projects and the sustained uptick in construction activity across the entire region. Furthermore, government initiatives actively promoting the adoption of sustainable building practices are significantly bolstering the demand for advanced, energy-efficient glass solutions.
- Automotive: The expanding automotive industry within the MEA region, coupled with the accelerating adoption of advanced driver-assistance systems (ADAS) that require sophisticated glass integration, is directly contributing to the increasing demand for specialized automotive glass.
- Solar: The global and regional imperative to transition towards renewable energy sources, supported by favorable government policies and incentives, is a significant catalyst for the burgeoning demand for solar glass used in photovoltaic panels and concentrated solar power systems.
- Annealed Glass: This foundational product segment continues to thrive due to its inherent cost-effectiveness, making it the preferred choice for a multitude of applications where premium performance characteristics are not the primary requirement.
- Other End-user Industries: Beyond the major segments, the MEA flat glass market also benefits from the diversified demand originating from other significant end-user industries. These include the rapidly growing consumer electronics sector, the appliance manufacturing industry, and the furniture manufacturing sector, all of which incorporate flat glass in various forms.
MEA Flat Glass Market Product Landscape
The MEA flat glass market presents a comprehensive and diverse product portfolio designed to meet a wide array of industry needs. Key offerings include fundamental annealed glass, advanced coated glass varieties such as reflective and Low-E (low-emissivity) coatings, a broad range of processed glass types including laminated and tempered glass, and an extensive selection of mirrors. The industry's innovation thrust is keenly focused on enhancing energy efficiency through sophisticated coatings, elevating aesthetic appeal, and developing specialized functionalities like self-cleaning surfaces and intelligent "smart glass" technologies. These ongoing advancements are directly responsive to the escalating demand for sustainable, high-performance, and value-added glass solutions.
Key Drivers, Barriers & Challenges in MEA Flat Glass Market
Key Drivers: The MEA flat glass market is propelled by a potent combination of robust infrastructure development, accelerating urbanization trends, the burgeoning growth of the automotive and solar energy sectors, and proactive government support for sustainable building practices. Technological advancements in both glass manufacturing processes and advanced glass processing techniques also serve as significant contributors to market expansion.
Key Challenges: Despite the positive growth trajectory, the market grapples with several significant challenges. These include the inherent volatility of raw material prices, intense and often aggressive competition among market players, and the potential for supply chain disruptions that can impact availability and cost. Furthermore, navigating complex regulatory hurdles and the persistent need for a skilled labor force to operate advanced manufacturing facilities also pose obstacles to unhindered market growth. These combined factors could potentially moderate market growth by an estimated XX% within the next five years.
Emerging Opportunities in MEA Flat Glass Market
Emerging opportunities include the expansion of the solar energy sector, the growing demand for energy-efficient buildings, and the increasing popularity of smart glass technologies. Untapped markets in less developed regions of MEA present significant potential for growth.
Growth Accelerators in the MEA Flat Glass Market Industry
Breakthroughs in technological innovation, particularly the development and widespread adoption of advanced energy-efficient coatings and cutting-edge smart glass technologies, are identified as crucial growth accelerators for the MEA flat glass market. Strategic collaborations and partnerships forged between leading glass manufacturers and prominent construction companies are further catalyzing market expansion by ensuring integrated solutions and market access. Additionally, government initiatives actively promoting and incentivizing sustainable building practices play a pivotal role in driving demand for higher-performance and eco-friendly glass products.
Key Players Shaping the MEA Flat Glass Market Market
- Nippon Sheet Glass Co Ltd
- Saint-Gobain
- Fuyao Glass Industry Group Co Ltd
- Asahi India Glass Limited
- Vitro
- GUARDIAN GLASS LLC
- Sisecam Group
- AGC Inc
- SCHOTT AG
- Phoenicia
Notable Milestones in MEA Flat Glass Market Sector
- September 2022: Saint-Gobain announced plans to invest in new flat glass manufacturing plants in Egypt.
- August 2022: Vitro unveiled plans to construct a flat and container glass plant in Egypt, with a USD 400 million investment.
In-Depth MEA Flat Glass Market Market Outlook
The MEA flat glass market is poised for sustained growth, driven by ongoing infrastructure development, urbanization, and the increasing adoption of sustainable building practices. Strategic partnerships, technological innovations, and government support will further propel market expansion, creating lucrative opportunities for both established players and new entrants.
MEA Flat Glass Market Segmentation
-
1. Product Type
- 1.1. Annealed Glass
- 1.2. Coater Glass
- 1.3. Reflective Glass
- 1.4. Processsed Glass
- 1.5. Mirrors
-
2. End-user Industry
- 2.1. Building and Construction
- 2.2. Automotive
- 2.3. Solar
- 2.4. Other End-user Industries
-
3. Geography
- 3.1. Saudi Arabia
- 3.2. United Arab Emirates
- 3.3. Egypt
- 3.4. Nigeria
- 3.5. South Africa
- 3.6. Rest of Middle East and Africa
MEA Flat Glass Market Segmentation By Geography
- 1. Saudi Arabia
- 2. United Arab Emirates
- 3. Egypt
- 4. Nigeria
- 5. South Africa
- 6. Rest of Middle East and Africa
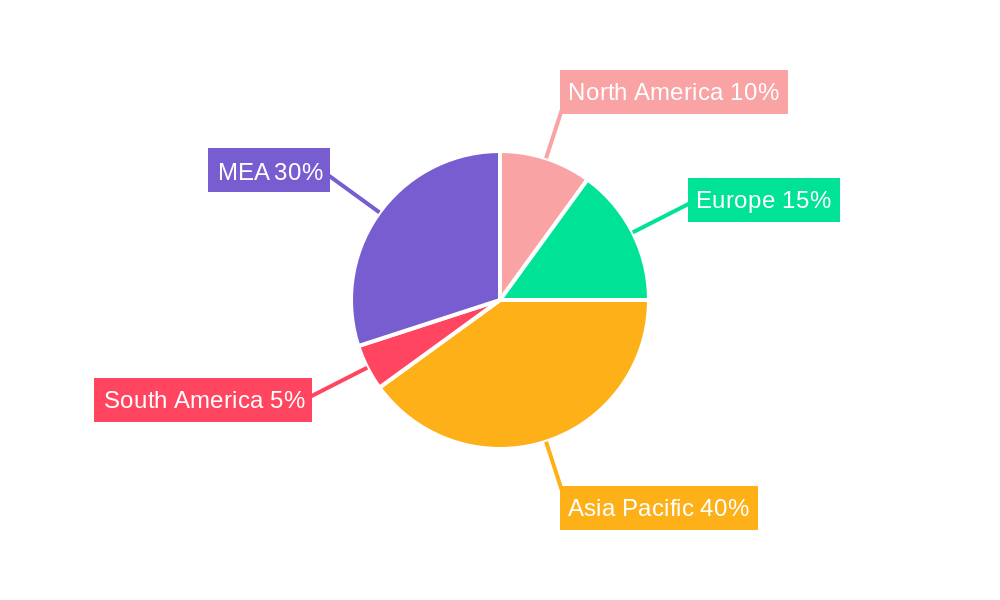
MEA Flat Glass Market Regional Market Share
Geographic Coverage of MEA Flat Glass Market
MEA Flat Glass Market REPORT HIGHLIGHTS
| Aspects | Details |
|---|---|
| Study Period | 2020-2034 |
| Base Year | 2025 |
| Estimated Year | 2026 |
| Forecast Period | 2026-2034 |
| Historical Period | 2020-2025 |
| Growth Rate | CAGR of > 3.50% from 2020-2034 |
| Segmentation |
|
Table of Contents
- 1. Introduction
- 1.1. Research Scope
- 1.2. Market Segmentation
- 1.3. Research Objective
- 1.4. Definitions and Assumptions
- 2. Executive Summary
- 2.1. Market Snapshot
- 3. Market Dynamics
- 3.1. Market Drivers
- 3.2. Market Restrains
- 3.3. Market Trends
- 3.4. Market Opportunities
- 4. Market Factor Analysis
- 4.1. Porters Five Forces
- 4.1.1. Bargaining Power of Suppliers
- 4.1.2. Bargaining Power of Buyers
- 4.1.3. Threat of New Entrants
- 4.1.4. Threat of Substitutes
- 4.1.5. Competitive Rivalry
- 4.2. PESTEL analysis
- 4.3. BCG Analysis
- 4.3.1. Stars (High Growth, High Market Share)
- 4.3.2. Cash Cows (Low Growth, High Market Share)
- 4.3.3. Question Mark (High Growth, Low Market Share)
- 4.3.4. Dogs (Low Growth, Low Market Share)
- 4.4. Ansoff Matrix Analysis
- 4.5. Supply Chain Analysis
- 4.6. Regulatory Landscape
- 4.7. Current Market Potential and Opportunity Assessment (TAM–SAM–SOM Framework)
- 4.8. VDR Analyst Note
- 4.1. Porters Five Forces
- 5. Market Analysis, Insights and Forecast 2021-2033
- 5.1. Market Analysis, Insights and Forecast - by Product Type
- 5.1.1. Annealed Glass
- 5.1.2. Coater Glass
- 5.1.3. Reflective Glass
- 5.1.4. Processsed Glass
- 5.1.5. Mirrors
- 5.2. Market Analysis, Insights and Forecast - by End-user Industry
- 5.2.1. Building and Construction
- 5.2.2. Automotive
- 5.2.3. Solar
- 5.2.4. Other End-user Industries
- 5.3. Market Analysis, Insights and Forecast - by Geography
- 5.3.1. Saudi Arabia
- 5.3.2. United Arab Emirates
- 5.3.3. Egypt
- 5.3.4. Nigeria
- 5.3.5. South Africa
- 5.3.6. Rest of Middle East and Africa
- 5.4. Market Analysis, Insights and Forecast - by Region
- 5.4.1. Saudi Arabia
- 5.4.2. United Arab Emirates
- 5.4.3. Egypt
- 5.4.4. Nigeria
- 5.4.5. South Africa
- 5.4.6. Rest of Middle East and Africa
- 5.1. Market Analysis, Insights and Forecast - by Product Type
- 6. Global MEA Flat Glass Market Analysis, Insights and Forecast, 2021-2033
- 6.1. Market Analysis, Insights and Forecast - by Product Type
- 6.1.1. Annealed Glass
- 6.1.2. Coater Glass
- 6.1.3. Reflective Glass
- 6.1.4. Processsed Glass
- 6.1.5. Mirrors
- 6.2. Market Analysis, Insights and Forecast - by End-user Industry
- 6.2.1. Building and Construction
- 6.2.2. Automotive
- 6.2.3. Solar
- 6.2.4. Other End-user Industries
- 6.3. Market Analysis, Insights and Forecast - by Geography
- 6.3.1. Saudi Arabia
- 6.3.2. United Arab Emirates
- 6.3.3. Egypt
- 6.3.4. Nigeria
- 6.3.5. South Africa
- 6.3.6. Rest of Middle East and Africa
- 6.1. Market Analysis, Insights and Forecast - by Product Type
- 7. Saudi Arabia MEA Flat Glass Market Analysis, Insights and Forecast, 2021-2033
- 7.1. Market Analysis, Insights and Forecast - by Product Type
- 7.1.1. Annealed Glass
- 7.1.2. Coater Glass
- 7.1.3. Reflective Glass
- 7.1.4. Processsed Glass
- 7.1.5. Mirrors
- 7.2. Market Analysis, Insights and Forecast - by End-user Industry
- 7.2.1. Building and Construction
- 7.2.2. Automotive
- 7.2.3. Solar
- 7.2.4. Other End-user Industries
- 7.3. Market Analysis, Insights and Forecast - by Geography
- 7.3.1. Saudi Arabia
- 7.3.2. United Arab Emirates
- 7.3.3. Egypt
- 7.3.4. Nigeria
- 7.3.5. South Africa
- 7.3.6. Rest of Middle East and Africa
- 7.1. Market Analysis, Insights and Forecast - by Product Type
- 8. United Arab Emirates MEA Flat Glass Market Analysis, Insights and Forecast, 2021-2033
- 8.1. Market Analysis, Insights and Forecast - by Product Type
- 8.1.1. Annealed Glass
- 8.1.2. Coater Glass
- 8.1.3. Reflective Glass
- 8.1.4. Processsed Glass
- 8.1.5. Mirrors
- 8.2. Market Analysis, Insights and Forecast - by End-user Industry
- 8.2.1. Building and Construction
- 8.2.2. Automotive
- 8.2.3. Solar
- 8.2.4. Other End-user Industries
- 8.3. Market Analysis, Insights and Forecast - by Geography
- 8.3.1. Saudi Arabia
- 8.3.2. United Arab Emirates
- 8.3.3. Egypt
- 8.3.4. Nigeria
- 8.3.5. South Africa
- 8.3.6. Rest of Middle East and Africa
- 8.1. Market Analysis, Insights and Forecast - by Product Type
- 9. Egypt MEA Flat Glass Market Analysis, Insights and Forecast, 2021-2033
- 9.1. Market Analysis, Insights and Forecast - by Product Type
- 9.1.1. Annealed Glass
- 9.1.2. Coater Glass
- 9.1.3. Reflective Glass
- 9.1.4. Processsed Glass
- 9.1.5. Mirrors
- 9.2. Market Analysis, Insights and Forecast - by End-user Industry
- 9.2.1. Building and Construction
- 9.2.2. Automotive
- 9.2.3. Solar
- 9.2.4. Other End-user Industries
- 9.3. Market Analysis, Insights and Forecast - by Geography
- 9.3.1. Saudi Arabia
- 9.3.2. United Arab Emirates
- 9.3.3. Egypt
- 9.3.4. Nigeria
- 9.3.5. South Africa
- 9.3.6. Rest of Middle East and Africa
- 9.1. Market Analysis, Insights and Forecast - by Product Type
- 10. Nigeria MEA Flat Glass Market Analysis, Insights and Forecast, 2021-2033
- 10.1. Market Analysis, Insights and Forecast - by Product Type
- 10.1.1. Annealed Glass
- 10.1.2. Coater Glass
- 10.1.3. Reflective Glass
- 10.1.4. Processsed Glass
- 10.1.5. Mirrors
- 10.2. Market Analysis, Insights and Forecast - by End-user Industry
- 10.2.1. Building and Construction
- 10.2.2. Automotive
- 10.2.3. Solar
- 10.2.4. Other End-user Industries
- 10.3. Market Analysis, Insights and Forecast - by Geography
- 10.3.1. Saudi Arabia
- 10.3.2. United Arab Emirates
- 10.3.3. Egypt
- 10.3.4. Nigeria
- 10.3.5. South Africa
- 10.3.6. Rest of Middle East and Africa
- 10.1. Market Analysis, Insights and Forecast - by Product Type
- 11. South Africa MEA Flat Glass Market Analysis, Insights and Forecast, 2021-2033
- 11.1. Market Analysis, Insights and Forecast - by Product Type
- 11.1.1. Annealed Glass
- 11.1.2. Coater Glass
- 11.1.3. Reflective Glass
- 11.1.4. Processsed Glass
- 11.1.5. Mirrors
- 11.2. Market Analysis, Insights and Forecast - by End-user Industry
- 11.2.1. Building and Construction
- 11.2.2. Automotive
- 11.2.3. Solar
- 11.2.4. Other End-user Industries
- 11.3. Market Analysis, Insights and Forecast - by Geography
- 11.3.1. Saudi Arabia
- 11.3.2. United Arab Emirates
- 11.3.3. Egypt
- 11.3.4. Nigeria
- 11.3.5. South Africa
- 11.3.6. Rest of Middle East and Africa
- 11.1. Market Analysis, Insights and Forecast - by Product Type
- 12. Rest of Middle East and Africa MEA Flat Glass Market Analysis, Insights and Forecast, 2021-2033
- 12.1. Market Analysis, Insights and Forecast - by Product Type
- 12.1.1. Annealed Glass
- 12.1.2. Coater Glass
- 12.1.3. Reflective Glass
- 12.1.4. Processsed Glass
- 12.1.5. Mirrors
- 12.2. Market Analysis, Insights and Forecast - by End-user Industry
- 12.2.1. Building and Construction
- 12.2.2. Automotive
- 12.2.3. Solar
- 12.2.4. Other End-user Industries
- 12.3. Market Analysis, Insights and Forecast - by Geography
- 12.3.1. Saudi Arabia
- 12.3.2. United Arab Emirates
- 12.3.3. Egypt
- 12.3.4. Nigeria
- 12.3.5. South Africa
- 12.3.6. Rest of Middle East and Africa
- 12.1. Market Analysis, Insights and Forecast - by Product Type
- 13. Competitive Analysis
- 13.1. Company Profiles
- 13.1.1 Nippon Sheet Glass Co Ltd
- 13.1.1.1. Company Overview
- 13.1.1.2. Products
- 13.1.1.3. Company Financials
- 13.1.1.4. SWOT Analysis
- 13.1.2 Saint-Gobain
- 13.1.2.1. Company Overview
- 13.1.2.2. Products
- 13.1.2.3. Company Financials
- 13.1.2.4. SWOT Analysis
- 13.1.3 Fuyao Glass Industry Group Co Ltd
- 13.1.3.1. Company Overview
- 13.1.3.2. Products
- 13.1.3.3. Company Financials
- 13.1.3.4. SWOT Analysis
- 13.1.4 Asahi India Glass Limited
- 13.1.4.1. Company Overview
- 13.1.4.2. Products
- 13.1.4.3. Company Financials
- 13.1.4.4. SWOT Analysis
- 13.1.5 Vitro*List Not Exhaustive
- 13.1.5.1. Company Overview
- 13.1.5.2. Products
- 13.1.5.3. Company Financials
- 13.1.5.4. SWOT Analysis
- 13.1.6 GUARDIAN GLASS LLC
- 13.1.6.1. Company Overview
- 13.1.6.2. Products
- 13.1.6.3. Company Financials
- 13.1.6.4. SWOT Analysis
- 13.1.7 Sisecam Group
- 13.1.7.1. Company Overview
- 13.1.7.2. Products
- 13.1.7.3. Company Financials
- 13.1.7.4. SWOT Analysis
- 13.1.8 AGC Inc
- 13.1.8.1. Company Overview
- 13.1.8.2. Products
- 13.1.8.3. Company Financials
- 13.1.8.4. SWOT Analysis
- 13.1.9 SCHOTT AG
- 13.1.9.1. Company Overview
- 13.1.9.2. Products
- 13.1.9.3. Company Financials
- 13.1.9.4. SWOT Analysis
- 13.1.10 Phoenicia
- 13.1.10.1. Company Overview
- 13.1.10.2. Products
- 13.1.10.3. Company Financials
- 13.1.10.4. SWOT Analysis
- 13.1.1 Nippon Sheet Glass Co Ltd
- 13.2. Market Entropy
- 13.2.1 Company's Key Areas Served
- 13.2.2 Recent Developments
- 13.3. Company Market Share Analysis 2025
- 13.3.1 Top 5 Companies Market Share Analysis
- 13.3.2 Top 3 Companies Market Share Analysis
- 13.4. List of Potential Customers
- 14. Research Methodology
List of Figures
- Figure 1: Global MEA Flat Glass Market Revenue Breakdown (Million, %) by Region 2025 & 2033
- Figure 2: Saudi Arabia MEA Flat Glass Market Revenue (Million), by Product Type 2025 & 2033
- Figure 3: Saudi Arabia MEA Flat Glass Market Revenue Share (%), by Product Type 2025 & 2033
- Figure 4: Saudi Arabia MEA Flat Glass Market Revenue (Million), by End-user Industry 2025 & 2033
- Figure 5: Saudi Arabia MEA Flat Glass Market Revenue Share (%), by End-user Industry 2025 & 2033
- Figure 6: Saudi Arabia MEA Flat Glass Market Revenue (Million), by Geography 2025 & 2033
- Figure 7: Saudi Arabia MEA Flat Glass Market Revenue Share (%), by Geography 2025 & 2033
- Figure 8: Saudi Arabia MEA Flat Glass Market Revenue (Million), by Country 2025 & 2033
- Figure 9: Saudi Arabia MEA Flat Glass Market Revenue Share (%), by Country 2025 & 2033
- Figure 10: United Arab Emirates MEA Flat Glass Market Revenue (Million), by Product Type 2025 & 2033
- Figure 11: United Arab Emirates MEA Flat Glass Market Revenue Share (%), by Product Type 2025 & 2033
- Figure 12: United Arab Emirates MEA Flat Glass Market Revenue (Million), by End-user Industry 2025 & 2033
- Figure 13: United Arab Emirates MEA Flat Glass Market Revenue Share (%), by End-user Industry 2025 & 2033
- Figure 14: United Arab Emirates MEA Flat Glass Market Revenue (Million), by Geography 2025 & 2033
- Figure 15: United Arab Emirates MEA Flat Glass Market Revenue Share (%), by Geography 2025 & 2033
- Figure 16: United Arab Emirates MEA Flat Glass Market Revenue (Million), by Country 2025 & 2033
- Figure 17: United Arab Emirates MEA Flat Glass Market Revenue Share (%), by Country 2025 & 2033
- Figure 18: Egypt MEA Flat Glass Market Revenue (Million), by Product Type 2025 & 2033
- Figure 19: Egypt MEA Flat Glass Market Revenue Share (%), by Product Type 2025 & 2033
- Figure 20: Egypt MEA Flat Glass Market Revenue (Million), by End-user Industry 2025 & 2033
- Figure 21: Egypt MEA Flat Glass Market Revenue Share (%), by End-user Industry 2025 & 2033
- Figure 22: Egypt MEA Flat Glass Market Revenue (Million), by Geography 2025 & 2033
- Figure 23: Egypt MEA Flat Glass Market Revenue Share (%), by Geography 2025 & 2033
- Figure 24: Egypt MEA Flat Glass Market Revenue (Million), by Country 2025 & 2033
- Figure 25: Egypt MEA Flat Glass Market Revenue Share (%), by Country 2025 & 2033
- Figure 26: Nigeria MEA Flat Glass Market Revenue (Million), by Product Type 2025 & 2033
- Figure 27: Nigeria MEA Flat Glass Market Revenue Share (%), by Product Type 2025 & 2033
- Figure 28: Nigeria MEA Flat Glass Market Revenue (Million), by End-user Industry 2025 & 2033
- Figure 29: Nigeria MEA Flat Glass Market Revenue Share (%), by End-user Industry 2025 & 2033
- Figure 30: Nigeria MEA Flat Glass Market Revenue (Million), by Geography 2025 & 2033
- Figure 31: Nigeria MEA Flat Glass Market Revenue Share (%), by Geography 2025 & 2033
- Figure 32: Nigeria MEA Flat Glass Market Revenue (Million), by Country 2025 & 2033
- Figure 33: Nigeria MEA Flat Glass Market Revenue Share (%), by Country 2025 & 2033
- Figure 34: South Africa MEA Flat Glass Market Revenue (Million), by Product Type 2025 & 2033
- Figure 35: South Africa MEA Flat Glass Market Revenue Share (%), by Product Type 2025 & 2033
- Figure 36: South Africa MEA Flat Glass Market Revenue (Million), by End-user Industry 2025 & 2033
- Figure 37: South Africa MEA Flat Glass Market Revenue Share (%), by End-user Industry 2025 & 2033
- Figure 38: South Africa MEA Flat Glass Market Revenue (Million), by Geography 2025 & 2033
- Figure 39: South Africa MEA Flat Glass Market Revenue Share (%), by Geography 2025 & 2033
- Figure 40: South Africa MEA Flat Glass Market Revenue (Million), by Country 2025 & 2033
- Figure 41: South Africa MEA Flat Glass Market Revenue Share (%), by Country 2025 & 2033
- Figure 42: Rest of Middle East and Africa MEA Flat Glass Market Revenue (Million), by Product Type 2025 & 2033
- Figure 43: Rest of Middle East and Africa MEA Flat Glass Market Revenue Share (%), by Product Type 2025 & 2033
- Figure 44: Rest of Middle East and Africa MEA Flat Glass Market Revenue (Million), by End-user Industry 2025 & 2033
- Figure 45: Rest of Middle East and Africa MEA Flat Glass Market Revenue Share (%), by End-user Industry 2025 & 2033
- Figure 46: Rest of Middle East and Africa MEA Flat Glass Market Revenue (Million), by Geography 2025 & 2033
- Figure 47: Rest of Middle East and Africa MEA Flat Glass Market Revenue Share (%), by Geography 2025 & 2033
- Figure 48: Rest of Middle East and Africa MEA Flat Glass Market Revenue (Million), by Country 2025 & 2033
- Figure 49: Rest of Middle East and Africa MEA Flat Glass Market Revenue Share (%), by Country 2025 & 2033
List of Tables
- Table 1: Global MEA Flat Glass Market Revenue Million Forecast, by Product Type 2020 & 2033
- Table 2: Global MEA Flat Glass Market Revenue Million Forecast, by End-user Industry 2020 & 2033
- Table 3: Global MEA Flat Glass Market Revenue Million Forecast, by Geography 2020 & 2033
- Table 4: Global MEA Flat Glass Market Revenue Million Forecast, by Region 2020 & 2033
- Table 5: Global MEA Flat Glass Market Revenue Million Forecast, by Product Type 2020 & 2033
- Table 6: Global MEA Flat Glass Market Revenue Million Forecast, by End-user Industry 2020 & 2033
- Table 7: Global MEA Flat Glass Market Revenue Million Forecast, by Geography 2020 & 2033
- Table 8: Global MEA Flat Glass Market Revenue Million Forecast, by Country 2020 & 2033
- Table 9: Global MEA Flat Glass Market Revenue Million Forecast, by Product Type 2020 & 2033
- Table 10: Global MEA Flat Glass Market Revenue Million Forecast, by End-user Industry 2020 & 2033
- Table 11: Global MEA Flat Glass Market Revenue Million Forecast, by Geography 2020 & 2033
- Table 12: Global MEA Flat Glass Market Revenue Million Forecast, by Country 2020 & 2033
- Table 13: Global MEA Flat Glass Market Revenue Million Forecast, by Product Type 2020 & 2033
- Table 14: Global MEA Flat Glass Market Revenue Million Forecast, by End-user Industry 2020 & 2033
- Table 15: Global MEA Flat Glass Market Revenue Million Forecast, by Geography 2020 & 2033
- Table 16: Global MEA Flat Glass Market Revenue Million Forecast, by Country 2020 & 2033
- Table 17: Global MEA Flat Glass Market Revenue Million Forecast, by Product Type 2020 & 2033
- Table 18: Global MEA Flat Glass Market Revenue Million Forecast, by End-user Industry 2020 & 2033
- Table 19: Global MEA Flat Glass Market Revenue Million Forecast, by Geography 2020 & 2033
- Table 20: Global MEA Flat Glass Market Revenue Million Forecast, by Country 2020 & 2033
- Table 21: Global MEA Flat Glass Market Revenue Million Forecast, by Product Type 2020 & 2033
- Table 22: Global MEA Flat Glass Market Revenue Million Forecast, by End-user Industry 2020 & 2033
- Table 23: Global MEA Flat Glass Market Revenue Million Forecast, by Geography 2020 & 2033
- Table 24: Global MEA Flat Glass Market Revenue Million Forecast, by Country 2020 & 2033
- Table 25: Global MEA Flat Glass Market Revenue Million Forecast, by Product Type 2020 & 2033
- Table 26: Global MEA Flat Glass Market Revenue Million Forecast, by End-user Industry 2020 & 2033
- Table 27: Global MEA Flat Glass Market Revenue Million Forecast, by Geography 2020 & 2033
- Table 28: Global MEA Flat Glass Market Revenue Million Forecast, by Country 2020 & 2033
Frequently Asked Questions
1. What is the projected Compound Annual Growth Rate (CAGR) of the MEA Flat Glass Market?
The projected CAGR is approximately > 3.50%.
2. Which companies are prominent players in the MEA Flat Glass Market?
Key companies in the market include Nippon Sheet Glass Co Ltd, Saint-Gobain, Fuyao Glass Industry Group Co Ltd, Asahi India Glass Limited, Vitro*List Not Exhaustive, GUARDIAN GLASS LLC, Sisecam Group, AGC Inc, SCHOTT AG, Phoenicia.
3. What are the main segments of the MEA Flat Glass Market?
The market segments include Product Type, End-user Industry, Geography.
4. Can you provide details about the market size?
The market size is estimated to be USD XX Million as of 2022.
5. What are some drivers contributing to market growth?
Growing Demand for Electronic Displays; Increasing Demand from the Construction Industry.
6. What are the notable trends driving market growth?
Increasing Usage in the Construction Industry.
7. Are there any restraints impacting market growth?
Fluctuating Raw Material Prices.
8. Can you provide examples of recent developments in the market?
In September 2022, Saint-Gobain announced to invest in new production facilities in Egypt. Investments will be made in manufacturing plants for flat glass. The multinational company plans to build two new manufacturing plants for flat glass, gypsum, and sustainable building materials over the next three years.
9. What pricing options are available for accessing the report?
Pricing options include single-user, multi-user, and enterprise licenses priced at USD 4750, USD 5250, and USD 8750 respectively.
10. Is the market size provided in terms of value or volume?
The market size is provided in terms of value, measured in Million.
11. Are there any specific market keywords associated with the report?
Yes, the market keyword associated with the report is "MEA Flat Glass Market," which aids in identifying and referencing the specific market segment covered.
12. How do I determine which pricing option suits my needs best?
The pricing options vary based on user requirements and access needs. Individual users may opt for single-user licenses, while businesses requiring broader access may choose multi-user or enterprise licenses for cost-effective access to the report.
13. Are there any additional resources or data provided in the MEA Flat Glass Market report?
While the report offers comprehensive insights, it's advisable to review the specific contents or supplementary materials provided to ascertain if additional resources or data are available.
14. How can I stay updated on further developments or reports in the MEA Flat Glass Market?
To stay informed about further developments, trends, and reports in the MEA Flat Glass Market, consider subscribing to industry newsletters, following relevant companies and organizations, or regularly checking reputable industry news sources and publications.
Methodology
Step 1 - Identification of Relevant Samples Size from Population Database


Step 2 - Approaches for Defining Global Market Size (Value, Volume* & Price*)

Note*: In applicable scenarios
Step 3 - Data Sources
Primary Research
- Web Analytics
- Survey Reports
- Research Institute
- Latest Research Reports
- Opinion Leaders
Secondary Research
- Annual Reports
- White Paper
- Latest Press Release
- Industry Association
- Paid Database
- Investor Presentations

Step 4 - Data Triangulation
Involves using different sources of information in order to increase the validity of a study
These sources are likely to be stakeholders in a program - participants, other researchers, program staff, other community members, and so on.
Then we put all data in single framework & apply various statistical tools to find out the dynamic on the market.
During the analysis stage, feedback from the stakeholder groups would be compared to determine areas of agreement as well as areas of divergence