

Key Insights
The Middle East & Africa (MEA) Engineering Plastics market, a burgeoning sector with substantial growth potential, is projected to reach $165.4 billion by 2025, exhibiting a Compound Annual Growth Rate (CAGR) of 8.1%. This expansion is primarily propelled by vigorous infrastructure development across key economies like Saudi Arabia and the UAE, alongside the robust growth of the automotive and construction industries. The increasing demand for lightweight, high-performance materials in vehicles and buildings, aligned with global sustainability and efficiency mandates, is a significant growth driver. Primary applications span automotive components (interior and exterior parts), construction materials (pipes and fittings), and electrical and electronic components. The presence of major global players, including SABIC and other international chemical leaders, underscores the region's appeal for foreign investment. While fluctuations in oil prices impacting raw material costs and potential supply chain disruptions present challenges, the long-term outlook for the MEA Engineering Plastics market remains highly positive, with sustained growth anticipated through the forecast period.
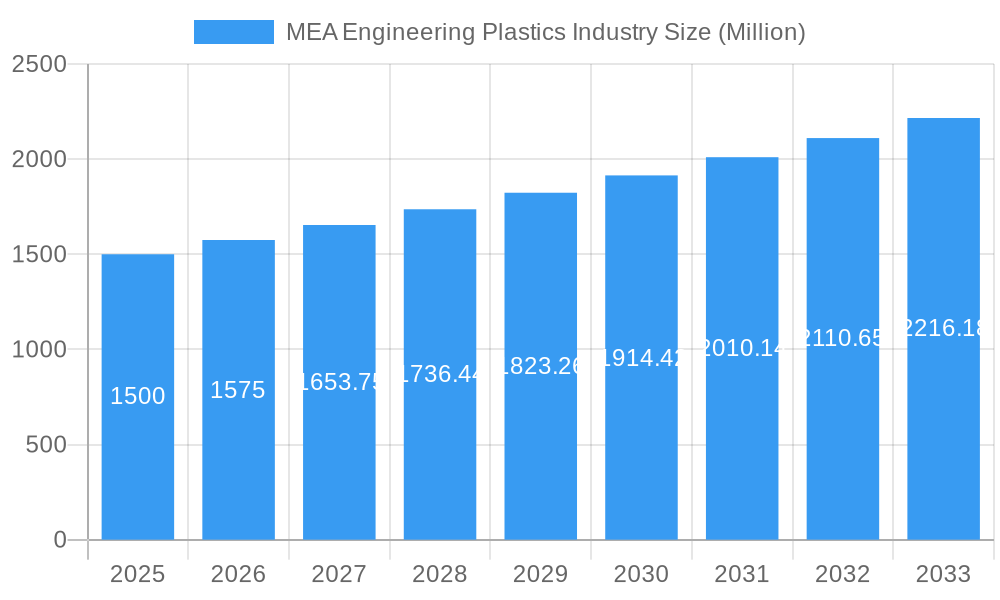
MEA Engineering Plastics Industry Market Size (In Billion)
Growth is expected to be particularly pronounced in the automotive and construction segments, driven by ongoing infrastructure initiatives and rising vehicle production. The adoption of advanced materials, such as high-performance polymers like PEEK and LCP, in specialized applications will further accelerate market expansion. Although engineering plastics penetration in certain segments may currently trail more mature markets, the region's significant economic growth and industrialization present a vast opportunity for increased consumption. Strategic collaborations between international entities and local enterprises will be instrumental in market penetration and technology transfer. Competitive pricing and localized manufacturing capabilities will be key determinants of success in this dynamic market.
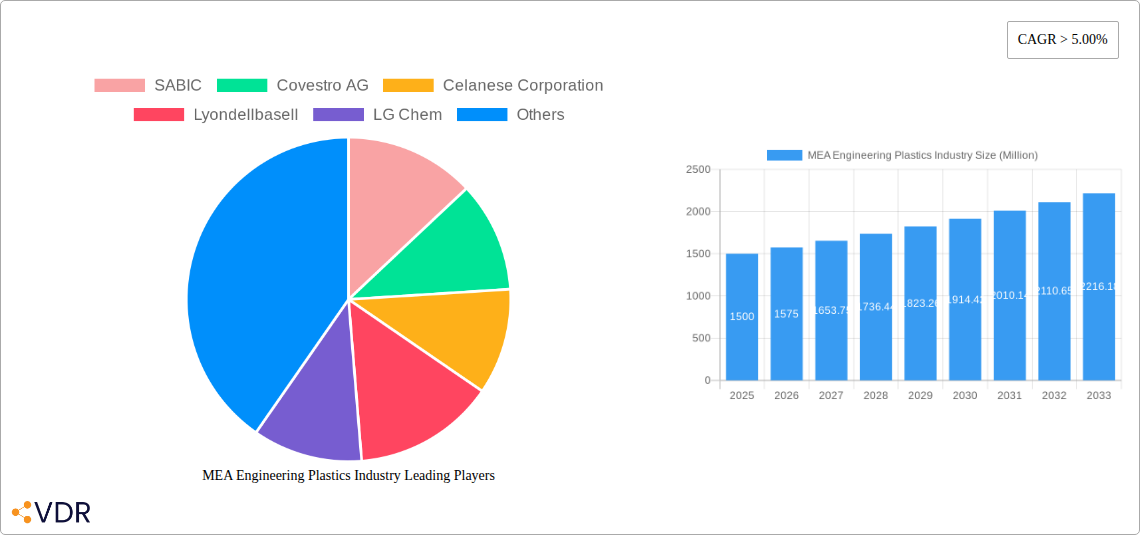
MEA Engineering Plastics Industry Company Market Share
MEA Engineering Plastics Industry Market Report: 2019-2033
This comprehensive report provides an in-depth analysis of the Middle East and Africa (MEA) engineering plastics industry, offering valuable insights for industry professionals, investors, and strategic decision-makers. The report covers the period 2019-2033, with a focus on the forecast period 2025-2033 and a base year of 2025. The analysis incorporates detailed market sizing, segmentation by product type and application, competitive landscape analysis, and future growth projections. Key players like SABIC, Covestro AG, Celanese Corporation, and others are profiled, providing a complete understanding of this dynamic market.
Market Size: The MEA engineering plastics market is estimated at xx Million units in 2025 and is projected to reach xx Million units by 2033.
MEA Engineering Plastics Industry Market Dynamics & Structure
The MEA engineering plastics market is characterized by moderate concentration, with several multinational corporations holding significant market share. Technological innovation, driven by the demand for lighter, stronger, and more durable materials across diverse applications, is a key growth driver. Stringent regulatory frameworks concerning material safety and environmental impact influence market dynamics. Competitive pressures from alternative materials like metal and wood are present, especially in price-sensitive segments. The end-user demographics are diverse, encompassing automotive, construction, electronics, and packaging industries. M&A activity has been relatively low in recent years, but strategic partnerships and joint ventures are increasingly common.
- Market Concentration: Moderately concentrated, with top 5 players holding approximately xx% market share in 2025.
- Technological Innovation: Focus on high-performance materials, lightweighting, and sustainable solutions.
- Regulatory Landscape: Stringent regulations on material safety and environmental impact.
- Competitive Substitutes: Metal, wood, and other composites pose competition in certain applications.
- End-User Demographics: Diverse, with automotive, construction, electronics, and packaging as major segments.
- M&A Activity: Relatively low, but strategic partnerships are on the rise.
MEA Engineering Plastics Industry Growth Trends & Insights
The MEA engineering plastics market exhibits robust growth, driven by the region's expanding industrial sector and rising consumer demand. The automotive and construction industries are major contributors to growth, fueled by infrastructure development and increasing vehicle production. Technological advancements, such as the development of high-performance polymers and advanced manufacturing techniques, are accelerating adoption rates. Consumer preference shifts toward lightweight and durable products further boost market demand. The market is expected to experience a Compound Annual Growth Rate (CAGR) of xx% during the forecast period (2025-2033). Market penetration of engineering plastics in various applications is also increasing steadily. The shift towards sustainable and recyclable materials is also creating new opportunities for growth.
Dominant Regions, Countries, or Segments in MEA Engineering Plastics Industry
The GCC region (Gulf Cooperation Council) currently dominates the MEA engineering plastics market, driven by robust economic growth and significant investments in infrastructure projects. Within the GCC, Saudi Arabia and the UAE are the leading countries. The automotive and construction sectors are the most prominent application segments, benefiting from favorable government policies and substantial investments. Among product types, Polypropylene (PP) and Polyethylene (PE) currently hold the largest market share due to their versatility and cost-effectiveness. However, the demand for high-performance materials like Polycarbonate (PC) and Polyetheretherketone (PEEK) is growing rapidly in niche applications like electronics and aerospace.
- Key Drivers:
- Robust economic growth in the GCC region.
- Significant investments in infrastructure projects.
- Growing automotive and construction sectors.
- Favorable government policies promoting industrial development.
- Dominant Regions: GCC countries (Saudi Arabia, UAE, etc.)
- Dominant Segments: Automotive and construction applications; PP and PE product types.
MEA Engineering Plastics Industry Product Landscape
The MEA engineering plastics market offers a diverse range of products, including high-performance polymers such as PEEK and LCP, and commodity plastics like PP and PE. Product innovation focuses on enhanced mechanical properties, improved thermal stability, and sustainable features. Technological advancements such as additive manufacturing (3D printing) are expanding application possibilities. The unique selling propositions of specific materials are centered on tailored properties matching diverse end-use requirements. Innovations include self-lubricating plastics and bio-based polymers.
Key Drivers, Barriers & Challenges in MEA Engineering Plastics Industry
Key Drivers:
- Growing industrialization and infrastructure development across the MEA region.
- Increasing demand for lightweight and high-performance materials in automotive and aerospace applications.
- Government support for the development of advanced manufacturing technologies.
- Rising consumer disposable incomes driving demand for durable goods.
Challenges & Restraints:
- Fluctuations in raw material prices impacting profitability.
- Supply chain disruptions due to geopolitical uncertainties.
- Stringent environmental regulations requiring compliance with sustainability standards.
- Intense competition from both local and international players.
Emerging Opportunities in MEA Engineering Plastics Industry
- Untapped markets: Growing demand for engineering plastics in emerging sectors such as renewable energy and medical devices presents substantial opportunities.
- Innovative applications: The adoption of advanced technologies like 3D printing creates new applications for customized and highly specialized engineering plastics.
- Evolving consumer preferences: The increasing preference for sustainable and recyclable materials opens avenues for bio-based and recycled engineering plastics.
Growth Accelerators in the MEA Engineering Plastics Industry
Technological advancements, such as the development of novel polymer chemistries and enhanced manufacturing processes, are key growth accelerators. Strategic partnerships and joint ventures between multinational corporations and local players facilitate knowledge transfer and market expansion. Government initiatives supporting innovation and investment in the plastics industry further boost growth. The expansion of downstream industries creates a ripple effect, increasing demand for engineering plastics across various sectors.
Key Players Shaping the MEA Engineering Plastics Industry Market
- SABIC
- Covestro AG
- Celanese Corporation
- LyondellBasell
- LG Chem
- DuPont
- Solvay
- Evonik Industries AG
- Eastman Chemical Company
- 3M
- Chemtura Corporation
- Chevron Phillips Chemical
- Arkema SA
- LANXESS
- Nova Chemicals Corporation
- Ashland Inc
- PolyOne Corporation
- BASF SE
Notable Milestones in MEA Engineering Plastics Industry Sector
- 2022-Q4: SABIC launched a new range of sustainable engineering plastics.
- 2021-Q3: Covestro AG partnered with a local company to expand its manufacturing capacity in the UAE.
- 2020-Q1: A significant infrastructure project in Saudi Arabia led to increased demand for engineering plastics. (Further milestones require specific data)
In-Depth MEA Engineering Plastics Industry Market Outlook
The MEA engineering plastics market is poised for sustained growth driven by economic expansion, infrastructure development, and technological advancements. The focus on sustainable and high-performance materials will shape the industry landscape in the coming years. Strategic partnerships, capacity expansion, and the adoption of innovative technologies will be pivotal factors driving market expansion and creating new opportunities. The report suggests exploring untapped markets and focusing on innovative applications for long-term success in this dynamic industry.
MEA Engineering Plastics Industry Segmentation
-
1. Product Type
- 1.1. Fluoropolymers
- 1.2. Polycarbonate (PC)
- 1.3. Polyethylene Terephthalate (PET)
- 1.4. Polybutylene Terephthalate (PBT)
- 1.5. Polyacetal/ Polyoxymethylene
- 1.6. Polymethyl Methacrylate (PMMA)
- 1.7. Polyphenylene Oxide
- 1.8. Polyphenylene Sulfide (PPS)
- 1.9. Styrene Copolymers (ABS & SAN)
- 1.10. Liquid Crystal Polymers (LCP)
- 1.11. Polyether Ether Ketone (PEEK)
- 1.12. Polyimides (PI)
- 1.13. Polyamides
-
2. Application
- 2.1. Automotive and Transportation
- 2.2. Building and Construction
- 2.3. Consumer Goods
- 2.4. Electrical and Electronics
- 2.5. Industrial and Machinery
- 2.6. Packaging
- 2.7. Medical
-
3. Geography
- 3.1. Saudi Arabia
- 3.2. South Africa
- 3.3. Qatar
- 3.4. United Arab Emirates
- 3.5. Rest of Middle-East and Africa
MEA Engineering Plastics Industry Segmentation By Geography
- 1. Saudi Arabia
- 2. South Africa
- 3. Qatar
- 4. United Arab Emirates
- 5. Rest of Middle East and Africa
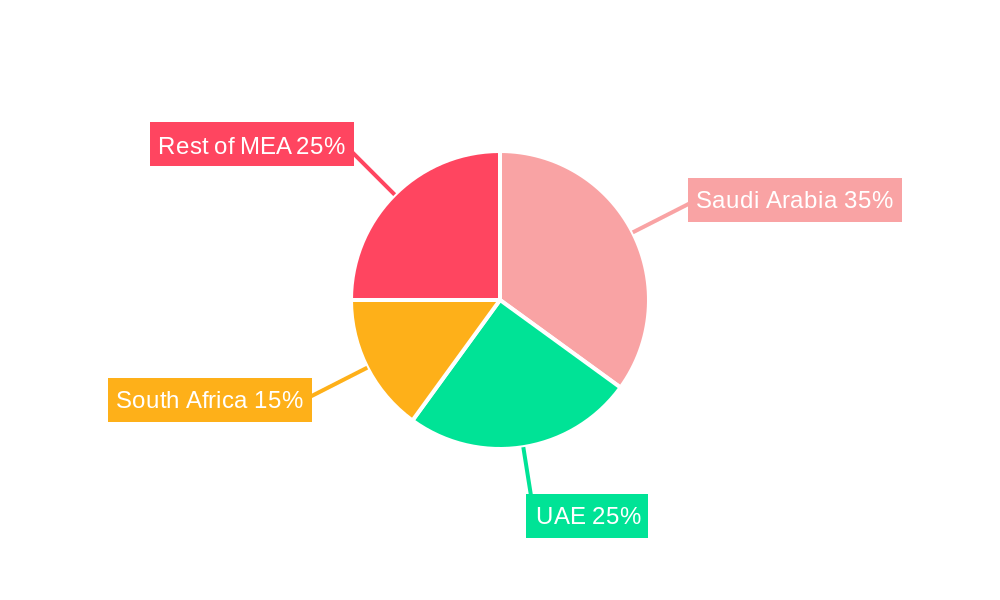
MEA Engineering Plastics Industry Regional Market Share
Geographic Coverage of MEA Engineering Plastics Industry
MEA Engineering Plastics Industry REPORT HIGHLIGHTS
| Aspects | Details |
|---|---|
| Study Period | 2020-2034 |
| Base Year | 2025 |
| Estimated Year | 2026 |
| Forecast Period | 2026-2034 |
| Historical Period | 2020-2025 |
| Growth Rate | CAGR of 4.1% from 2020-2034 |
| Segmentation |
|
Table of Contents
- 1. Introduction
- 1.1. Research Scope
- 1.2. Market Segmentation
- 1.3. Research Objective
- 1.4. Definitions and Assumptions
- 2. Executive Summary
- 2.1. Market Snapshot
- 3. Market Dynamics
- 3.1. Market Drivers
- 3.2. Market Restrains
- 3.3. Market Trends
- 3.4. Market Opportunities
- 4. Market Factor Analysis
- 4.1. Porters Five Forces
- 4.1.1. Bargaining Power of Suppliers
- 4.1.2. Bargaining Power of Buyers
- 4.1.3. Threat of New Entrants
- 4.1.4. Threat of Substitutes
- 4.1.5. Competitive Rivalry
- 4.2. PESTEL analysis
- 4.3. BCG Analysis
- 4.3.1. Stars (High Growth, High Market Share)
- 4.3.2. Cash Cows (Low Growth, High Market Share)
- 4.3.3. Question Mark (High Growth, Low Market Share)
- 4.3.4. Dogs (Low Growth, Low Market Share)
- 4.4. Ansoff Matrix Analysis
- 4.5. Supply Chain Analysis
- 4.6. Regulatory Landscape
- 4.7. Current Market Potential and Opportunity Assessment (TAM–SAM–SOM Framework)
- 4.8. VDR Analyst Note
- 4.1. Porters Five Forces
- 5. Market Analysis, Insights and Forecast 2021-2033
- 5.1. Market Analysis, Insights and Forecast - by Product Type
- 5.1.1. Fluoropolymers
- 5.1.2. Polycarbonate (PC)
- 5.1.3. Polyethylene Terephthalate (PET)
- 5.1.4. Polybutylene Terephthalate (PBT)
- 5.1.5. Polyacetal/ Polyoxymethylene
- 5.1.6. Polymethyl Methacrylate (PMMA)
- 5.1.7. Polyphenylene Oxide
- 5.1.8. Polyphenylene Sulfide (PPS)
- 5.1.9. Styrene Copolymers (ABS & SAN)
- 5.1.10. Liquid Crystal Polymers (LCP)
- 5.1.11. Polyether Ether Ketone (PEEK)
- 5.1.12. Polyimides (PI)
- 5.1.13. Polyamides
- 5.2. Market Analysis, Insights and Forecast - by Application
- 5.2.1. Automotive and Transportation
- 5.2.2. Building and Construction
- 5.2.3. Consumer Goods
- 5.2.4. Electrical and Electronics
- 5.2.5. Industrial and Machinery
- 5.2.6. Packaging
- 5.2.7. Medical
- 5.3. Market Analysis, Insights and Forecast - by Geography
- 5.3.1. Saudi Arabia
- 5.3.2. South Africa
- 5.3.3. Qatar
- 5.3.4. United Arab Emirates
- 5.3.5. Rest of Middle-East and Africa
- 5.4. Market Analysis, Insights and Forecast - by Region
- 5.4.1. Saudi Arabia
- 5.4.2. South Africa
- 5.4.3. Qatar
- 5.4.4. United Arab Emirates
- 5.4.5. Rest of Middle East and Africa
- 5.1. Market Analysis, Insights and Forecast - by Product Type
- 6. Global MEA Engineering Plastics Industry Analysis, Insights and Forecast, 2021-2033
- 6.1. Market Analysis, Insights and Forecast - by Product Type
- 6.1.1. Fluoropolymers
- 6.1.2. Polycarbonate (PC)
- 6.1.3. Polyethylene Terephthalate (PET)
- 6.1.4. Polybutylene Terephthalate (PBT)
- 6.1.5. Polyacetal/ Polyoxymethylene
- 6.1.6. Polymethyl Methacrylate (PMMA)
- 6.1.7. Polyphenylene Oxide
- 6.1.8. Polyphenylene Sulfide (PPS)
- 6.1.9. Styrene Copolymers (ABS & SAN)
- 6.1.10. Liquid Crystal Polymers (LCP)
- 6.1.11. Polyether Ether Ketone (PEEK)
- 6.1.12. Polyimides (PI)
- 6.1.13. Polyamides
- 6.2. Market Analysis, Insights and Forecast - by Application
- 6.2.1. Automotive and Transportation
- 6.2.2. Building and Construction
- 6.2.3. Consumer Goods
- 6.2.4. Electrical and Electronics
- 6.2.5. Industrial and Machinery
- 6.2.6. Packaging
- 6.2.7. Medical
- 6.3. Market Analysis, Insights and Forecast - by Geography
- 6.3.1. Saudi Arabia
- 6.3.2. South Africa
- 6.3.3. Qatar
- 6.3.4. United Arab Emirates
- 6.3.5. Rest of Middle-East and Africa
- 6.1. Market Analysis, Insights and Forecast - by Product Type
- 7. Saudi Arabia MEA Engineering Plastics Industry Analysis, Insights and Forecast, 2021-2033
- 7.1. Market Analysis, Insights and Forecast - by Product Type
- 7.1.1. Fluoropolymers
- 7.1.2. Polycarbonate (PC)
- 7.1.3. Polyethylene Terephthalate (PET)
- 7.1.4. Polybutylene Terephthalate (PBT)
- 7.1.5. Polyacetal/ Polyoxymethylene
- 7.1.6. Polymethyl Methacrylate (PMMA)
- 7.1.7. Polyphenylene Oxide
- 7.1.8. Polyphenylene Sulfide (PPS)
- 7.1.9. Styrene Copolymers (ABS & SAN)
- 7.1.10. Liquid Crystal Polymers (LCP)
- 7.1.11. Polyether Ether Ketone (PEEK)
- 7.1.12. Polyimides (PI)
- 7.1.13. Polyamides
- 7.2. Market Analysis, Insights and Forecast - by Application
- 7.2.1. Automotive and Transportation
- 7.2.2. Building and Construction
- 7.2.3. Consumer Goods
- 7.2.4. Electrical and Electronics
- 7.2.5. Industrial and Machinery
- 7.2.6. Packaging
- 7.2.7. Medical
- 7.3. Market Analysis, Insights and Forecast - by Geography
- 7.3.1. Saudi Arabia
- 7.3.2. South Africa
- 7.3.3. Qatar
- 7.3.4. United Arab Emirates
- 7.3.5. Rest of Middle-East and Africa
- 7.1. Market Analysis, Insights and Forecast - by Product Type
- 8. South Africa MEA Engineering Plastics Industry Analysis, Insights and Forecast, 2021-2033
- 8.1. Market Analysis, Insights and Forecast - by Product Type
- 8.1.1. Fluoropolymers
- 8.1.2. Polycarbonate (PC)
- 8.1.3. Polyethylene Terephthalate (PET)
- 8.1.4. Polybutylene Terephthalate (PBT)
- 8.1.5. Polyacetal/ Polyoxymethylene
- 8.1.6. Polymethyl Methacrylate (PMMA)
- 8.1.7. Polyphenylene Oxide
- 8.1.8. Polyphenylene Sulfide (PPS)
- 8.1.9. Styrene Copolymers (ABS & SAN)
- 8.1.10. Liquid Crystal Polymers (LCP)
- 8.1.11. Polyether Ether Ketone (PEEK)
- 8.1.12. Polyimides (PI)
- 8.1.13. Polyamides
- 8.2. Market Analysis, Insights and Forecast - by Application
- 8.2.1. Automotive and Transportation
- 8.2.2. Building and Construction
- 8.2.3. Consumer Goods
- 8.2.4. Electrical and Electronics
- 8.2.5. Industrial and Machinery
- 8.2.6. Packaging
- 8.2.7. Medical
- 8.3. Market Analysis, Insights and Forecast - by Geography
- 8.3.1. Saudi Arabia
- 8.3.2. South Africa
- 8.3.3. Qatar
- 8.3.4. United Arab Emirates
- 8.3.5. Rest of Middle-East and Africa
- 8.1. Market Analysis, Insights and Forecast - by Product Type
- 9. Qatar MEA Engineering Plastics Industry Analysis, Insights and Forecast, 2021-2033
- 9.1. Market Analysis, Insights and Forecast - by Product Type
- 9.1.1. Fluoropolymers
- 9.1.2. Polycarbonate (PC)
- 9.1.3. Polyethylene Terephthalate (PET)
- 9.1.4. Polybutylene Terephthalate (PBT)
- 9.1.5. Polyacetal/ Polyoxymethylene
- 9.1.6. Polymethyl Methacrylate (PMMA)
- 9.1.7. Polyphenylene Oxide
- 9.1.8. Polyphenylene Sulfide (PPS)
- 9.1.9. Styrene Copolymers (ABS & SAN)
- 9.1.10. Liquid Crystal Polymers (LCP)
- 9.1.11. Polyether Ether Ketone (PEEK)
- 9.1.12. Polyimides (PI)
- 9.1.13. Polyamides
- 9.2. Market Analysis, Insights and Forecast - by Application
- 9.2.1. Automotive and Transportation
- 9.2.2. Building and Construction
- 9.2.3. Consumer Goods
- 9.2.4. Electrical and Electronics
- 9.2.5. Industrial and Machinery
- 9.2.6. Packaging
- 9.2.7. Medical
- 9.3. Market Analysis, Insights and Forecast - by Geography
- 9.3.1. Saudi Arabia
- 9.3.2. South Africa
- 9.3.3. Qatar
- 9.3.4. United Arab Emirates
- 9.3.5. Rest of Middle-East and Africa
- 9.1. Market Analysis, Insights and Forecast - by Product Type
- 10. United Arab Emirates MEA Engineering Plastics Industry Analysis, Insights and Forecast, 2021-2033
- 10.1. Market Analysis, Insights and Forecast - by Product Type
- 10.1.1. Fluoropolymers
- 10.1.2. Polycarbonate (PC)
- 10.1.3. Polyethylene Terephthalate (PET)
- 10.1.4. Polybutylene Terephthalate (PBT)
- 10.1.5. Polyacetal/ Polyoxymethylene
- 10.1.6. Polymethyl Methacrylate (PMMA)
- 10.1.7. Polyphenylene Oxide
- 10.1.8. Polyphenylene Sulfide (PPS)
- 10.1.9. Styrene Copolymers (ABS & SAN)
- 10.1.10. Liquid Crystal Polymers (LCP)
- 10.1.11. Polyether Ether Ketone (PEEK)
- 10.1.12. Polyimides (PI)
- 10.1.13. Polyamides
- 10.2. Market Analysis, Insights and Forecast - by Application
- 10.2.1. Automotive and Transportation
- 10.2.2. Building and Construction
- 10.2.3. Consumer Goods
- 10.2.4. Electrical and Electronics
- 10.2.5. Industrial and Machinery
- 10.2.6. Packaging
- 10.2.7. Medical
- 10.3. Market Analysis, Insights and Forecast - by Geography
- 10.3.1. Saudi Arabia
- 10.3.2. South Africa
- 10.3.3. Qatar
- 10.3.4. United Arab Emirates
- 10.3.5. Rest of Middle-East and Africa
- 10.1. Market Analysis, Insights and Forecast - by Product Type
- 11. Rest of Middle East and Africa MEA Engineering Plastics Industry Analysis, Insights and Forecast, 2021-2033
- 11.1. Market Analysis, Insights and Forecast - by Product Type
- 11.1.1. Fluoropolymers
- 11.1.2. Polycarbonate (PC)
- 11.1.3. Polyethylene Terephthalate (PET)
- 11.1.4. Polybutylene Terephthalate (PBT)
- 11.1.5. Polyacetal/ Polyoxymethylene
- 11.1.6. Polymethyl Methacrylate (PMMA)
- 11.1.7. Polyphenylene Oxide
- 11.1.8. Polyphenylene Sulfide (PPS)
- 11.1.9. Styrene Copolymers (ABS & SAN)
- 11.1.10. Liquid Crystal Polymers (LCP)
- 11.1.11. Polyether Ether Ketone (PEEK)
- 11.1.12. Polyimides (PI)
- 11.1.13. Polyamides
- 11.2. Market Analysis, Insights and Forecast - by Application
- 11.2.1. Automotive and Transportation
- 11.2.2. Building and Construction
- 11.2.3. Consumer Goods
- 11.2.4. Electrical and Electronics
- 11.2.5. Industrial and Machinery
- 11.2.6. Packaging
- 11.2.7. Medical
- 11.3. Market Analysis, Insights and Forecast - by Geography
- 11.3.1. Saudi Arabia
- 11.3.2. South Africa
- 11.3.3. Qatar
- 11.3.4. United Arab Emirates
- 11.3.5. Rest of Middle-East and Africa
- 11.1. Market Analysis, Insights and Forecast - by Product Type
- 12. Competitive Analysis
- 12.1. Company Profiles
- 12.1.1 SABIC
- 12.1.1.1. Company Overview
- 12.1.1.2. Products
- 12.1.1.3. Company Financials
- 12.1.1.4. SWOT Analysis
- 12.1.2 Covestro AG
- 12.1.2.1. Company Overview
- 12.1.2.2. Products
- 12.1.2.3. Company Financials
- 12.1.2.4. SWOT Analysis
- 12.1.3 Celanese Corporation
- 12.1.3.1. Company Overview
- 12.1.3.2. Products
- 12.1.3.3. Company Financials
- 12.1.3.4. SWOT Analysis
- 12.1.4 Lyondellbasell
- 12.1.4.1. Company Overview
- 12.1.4.2. Products
- 12.1.4.3. Company Financials
- 12.1.4.4. SWOT Analysis
- 12.1.5 LG Chem
- 12.1.5.1. Company Overview
- 12.1.5.2. Products
- 12.1.5.3. Company Financials
- 12.1.5.4. SWOT Analysis
- 12.1.6 DuPont
- 12.1.6.1. Company Overview
- 12.1.6.2. Products
- 12.1.6.3. Company Financials
- 12.1.6.4. SWOT Analysis
- 12.1.7 Solvay*List Not Exhaustive
- 12.1.7.1. Company Overview
- 12.1.7.2. Products
- 12.1.7.3. Company Financials
- 12.1.7.4. SWOT Analysis
- 12.1.8 Evonik Industries AG
- 12.1.8.1. Company Overview
- 12.1.8.2. Products
- 12.1.8.3. Company Financials
- 12.1.8.4. SWOT Analysis
- 12.1.9 Eastman Chemical Company
- 12.1.9.1. Company Overview
- 12.1.9.2. Products
- 12.1.9.3. Company Financials
- 12.1.9.4. SWOT Analysis
- 12.1.10 3M
- 12.1.10.1. Company Overview
- 12.1.10.2. Products
- 12.1.10.3. Company Financials
- 12.1.10.4. SWOT Analysis
- 12.1.11 Chemtura Corporation
- 12.1.11.1. Company Overview
- 12.1.11.2. Products
- 12.1.11.3. Company Financials
- 12.1.11.4. SWOT Analysis
- 12.1.12 Chevron Phillips Chemical
- 12.1.12.1. Company Overview
- 12.1.12.2. Products
- 12.1.12.3. Company Financials
- 12.1.12.4. SWOT Analysis
- 12.1.13 Arkema SA
- 12.1.13.1. Company Overview
- 12.1.13.2. Products
- 12.1.13.3. Company Financials
- 12.1.13.4. SWOT Analysis
- 12.1.14 LANXESS
- 12.1.14.1. Company Overview
- 12.1.14.2. Products
- 12.1.14.3. Company Financials
- 12.1.14.4. SWOT Analysis
- 12.1.15 Nova Chemicals Corporation
- 12.1.15.1. Company Overview
- 12.1.15.2. Products
- 12.1.15.3. Company Financials
- 12.1.15.4. SWOT Analysis
- 12.1.16 Ashland Inc
- 12.1.16.1. Company Overview
- 12.1.16.2. Products
- 12.1.16.3. Company Financials
- 12.1.16.4. SWOT Analysis
- 12.1.17 PolyOne Corporation
- 12.1.17.1. Company Overview
- 12.1.17.2. Products
- 12.1.17.3. Company Financials
- 12.1.17.4. SWOT Analysis
- 12.1.18 BASF SE
- 12.1.18.1. Company Overview
- 12.1.18.2. Products
- 12.1.18.3. Company Financials
- 12.1.18.4. SWOT Analysis
- 12.1.1 SABIC
- 12.2. Market Entropy
- 12.2.1 Company's Key Areas Served
- 12.2.2 Recent Developments
- 12.3. Company Market Share Analysis 2025
- 12.3.1 Top 5 Companies Market Share Analysis
- 12.3.2 Top 3 Companies Market Share Analysis
- 12.4. List of Potential Customers
- 13. Research Methodology
List of Figures
- Figure 1: Global MEA Engineering Plastics Industry Revenue Breakdown (billion, %) by Region 2025 & 2033
- Figure 2: Saudi Arabia MEA Engineering Plastics Industry Revenue (billion), by Product Type 2025 & 2033
- Figure 3: Saudi Arabia MEA Engineering Plastics Industry Revenue Share (%), by Product Type 2025 & 2033
- Figure 4: Saudi Arabia MEA Engineering Plastics Industry Revenue (billion), by Application 2025 & 2033
- Figure 5: Saudi Arabia MEA Engineering Plastics Industry Revenue Share (%), by Application 2025 & 2033
- Figure 6: Saudi Arabia MEA Engineering Plastics Industry Revenue (billion), by Geography 2025 & 2033
- Figure 7: Saudi Arabia MEA Engineering Plastics Industry Revenue Share (%), by Geography 2025 & 2033
- Figure 8: Saudi Arabia MEA Engineering Plastics Industry Revenue (billion), by Country 2025 & 2033
- Figure 9: Saudi Arabia MEA Engineering Plastics Industry Revenue Share (%), by Country 2025 & 2033
- Figure 10: South Africa MEA Engineering Plastics Industry Revenue (billion), by Product Type 2025 & 2033
- Figure 11: South Africa MEA Engineering Plastics Industry Revenue Share (%), by Product Type 2025 & 2033
- Figure 12: South Africa MEA Engineering Plastics Industry Revenue (billion), by Application 2025 & 2033
- Figure 13: South Africa MEA Engineering Plastics Industry Revenue Share (%), by Application 2025 & 2033
- Figure 14: South Africa MEA Engineering Plastics Industry Revenue (billion), by Geography 2025 & 2033
- Figure 15: South Africa MEA Engineering Plastics Industry Revenue Share (%), by Geography 2025 & 2033
- Figure 16: South Africa MEA Engineering Plastics Industry Revenue (billion), by Country 2025 & 2033
- Figure 17: South Africa MEA Engineering Plastics Industry Revenue Share (%), by Country 2025 & 2033
- Figure 18: Qatar MEA Engineering Plastics Industry Revenue (billion), by Product Type 2025 & 2033
- Figure 19: Qatar MEA Engineering Plastics Industry Revenue Share (%), by Product Type 2025 & 2033
- Figure 20: Qatar MEA Engineering Plastics Industry Revenue (billion), by Application 2025 & 2033
- Figure 21: Qatar MEA Engineering Plastics Industry Revenue Share (%), by Application 2025 & 2033
- Figure 22: Qatar MEA Engineering Plastics Industry Revenue (billion), by Geography 2025 & 2033
- Figure 23: Qatar MEA Engineering Plastics Industry Revenue Share (%), by Geography 2025 & 2033
- Figure 24: Qatar MEA Engineering Plastics Industry Revenue (billion), by Country 2025 & 2033
- Figure 25: Qatar MEA Engineering Plastics Industry Revenue Share (%), by Country 2025 & 2033
- Figure 26: United Arab Emirates MEA Engineering Plastics Industry Revenue (billion), by Product Type 2025 & 2033
- Figure 27: United Arab Emirates MEA Engineering Plastics Industry Revenue Share (%), by Product Type 2025 & 2033
- Figure 28: United Arab Emirates MEA Engineering Plastics Industry Revenue (billion), by Application 2025 & 2033
- Figure 29: United Arab Emirates MEA Engineering Plastics Industry Revenue Share (%), by Application 2025 & 2033
- Figure 30: United Arab Emirates MEA Engineering Plastics Industry Revenue (billion), by Geography 2025 & 2033
- Figure 31: United Arab Emirates MEA Engineering Plastics Industry Revenue Share (%), by Geography 2025 & 2033
- Figure 32: United Arab Emirates MEA Engineering Plastics Industry Revenue (billion), by Country 2025 & 2033
- Figure 33: United Arab Emirates MEA Engineering Plastics Industry Revenue Share (%), by Country 2025 & 2033
- Figure 34: Rest of Middle East and Africa MEA Engineering Plastics Industry Revenue (billion), by Product Type 2025 & 2033
- Figure 35: Rest of Middle East and Africa MEA Engineering Plastics Industry Revenue Share (%), by Product Type 2025 & 2033
- Figure 36: Rest of Middle East and Africa MEA Engineering Plastics Industry Revenue (billion), by Application 2025 & 2033
- Figure 37: Rest of Middle East and Africa MEA Engineering Plastics Industry Revenue Share (%), by Application 2025 & 2033
- Figure 38: Rest of Middle East and Africa MEA Engineering Plastics Industry Revenue (billion), by Geography 2025 & 2033
- Figure 39: Rest of Middle East and Africa MEA Engineering Plastics Industry Revenue Share (%), by Geography 2025 & 2033
- Figure 40: Rest of Middle East and Africa MEA Engineering Plastics Industry Revenue (billion), by Country 2025 & 2033
- Figure 41: Rest of Middle East and Africa MEA Engineering Plastics Industry Revenue Share (%), by Country 2025 & 2033
List of Tables
- Table 1: Global MEA Engineering Plastics Industry Revenue billion Forecast, by Product Type 2020 & 2033
- Table 2: Global MEA Engineering Plastics Industry Revenue billion Forecast, by Application 2020 & 2033
- Table 3: Global MEA Engineering Plastics Industry Revenue billion Forecast, by Geography 2020 & 2033
- Table 4: Global MEA Engineering Plastics Industry Revenue billion Forecast, by Region 2020 & 2033
- Table 5: Global MEA Engineering Plastics Industry Revenue billion Forecast, by Product Type 2020 & 2033
- Table 6: Global MEA Engineering Plastics Industry Revenue billion Forecast, by Application 2020 & 2033
- Table 7: Global MEA Engineering Plastics Industry Revenue billion Forecast, by Geography 2020 & 2033
- Table 8: Global MEA Engineering Plastics Industry Revenue billion Forecast, by Country 2020 & 2033
- Table 9: Global MEA Engineering Plastics Industry Revenue billion Forecast, by Product Type 2020 & 2033
- Table 10: Global MEA Engineering Plastics Industry Revenue billion Forecast, by Application 2020 & 2033
- Table 11: Global MEA Engineering Plastics Industry Revenue billion Forecast, by Geography 2020 & 2033
- Table 12: Global MEA Engineering Plastics Industry Revenue billion Forecast, by Country 2020 & 2033
- Table 13: Global MEA Engineering Plastics Industry Revenue billion Forecast, by Product Type 2020 & 2033
- Table 14: Global MEA Engineering Plastics Industry Revenue billion Forecast, by Application 2020 & 2033
- Table 15: Global MEA Engineering Plastics Industry Revenue billion Forecast, by Geography 2020 & 2033
- Table 16: Global MEA Engineering Plastics Industry Revenue billion Forecast, by Country 2020 & 2033
- Table 17: Global MEA Engineering Plastics Industry Revenue billion Forecast, by Product Type 2020 & 2033
- Table 18: Global MEA Engineering Plastics Industry Revenue billion Forecast, by Application 2020 & 2033
- Table 19: Global MEA Engineering Plastics Industry Revenue billion Forecast, by Geography 2020 & 2033
- Table 20: Global MEA Engineering Plastics Industry Revenue billion Forecast, by Country 2020 & 2033
- Table 21: Global MEA Engineering Plastics Industry Revenue billion Forecast, by Product Type 2020 & 2033
- Table 22: Global MEA Engineering Plastics Industry Revenue billion Forecast, by Application 2020 & 2033
- Table 23: Global MEA Engineering Plastics Industry Revenue billion Forecast, by Geography 2020 & 2033
- Table 24: Global MEA Engineering Plastics Industry Revenue billion Forecast, by Country 2020 & 2033
Frequently Asked Questions
1. What is the projected Compound Annual Growth Rate (CAGR) of the MEA Engineering Plastics Industry?
The projected CAGR is approximately 4.1%.
2. Which companies are prominent players in the MEA Engineering Plastics Industry?
Key companies in the market include SABIC, Covestro AG, Celanese Corporation, Lyondellbasell, LG Chem, DuPont, Solvay*List Not Exhaustive, Evonik Industries AG, Eastman Chemical Company, 3M, Chemtura Corporation, Chevron Phillips Chemical, Arkema SA, LANXESS, Nova Chemicals Corporation, Ashland Inc, PolyOne Corporation, BASF SE.
3. What are the main segments of the MEA Engineering Plastics Industry?
The market segments include Product Type, Application, Geography.
4. Can you provide details about the market size?
The market size is estimated to be USD 107.17 billion as of 2022.
5. What are some drivers contributing to market growth?
; Growing Purchasing Power in the Countries; Engineering Plastics Replacing Traditional Materials.
6. What are the notable trends driving market growth?
Polyethylene Terephthalate (PET): The Most Used Engineering Plastic.
7. Are there any restraints impacting market growth?
; Volatility in Raw Material Prices; Other Restraints.
8. Can you provide examples of recent developments in the market?
N/A
9. What pricing options are available for accessing the report?
Pricing options include single-user, multi-user, and enterprise licenses priced at USD 4750, USD 5250, and USD 8750 respectively.
10. Is the market size provided in terms of value or volume?
The market size is provided in terms of value, measured in billion.
11. Are there any specific market keywords associated with the report?
Yes, the market keyword associated with the report is "MEA Engineering Plastics Industry," which aids in identifying and referencing the specific market segment covered.
12. How do I determine which pricing option suits my needs best?
The pricing options vary based on user requirements and access needs. Individual users may opt for single-user licenses, while businesses requiring broader access may choose multi-user or enterprise licenses for cost-effective access to the report.
13. Are there any additional resources or data provided in the MEA Engineering Plastics Industry report?
While the report offers comprehensive insights, it's advisable to review the specific contents or supplementary materials provided to ascertain if additional resources or data are available.
14. How can I stay updated on further developments or reports in the MEA Engineering Plastics Industry?
To stay informed about further developments, trends, and reports in the MEA Engineering Plastics Industry, consider subscribing to industry newsletters, following relevant companies and organizations, or regularly checking reputable industry news sources and publications.
Methodology
Step 1 - Identification of Relevant Samples Size from Population Database


Step 2 - Approaches for Defining Global Market Size (Value, Volume* & Price*)

Note*: In applicable scenarios
Step 3 - Data Sources
Primary Research
- Web Analytics
- Survey Reports
- Research Institute
- Latest Research Reports
- Opinion Leaders
Secondary Research
- Annual Reports
- White Paper
- Latest Press Release
- Industry Association
- Paid Database
- Investor Presentations

Step 4 - Data Triangulation
Involves using different sources of information in order to increase the validity of a study
These sources are likely to be stakeholders in a program - participants, other researchers, program staff, other community members, and so on.
Then we put all data in single framework & apply various statistical tools to find out the dynamic on the market.
During the analysis stage, feedback from the stakeholder groups would be compared to determine areas of agreement as well as areas of divergence