
Key Insights
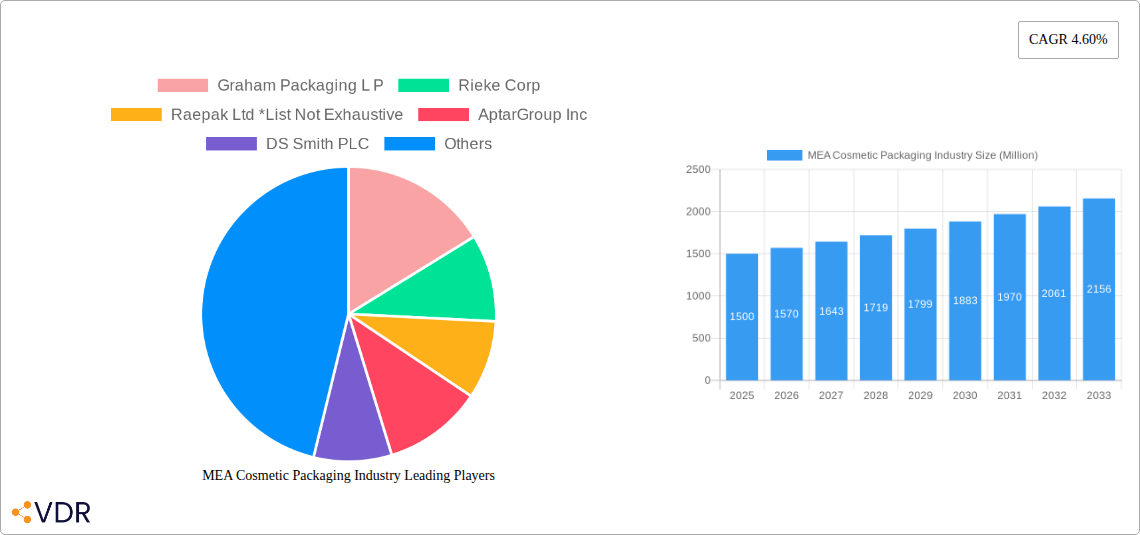
The Middle East and Africa (MEA) cosmetic packaging market is experiencing robust growth, driven by a burgeoning cosmetics industry and a rising consumer preference for premium and sustainable packaging solutions. The market, estimated at XX million in 2025, is projected to exhibit a Compound Annual Growth Rate (CAGR) of 4.60% from 2025 to 2033. This growth is fueled by several key factors. Firstly, the increasing disposable incomes across the MEA region are leading to higher spending on beauty and personal care products, directly impacting demand for packaging. Secondly, the rising popularity of e-commerce is boosting demand for convenient and protective packaging solutions. Thirdly, a growing awareness of environmental concerns is pushing manufacturers towards eco-friendly materials like recycled plastics and paper-based alternatives, creating opportunities for sustainable packaging solutions. Finally, the cosmetics industry's focus on innovative and appealing packaging designs to enhance brand identity contributes significantly to market expansion. Key segments driving growth include plastic and glass bottles and containers, followed by folding cartons and tubes for the growing demand of various cosmetic products. Hair care, skin care, and color cosmetics dominate the cosmetic type segment, each showcasing high growth potential based on regional trends and consumer preferences. Leading players such as Amcor PLC, Berry Global Group, and AptarGroup Inc are strategically positioned to capitalize on these trends through product innovation and strategic acquisitions.
The competitive landscape is characterized by a mix of both international and regional players. International players benefit from their established brand reputation and advanced technological capabilities, whereas regional players leverage their strong distribution networks and understanding of local consumer preferences. However, the market also faces challenges such as fluctuating raw material prices and stringent regulatory requirements related to packaging safety and environmental sustainability. This necessitates a focus on supply chain diversification and compliance with international standards. The future growth of the MEA cosmetic packaging market hinges on the continued expansion of the cosmetic industry, increasing consumer spending, and the adoption of sustainable and innovative packaging solutions. Market players need to invest in research and development to meet evolving consumer preferences and regulatory demands to maintain a strong competitive edge. This includes exploring new materials, innovative designs, and sustainable packaging alternatives, which are becoming increasingly vital.
MEA Cosmetic Packaging Industry: A Comprehensive Market Report (2019-2033)
This comprehensive report provides an in-depth analysis of the Middle East and Africa (MEA) cosmetic packaging industry, offering invaluable insights for industry professionals, investors, and strategic decision-makers. The study covers the period from 2019 to 2033, with a focus on the 2025-2033 forecast period. Key segments analyzed include material type (plastic, glass, metal, paper), product type (bottles, containers, tubes, closures, etc.), cosmetic type (hair care, skincare, color cosmetics, etc.), and key countries within the MEA region (UAE, Saudi Arabia, South Africa, and Rest of MEA). The report also profiles leading players such as Graham Packaging L P, Rieke Corp, Raepak Ltd, AptarGroup Inc, DS Smith PLC, Amcor PLC, Cosmopak Ltd, Albea SA, RPC Group PLC (Berry Global Group), Silgan Holdings Inc, and Gerresheimer AG.
MEA Cosmetic Packaging Industry Market Dynamics & Structure
The MEA cosmetic packaging market is characterized by moderate concentration, with several multinational players and regional players vying for market share. Technological innovation, particularly in sustainable and eco-friendly packaging solutions, is a key driver. Stringent regulatory frameworks concerning material safety and environmental impact influence packaging choices. The market faces competition from substitute materials and packaging types. Demographic shifts, including rising disposable incomes and a growing young population, fuel demand. M&A activity within the industry is expected to remain moderate, with consolidation among smaller players likely.
- Market Concentration: xx% controlled by top 5 players in 2024.
- Technological Innovation: Focus on lightweighting, sustainable materials (e.g., recycled plastic, biodegradable options), and smart packaging.
- Regulatory Landscape: Compliance with regional and international standards regarding material safety and recyclability.
- Competitive Substitutes: Growing competition from flexible packaging and alternative closure systems.
- End-User Demographics: Significant growth potential driven by rising middle class and increasing cosmetic consumption.
- M&A Activity: xx deals recorded between 2019-2024, with a projected xx deals for 2025-2033.
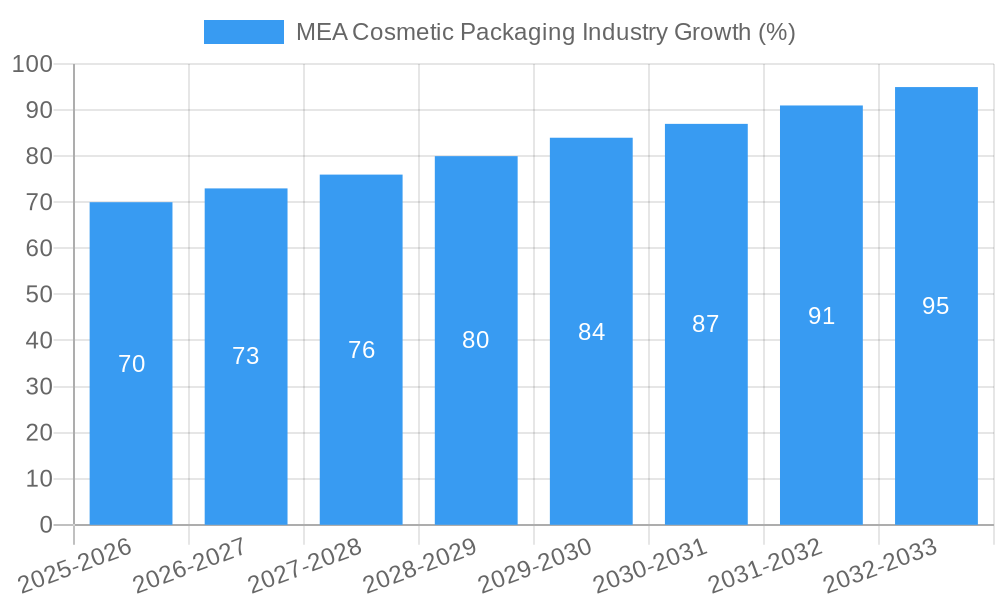
MEA Cosmetic Packaging Industry Growth Trends & Insights
The MEA cosmetic packaging market is projected to witness robust growth throughout the forecast period (2025-2033). Market size expansion is fueled by increasing demand for cosmetics across various segments, particularly in the skin care and color cosmetics categories. Adoption of innovative packaging formats, including airless pumps and sustainable options, is steadily increasing. Technological disruptions such as the use of augmented reality (AR) and smart packaging are gaining traction. Consumer behavior is shifting toward eco-conscious choices, driving demand for sustainable and recyclable packaging. The CAGR for the period 2025-2033 is projected to be xx%. Market penetration of sustainable packaging is expected to reach xx% by 2033.
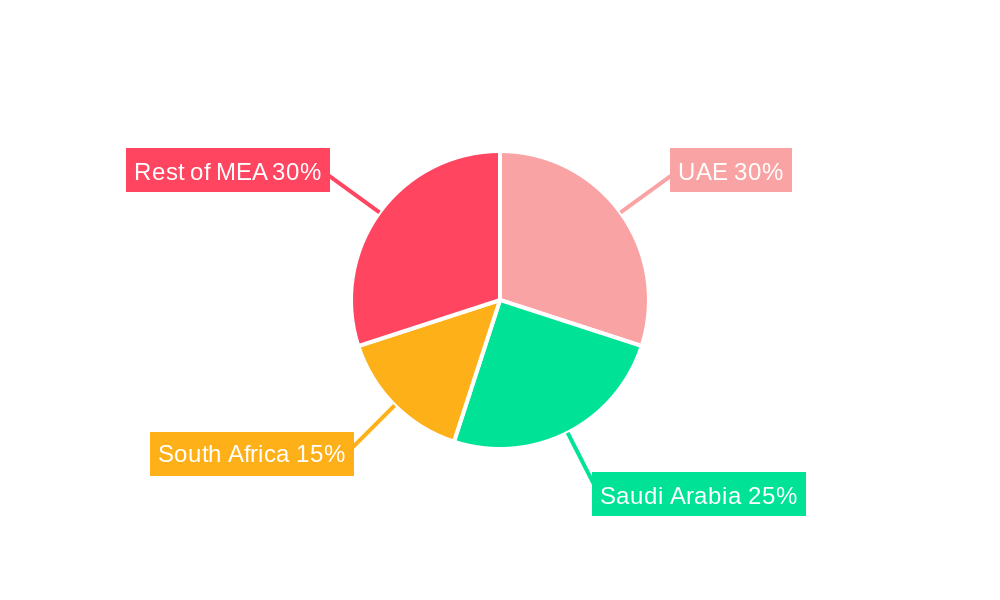
Dominant Regions, Countries, or Segments in MEA Cosmetic Packaging Industry
The UAE and Saudi Arabia are leading the MEA cosmetic packaging market, driven by strong economic growth, high disposable incomes, and a burgeoning beauty and personal care industry. South Africa also exhibits significant growth potential. The plastic packaging segment holds the largest market share due to its cost-effectiveness and versatility, however, growth in sustainable alternatives (paper and recycled materials) is significant. Within product types, plastic bottles and containers, followed by tubes and sticks, dominate the market. The skin care segment is the largest consumer of cosmetic packaging, followed by hair care and color cosmetics.
- Key Drivers (UAE & Saudi Arabia): High per capita spending on cosmetics, well-developed retail infrastructure, and favorable government initiatives.
- Key Drivers (South Africa): Growing middle class, rising disposable incomes, and increasing awareness of beauty and personal care.
- Market Share: UAE holds xx% market share, Saudi Arabia xx%, South Africa xx%, and Rest of MEA xx% (2024).
- Growth Potential: Significant growth potential in Rest of MEA region due to increasing urbanization and rising cosmetic consumption.
MEA Cosmetic Packaging Industry Product Landscape
Product innovation is a key differentiator in the MEA cosmetic packaging market. Manufacturers are focusing on developing sustainable, lightweight, and functional packaging solutions. These include eco-friendly materials (recycled plastics, plant-based materials), innovative closures (airless pumps, tamper-evident seals), and smart packaging incorporating technology for enhanced consumer experience. Unique selling propositions (USPs) are centered around convenience, sustainability, and brand differentiation.
Key Drivers, Barriers & Challenges in MEA Cosmetic Packaging Industry
Key Drivers: Growing cosmetic industry, rising consumer disposable incomes, increasing demand for premium and sustainable packaging, and technological advancements in packaging materials and designs.
Key Challenges: Fluctuating raw material prices, stringent regulatory compliance requirements, intense competition among packaging providers, supply chain disruptions, and counterfeiting concerns. The projected impact of these challenges on market growth is a reduction in CAGR by approximately xx%.
Emerging Opportunities in MEA Cosmetic Packaging Industry
Emerging opportunities lie in the growing demand for sustainable and eco-friendly packaging options, personalized packaging solutions, and the increasing use of smart packaging technologies. Untapped markets in the Rest of MEA region present significant growth potential. The increasing popularity of e-commerce is driving demand for convenient and secure packaging solutions.
Growth Accelerators in the MEA Cosmetic Packaging Industry
Technological advancements in materials and manufacturing processes, strategic partnerships between packaging companies and cosmetic brands, and expansion into new markets within the MEA region are key growth catalysts. A focus on sustainable packaging solutions will further accelerate market expansion and attract environmentally conscious consumers.
Key Players Shaping the MEA Cosmetic Packaging Industry Market
- Graham Packaging L P
- Rieke Corp
- Raepak Ltd
- AptarGroup Inc
- DS Smith PLC
- Amcor PLC
- Cosmopak Ltd
- Albea SA
- RPC Group PLC (Berry Global Group)
- Silgan Holdings Inc
- Gerresheimer AG
Notable Milestones in MEA Cosmetic Packaging Industry Sector
- 2021: Launch of a new range of sustainable packaging solutions by Amcor PLC in the UAE.
- 2022: Acquisition of a regional packaging company by AptarGroup Inc in Saudi Arabia.
- 2023: Introduction of new regulations concerning plastic packaging in South Africa.
- 2024: Several key players announced investments to increase capacity and production in MEA countries.
In-Depth MEA Cosmetic Packaging Industry Market Outlook
The MEA cosmetic packaging market is poised for significant growth in the coming years, driven by strong economic growth, evolving consumer preferences, and increasing adoption of innovative packaging solutions. Strategic opportunities exist for companies focusing on sustainability, personalization, and technological advancements. The market’s future hinges on adapting to evolving regulations, supply chain management, and catering to consumer demand for eco-friendly alternatives.
MEA Cosmetic Packaging Industry Segmentation
-
1. Material type
- 1.1. Plastic
- 1.2. Glass
- 1.3. Metal
- 1.4. Paper
-
2. Product Type
- 2.1. Plastic Bottles and Containers
- 2.2. Glass Bottles and Containers
- 2.3. Metal Containers
- 2.4. Folding Cartons
- 2.5. Corrugated Boxes
- 2.6. Tubes and Sticks
- 2.7. Caps and Closures
- 2.8. Pump and Dispenser
- 2.9. Droppers
- 2.10. Ampoules
- 2.11. Flexible Plastic Packaging
-
3. Cosmetic Type
- 3.1. Hair Care
- 3.2. Color Cosmetics
- 3.3. Skin Care
- 3.4. Men's Grooming
- 3.5. Deodorants
- 3.6. Other Co
MEA Cosmetic Packaging Industry Segmentation By Geography
-
1. North America
- 1.1. United States
- 1.2. Canada
- 1.3. Mexico
-
2. South America
- 2.1. Brazil
- 2.2. Argentina
- 2.3. Rest of South America
-
3. Europe
- 3.1. United Kingdom
- 3.2. Germany
- 3.3. France
- 3.4. Italy
- 3.5. Spain
- 3.6. Russia
- 3.7. Benelux
- 3.8. Nordics
- 3.9. Rest of Europe
-
4. Middle East & Africa
- 4.1. Turkey
- 4.2. Israel
- 4.3. GCC
- 4.4. North Africa
- 4.5. South Africa
- 4.6. Rest of Middle East & Africa
-
5. Asia Pacific
- 5.1. China
- 5.2. India
- 5.3. Japan
- 5.4. South Korea
- 5.5. ASEAN
- 5.6. Oceania
- 5.7. Rest of Asia Pacific
MEA Cosmetic Packaging Industry REPORT HIGHLIGHTS
| Aspects | Details |
|---|---|
| Study Period | 2019-2033 |
| Base Year | 2024 |
| Estimated Year | 2025 |
| Forecast Period | 2025-2033 |
| Historical Period | 2019-2024 |
| Growth Rate | CAGR of 4.60% from 2019-2033 |
| Segmentation |
|
Table of Contents
- 1. Introduction
- 1.1. Research Scope
- 1.2. Market Segmentation
- 1.3. Research Methodology
- 1.4. Definitions and Assumptions
- 2. Executive Summary
- 2.1. Introduction
- 3. Market Dynamics
- 3.1. Introduction
- 3.2. Market Drivers
- 3.2.1. ; Increasing Focus on Innovation and Attractive Packaging
- 3.3. Market Restrains
- 3.3.1. ; Growing Sustainability Concerns
- 3.4. Market Trends
- 3.4.1. Sustainable Packaging to Drive the Market Growth
- 4. Market Factor Analysis
- 4.1. Porters Five Forces
- 4.2. Supply/Value Chain
- 4.3. PESTEL analysis
- 4.4. Market Entropy
- 4.5. Patent/Trademark Analysis
- 5. Global MEA Cosmetic Packaging Industry Analysis, Insights and Forecast, 2019-2031
- 5.1. Market Analysis, Insights and Forecast - by Material type
- 5.1.1. Plastic
- 5.1.2. Glass
- 5.1.3. Metal
- 5.1.4. Paper
- 5.2. Market Analysis, Insights and Forecast - by Product Type
- 5.2.1. Plastic Bottles and Containers
- 5.2.2. Glass Bottles and Containers
- 5.2.3. Metal Containers
- 5.2.4. Folding Cartons
- 5.2.5. Corrugated Boxes
- 5.2.6. Tubes and Sticks
- 5.2.7. Caps and Closures
- 5.2.8. Pump and Dispenser
- 5.2.9. Droppers
- 5.2.10. Ampoules
- 5.2.11. Flexible Plastic Packaging
- 5.3. Market Analysis, Insights and Forecast - by Cosmetic Type
- 5.3.1. Hair Care
- 5.3.2. Color Cosmetics
- 5.3.3. Skin Care
- 5.3.4. Men's Grooming
- 5.3.5. Deodorants
- 5.3.6. Other Co
- 5.4. Market Analysis, Insights and Forecast - by Region
- 5.4.1. North America
- 5.4.2. South America
- 5.4.3. Europe
- 5.4.4. Middle East & Africa
- 5.4.5. Asia Pacific
- 5.1. Market Analysis, Insights and Forecast - by Material type
- 6. North America MEA Cosmetic Packaging Industry Analysis, Insights and Forecast, 2019-2031
- 6.1. Market Analysis, Insights and Forecast - by Material type
- 6.1.1. Plastic
- 6.1.2. Glass
- 6.1.3. Metal
- 6.1.4. Paper
- 6.2. Market Analysis, Insights and Forecast - by Product Type
- 6.2.1. Plastic Bottles and Containers
- 6.2.2. Glass Bottles and Containers
- 6.2.3. Metal Containers
- 6.2.4. Folding Cartons
- 6.2.5. Corrugated Boxes
- 6.2.6. Tubes and Sticks
- 6.2.7. Caps and Closures
- 6.2.8. Pump and Dispenser
- 6.2.9. Droppers
- 6.2.10. Ampoules
- 6.2.11. Flexible Plastic Packaging
- 6.3. Market Analysis, Insights and Forecast - by Cosmetic Type
- 6.3.1. Hair Care
- 6.3.2. Color Cosmetics
- 6.3.3. Skin Care
- 6.3.4. Men's Grooming
- 6.3.5. Deodorants
- 6.3.6. Other Co
- 6.1. Market Analysis, Insights and Forecast - by Material type
- 7. South America MEA Cosmetic Packaging Industry Analysis, Insights and Forecast, 2019-2031
- 7.1. Market Analysis, Insights and Forecast - by Material type
- 7.1.1. Plastic
- 7.1.2. Glass
- 7.1.3. Metal
- 7.1.4. Paper
- 7.2. Market Analysis, Insights and Forecast - by Product Type
- 7.2.1. Plastic Bottles and Containers
- 7.2.2. Glass Bottles and Containers
- 7.2.3. Metal Containers
- 7.2.4. Folding Cartons
- 7.2.5. Corrugated Boxes
- 7.2.6. Tubes and Sticks
- 7.2.7. Caps and Closures
- 7.2.8. Pump and Dispenser
- 7.2.9. Droppers
- 7.2.10. Ampoules
- 7.2.11. Flexible Plastic Packaging
- 7.3. Market Analysis, Insights and Forecast - by Cosmetic Type
- 7.3.1. Hair Care
- 7.3.2. Color Cosmetics
- 7.3.3. Skin Care
- 7.3.4. Men's Grooming
- 7.3.5. Deodorants
- 7.3.6. Other Co
- 7.1. Market Analysis, Insights and Forecast - by Material type
- 8. Europe MEA Cosmetic Packaging Industry Analysis, Insights and Forecast, 2019-2031
- 8.1. Market Analysis, Insights and Forecast - by Material type
- 8.1.1. Plastic
- 8.1.2. Glass
- 8.1.3. Metal
- 8.1.4. Paper
- 8.2. Market Analysis, Insights and Forecast - by Product Type
- 8.2.1. Plastic Bottles and Containers
- 8.2.2. Glass Bottles and Containers
- 8.2.3. Metal Containers
- 8.2.4. Folding Cartons
- 8.2.5. Corrugated Boxes
- 8.2.6. Tubes and Sticks
- 8.2.7. Caps and Closures
- 8.2.8. Pump and Dispenser
- 8.2.9. Droppers
- 8.2.10. Ampoules
- 8.2.11. Flexible Plastic Packaging
- 8.3. Market Analysis, Insights and Forecast - by Cosmetic Type
- 8.3.1. Hair Care
- 8.3.2. Color Cosmetics
- 8.3.3. Skin Care
- 8.3.4. Men's Grooming
- 8.3.5. Deodorants
- 8.3.6. Other Co
- 8.1. Market Analysis, Insights and Forecast - by Material type
- 9. Middle East & Africa MEA Cosmetic Packaging Industry Analysis, Insights and Forecast, 2019-2031
- 9.1. Market Analysis, Insights and Forecast - by Material type
- 9.1.1. Plastic
- 9.1.2. Glass
- 9.1.3. Metal
- 9.1.4. Paper
- 9.2. Market Analysis, Insights and Forecast - by Product Type
- 9.2.1. Plastic Bottles and Containers
- 9.2.2. Glass Bottles and Containers
- 9.2.3. Metal Containers
- 9.2.4. Folding Cartons
- 9.2.5. Corrugated Boxes
- 9.2.6. Tubes and Sticks
- 9.2.7. Caps and Closures
- 9.2.8. Pump and Dispenser
- 9.2.9. Droppers
- 9.2.10. Ampoules
- 9.2.11. Flexible Plastic Packaging
- 9.3. Market Analysis, Insights and Forecast - by Cosmetic Type
- 9.3.1. Hair Care
- 9.3.2. Color Cosmetics
- 9.3.3. Skin Care
- 9.3.4. Men's Grooming
- 9.3.5. Deodorants
- 9.3.6. Other Co
- 9.1. Market Analysis, Insights and Forecast - by Material type
- 10. Asia Pacific MEA Cosmetic Packaging Industry Analysis, Insights and Forecast, 2019-2031
- 10.1. Market Analysis, Insights and Forecast - by Material type
- 10.1.1. Plastic
- 10.1.2. Glass
- 10.1.3. Metal
- 10.1.4. Paper
- 10.2. Market Analysis, Insights and Forecast - by Product Type
- 10.2.1. Plastic Bottles and Containers
- 10.2.2. Glass Bottles and Containers
- 10.2.3. Metal Containers
- 10.2.4. Folding Cartons
- 10.2.5. Corrugated Boxes
- 10.2.6. Tubes and Sticks
- 10.2.7. Caps and Closures
- 10.2.8. Pump and Dispenser
- 10.2.9. Droppers
- 10.2.10. Ampoules
- 10.2.11. Flexible Plastic Packaging
- 10.3. Market Analysis, Insights and Forecast - by Cosmetic Type
- 10.3.1. Hair Care
- 10.3.2. Color Cosmetics
- 10.3.3. Skin Care
- 10.3.4. Men's Grooming
- 10.3.5. Deodorants
- 10.3.6. Other Co
- 10.1. Market Analysis, Insights and Forecast - by Material type
- 11. Competitive Analysis
- 11.1. Global Market Share Analysis 2024
- 11.2. Company Profiles
- 11.2.1 Graham Packaging L P
- 11.2.1.1. Overview
- 11.2.1.2. Products
- 11.2.1.3. SWOT Analysis
- 11.2.1.4. Recent Developments
- 11.2.1.5. Financials (Based on Availability)
- 11.2.2 Rieke Corp
- 11.2.2.1. Overview
- 11.2.2.2. Products
- 11.2.2.3. SWOT Analysis
- 11.2.2.4. Recent Developments
- 11.2.2.5. Financials (Based on Availability)
- 11.2.3 Raepak Ltd *List Not Exhaustive
- 11.2.3.1. Overview
- 11.2.3.2. Products
- 11.2.3.3. SWOT Analysis
- 11.2.3.4. Recent Developments
- 11.2.3.5. Financials (Based on Availability)
- 11.2.4 AptarGroup Inc
- 11.2.4.1. Overview
- 11.2.4.2. Products
- 11.2.4.3. SWOT Analysis
- 11.2.4.4. Recent Developments
- 11.2.4.5. Financials (Based on Availability)
- 11.2.5 DS Smith PLC
- 11.2.5.1. Overview
- 11.2.5.2. Products
- 11.2.5.3. SWOT Analysis
- 11.2.5.4. Recent Developments
- 11.2.5.5. Financials (Based on Availability)
- 11.2.6 Amcor PLC
- 11.2.6.1. Overview
- 11.2.6.2. Products
- 11.2.6.3. SWOT Analysis
- 11.2.6.4. Recent Developments
- 11.2.6.5. Financials (Based on Availability)
- 11.2.7 Cosmopak Ltd
- 11.2.7.1. Overview
- 11.2.7.2. Products
- 11.2.7.3. SWOT Analysis
- 11.2.7.4. Recent Developments
- 11.2.7.5. Financials (Based on Availability)
- 11.2.8 Albea SA
- 11.2.8.1. Overview
- 11.2.8.2. Products
- 11.2.8.3. SWOT Analysis
- 11.2.8.4. Recent Developments
- 11.2.8.5. Financials (Based on Availability)
- 11.2.9 RPC Group PLC (Berry Global Group)
- 11.2.9.1. Overview
- 11.2.9.2. Products
- 11.2.9.3. SWOT Analysis
- 11.2.9.4. Recent Developments
- 11.2.9.5. Financials (Based on Availability)
- 11.2.10 Silgan Holdings Inc
- 11.2.10.1. Overview
- 11.2.10.2. Products
- 11.2.10.3. SWOT Analysis
- 11.2.10.4. Recent Developments
- 11.2.10.5. Financials (Based on Availability)
- 11.2.11 Gerresheimer AG
- 11.2.11.1. Overview
- 11.2.11.2. Products
- 11.2.11.3. SWOT Analysis
- 11.2.11.4. Recent Developments
- 11.2.11.5. Financials (Based on Availability)
- 11.2.1 Graham Packaging L P
List of Figures
- Figure 1: Global MEA Cosmetic Packaging Industry Revenue Breakdown (Million, %) by Region 2024 & 2032
- Figure 2: North America MEA Cosmetic Packaging Industry Revenue (Million), by Material type 2024 & 2032
- Figure 3: North America MEA Cosmetic Packaging Industry Revenue Share (%), by Material type 2024 & 2032
- Figure 4: North America MEA Cosmetic Packaging Industry Revenue (Million), by Product Type 2024 & 2032
- Figure 5: North America MEA Cosmetic Packaging Industry Revenue Share (%), by Product Type 2024 & 2032
- Figure 6: North America MEA Cosmetic Packaging Industry Revenue (Million), by Cosmetic Type 2024 & 2032
- Figure 7: North America MEA Cosmetic Packaging Industry Revenue Share (%), by Cosmetic Type 2024 & 2032
- Figure 8: North America MEA Cosmetic Packaging Industry Revenue (Million), by Country 2024 & 2032
- Figure 9: North America MEA Cosmetic Packaging Industry Revenue Share (%), by Country 2024 & 2032
- Figure 10: South America MEA Cosmetic Packaging Industry Revenue (Million), by Material type 2024 & 2032
- Figure 11: South America MEA Cosmetic Packaging Industry Revenue Share (%), by Material type 2024 & 2032
- Figure 12: South America MEA Cosmetic Packaging Industry Revenue (Million), by Product Type 2024 & 2032
- Figure 13: South America MEA Cosmetic Packaging Industry Revenue Share (%), by Product Type 2024 & 2032
- Figure 14: South America MEA Cosmetic Packaging Industry Revenue (Million), by Cosmetic Type 2024 & 2032
- Figure 15: South America MEA Cosmetic Packaging Industry Revenue Share (%), by Cosmetic Type 2024 & 2032
- Figure 16: South America MEA Cosmetic Packaging Industry Revenue (Million), by Country 2024 & 2032
- Figure 17: South America MEA Cosmetic Packaging Industry Revenue Share (%), by Country 2024 & 2032
- Figure 18: Europe MEA Cosmetic Packaging Industry Revenue (Million), by Material type 2024 & 2032
- Figure 19: Europe MEA Cosmetic Packaging Industry Revenue Share (%), by Material type 2024 & 2032
- Figure 20: Europe MEA Cosmetic Packaging Industry Revenue (Million), by Product Type 2024 & 2032
- Figure 21: Europe MEA Cosmetic Packaging Industry Revenue Share (%), by Product Type 2024 & 2032
- Figure 22: Europe MEA Cosmetic Packaging Industry Revenue (Million), by Cosmetic Type 2024 & 2032
- Figure 23: Europe MEA Cosmetic Packaging Industry Revenue Share (%), by Cosmetic Type 2024 & 2032
- Figure 24: Europe MEA Cosmetic Packaging Industry Revenue (Million), by Country 2024 & 2032
- Figure 25: Europe MEA Cosmetic Packaging Industry Revenue Share (%), by Country 2024 & 2032
- Figure 26: Middle East & Africa MEA Cosmetic Packaging Industry Revenue (Million), by Material type 2024 & 2032
- Figure 27: Middle East & Africa MEA Cosmetic Packaging Industry Revenue Share (%), by Material type 2024 & 2032
- Figure 28: Middle East & Africa MEA Cosmetic Packaging Industry Revenue (Million), by Product Type 2024 & 2032
- Figure 29: Middle East & Africa MEA Cosmetic Packaging Industry Revenue Share (%), by Product Type 2024 & 2032
- Figure 30: Middle East & Africa MEA Cosmetic Packaging Industry Revenue (Million), by Cosmetic Type 2024 & 2032
- Figure 31: Middle East & Africa MEA Cosmetic Packaging Industry Revenue Share (%), by Cosmetic Type 2024 & 2032
- Figure 32: Middle East & Africa MEA Cosmetic Packaging Industry Revenue (Million), by Country 2024 & 2032
- Figure 33: Middle East & Africa MEA Cosmetic Packaging Industry Revenue Share (%), by Country 2024 & 2032
- Figure 34: Asia Pacific MEA Cosmetic Packaging Industry Revenue (Million), by Material type 2024 & 2032
- Figure 35: Asia Pacific MEA Cosmetic Packaging Industry Revenue Share (%), by Material type 2024 & 2032
- Figure 36: Asia Pacific MEA Cosmetic Packaging Industry Revenue (Million), by Product Type 2024 & 2032
- Figure 37: Asia Pacific MEA Cosmetic Packaging Industry Revenue Share (%), by Product Type 2024 & 2032
- Figure 38: Asia Pacific MEA Cosmetic Packaging Industry Revenue (Million), by Cosmetic Type 2024 & 2032
- Figure 39: Asia Pacific MEA Cosmetic Packaging Industry Revenue Share (%), by Cosmetic Type 2024 & 2032
- Figure 40: Asia Pacific MEA Cosmetic Packaging Industry Revenue (Million), by Country 2024 & 2032
- Figure 41: Asia Pacific MEA Cosmetic Packaging Industry Revenue Share (%), by Country 2024 & 2032
List of Tables
- Table 1: Global MEA Cosmetic Packaging Industry Revenue Million Forecast, by Region 2019 & 2032
- Table 2: Global MEA Cosmetic Packaging Industry Revenue Million Forecast, by Material type 2019 & 2032
- Table 3: Global MEA Cosmetic Packaging Industry Revenue Million Forecast, by Product Type 2019 & 2032
- Table 4: Global MEA Cosmetic Packaging Industry Revenue Million Forecast, by Cosmetic Type 2019 & 2032
- Table 5: Global MEA Cosmetic Packaging Industry Revenue Million Forecast, by Region 2019 & 2032
- Table 6: Global MEA Cosmetic Packaging Industry Revenue Million Forecast, by Material type 2019 & 2032
- Table 7: Global MEA Cosmetic Packaging Industry Revenue Million Forecast, by Product Type 2019 & 2032
- Table 8: Global MEA Cosmetic Packaging Industry Revenue Million Forecast, by Cosmetic Type 2019 & 2032
- Table 9: Global MEA Cosmetic Packaging Industry Revenue Million Forecast, by Country 2019 & 2032
- Table 10: United States MEA Cosmetic Packaging Industry Revenue (Million) Forecast, by Application 2019 & 2032
- Table 11: Canada MEA Cosmetic Packaging Industry Revenue (Million) Forecast, by Application 2019 & 2032
- Table 12: Mexico MEA Cosmetic Packaging Industry Revenue (Million) Forecast, by Application 2019 & 2032
- Table 13: Global MEA Cosmetic Packaging Industry Revenue Million Forecast, by Material type 2019 & 2032
- Table 14: Global MEA Cosmetic Packaging Industry Revenue Million Forecast, by Product Type 2019 & 2032
- Table 15: Global MEA Cosmetic Packaging Industry Revenue Million Forecast, by Cosmetic Type 2019 & 2032
- Table 16: Global MEA Cosmetic Packaging Industry Revenue Million Forecast, by Country 2019 & 2032
- Table 17: Brazil MEA Cosmetic Packaging Industry Revenue (Million) Forecast, by Application 2019 & 2032
- Table 18: Argentina MEA Cosmetic Packaging Industry Revenue (Million) Forecast, by Application 2019 & 2032
- Table 19: Rest of South America MEA Cosmetic Packaging Industry Revenue (Million) Forecast, by Application 2019 & 2032
- Table 20: Global MEA Cosmetic Packaging Industry Revenue Million Forecast, by Material type 2019 & 2032
- Table 21: Global MEA Cosmetic Packaging Industry Revenue Million Forecast, by Product Type 2019 & 2032
- Table 22: Global MEA Cosmetic Packaging Industry Revenue Million Forecast, by Cosmetic Type 2019 & 2032
- Table 23: Global MEA Cosmetic Packaging Industry Revenue Million Forecast, by Country 2019 & 2032
- Table 24: United Kingdom MEA Cosmetic Packaging Industry Revenue (Million) Forecast, by Application 2019 & 2032
- Table 25: Germany MEA Cosmetic Packaging Industry Revenue (Million) Forecast, by Application 2019 & 2032
- Table 26: France MEA Cosmetic Packaging Industry Revenue (Million) Forecast, by Application 2019 & 2032
- Table 27: Italy MEA Cosmetic Packaging Industry Revenue (Million) Forecast, by Application 2019 & 2032
- Table 28: Spain MEA Cosmetic Packaging Industry Revenue (Million) Forecast, by Application 2019 & 2032
- Table 29: Russia MEA Cosmetic Packaging Industry Revenue (Million) Forecast, by Application 2019 & 2032
- Table 30: Benelux MEA Cosmetic Packaging Industry Revenue (Million) Forecast, by Application 2019 & 2032
- Table 31: Nordics MEA Cosmetic Packaging Industry Revenue (Million) Forecast, by Application 2019 & 2032
- Table 32: Rest of Europe MEA Cosmetic Packaging Industry Revenue (Million) Forecast, by Application 2019 & 2032
- Table 33: Global MEA Cosmetic Packaging Industry Revenue Million Forecast, by Material type 2019 & 2032
- Table 34: Global MEA Cosmetic Packaging Industry Revenue Million Forecast, by Product Type 2019 & 2032
- Table 35: Global MEA Cosmetic Packaging Industry Revenue Million Forecast, by Cosmetic Type 2019 & 2032
- Table 36: Global MEA Cosmetic Packaging Industry Revenue Million Forecast, by Country 2019 & 2032
- Table 37: Turkey MEA Cosmetic Packaging Industry Revenue (Million) Forecast, by Application 2019 & 2032
- Table 38: Israel MEA Cosmetic Packaging Industry Revenue (Million) Forecast, by Application 2019 & 2032
- Table 39: GCC MEA Cosmetic Packaging Industry Revenue (Million) Forecast, by Application 2019 & 2032
- Table 40: North Africa MEA Cosmetic Packaging Industry Revenue (Million) Forecast, by Application 2019 & 2032
- Table 41: South Africa MEA Cosmetic Packaging Industry Revenue (Million) Forecast, by Application 2019 & 2032
- Table 42: Rest of Middle East & Africa MEA Cosmetic Packaging Industry Revenue (Million) Forecast, by Application 2019 & 2032
- Table 43: Global MEA Cosmetic Packaging Industry Revenue Million Forecast, by Material type 2019 & 2032
- Table 44: Global MEA Cosmetic Packaging Industry Revenue Million Forecast, by Product Type 2019 & 2032
- Table 45: Global MEA Cosmetic Packaging Industry Revenue Million Forecast, by Cosmetic Type 2019 & 2032
- Table 46: Global MEA Cosmetic Packaging Industry Revenue Million Forecast, by Country 2019 & 2032
- Table 47: China MEA Cosmetic Packaging Industry Revenue (Million) Forecast, by Application 2019 & 2032
- Table 48: India MEA Cosmetic Packaging Industry Revenue (Million) Forecast, by Application 2019 & 2032
- Table 49: Japan MEA Cosmetic Packaging Industry Revenue (Million) Forecast, by Application 2019 & 2032
- Table 50: South Korea MEA Cosmetic Packaging Industry Revenue (Million) Forecast, by Application 2019 & 2032
- Table 51: ASEAN MEA Cosmetic Packaging Industry Revenue (Million) Forecast, by Application 2019 & 2032
- Table 52: Oceania MEA Cosmetic Packaging Industry Revenue (Million) Forecast, by Application 2019 & 2032
- Table 53: Rest of Asia Pacific MEA Cosmetic Packaging Industry Revenue (Million) Forecast, by Application 2019 & 2032
Frequently Asked Questions
1. What is the projected Compound Annual Growth Rate (CAGR) of the MEA Cosmetic Packaging Industry?
The projected CAGR is approximately 4.60%.
2. Which companies are prominent players in the MEA Cosmetic Packaging Industry?
Key companies in the market include Graham Packaging L P, Rieke Corp, Raepak Ltd *List Not Exhaustive, AptarGroup Inc, DS Smith PLC, Amcor PLC, Cosmopak Ltd, Albea SA, RPC Group PLC (Berry Global Group), Silgan Holdings Inc, Gerresheimer AG.
3. What are the main segments of the MEA Cosmetic Packaging Industry?
The market segments include Material type, Product Type, Cosmetic Type.
4. Can you provide details about the market size?
The market size is estimated to be USD XX Million as of 2022.
5. What are some drivers contributing to market growth?
; Increasing Focus on Innovation and Attractive Packaging.
6. What are the notable trends driving market growth?
Sustainable Packaging to Drive the Market Growth.
7. Are there any restraints impacting market growth?
; Growing Sustainability Concerns.
8. Can you provide examples of recent developments in the market?
N/A
9. What pricing options are available for accessing the report?
Pricing options include single-user, multi-user, and enterprise licenses priced at USD 3800, USD 4500, and USD 5800 respectively.
10. Is the market size provided in terms of value or volume?
The market size is provided in terms of value, measured in Million.
11. Are there any specific market keywords associated with the report?
Yes, the market keyword associated with the report is "MEA Cosmetic Packaging Industry," which aids in identifying and referencing the specific market segment covered.
12. How do I determine which pricing option suits my needs best?
The pricing options vary based on user requirements and access needs. Individual users may opt for single-user licenses, while businesses requiring broader access may choose multi-user or enterprise licenses for cost-effective access to the report.
13. Are there any additional resources or data provided in the MEA Cosmetic Packaging Industry report?
While the report offers comprehensive insights, it's advisable to review the specific contents or supplementary materials provided to ascertain if additional resources or data are available.
14. How can I stay updated on further developments or reports in the MEA Cosmetic Packaging Industry?
To stay informed about further developments, trends, and reports in the MEA Cosmetic Packaging Industry, consider subscribing to industry newsletters, following relevant companies and organizations, or regularly checking reputable industry news sources and publications.
Methodology
Step 1 - Identification of Relevant Samples Size from Population Database


Step 2 - Approaches for Defining Global Market Size (Value, Volume* & Price*)

Note*: In applicable scenarios
Step 3 - Data Sources
Primary Research
- Web Analytics
- Survey Reports
- Research Institute
- Latest Research Reports
- Opinion Leaders
Secondary Research
- Annual Reports
- White Paper
- Latest Press Release
- Industry Association
- Paid Database
- Investor Presentations

Step 4 - Data Triangulation
Involves using different sources of information in order to increase the validity of a study
These sources are likely to be stakeholders in a program - participants, other researchers, program staff, other community members, and so on.
Then we put all data in single framework & apply various statistical tools to find out the dynamic on the market.
During the analysis stage, feedback from the stakeholder groups would be compared to determine areas of agreement as well as areas of divergence


