

Key Insights
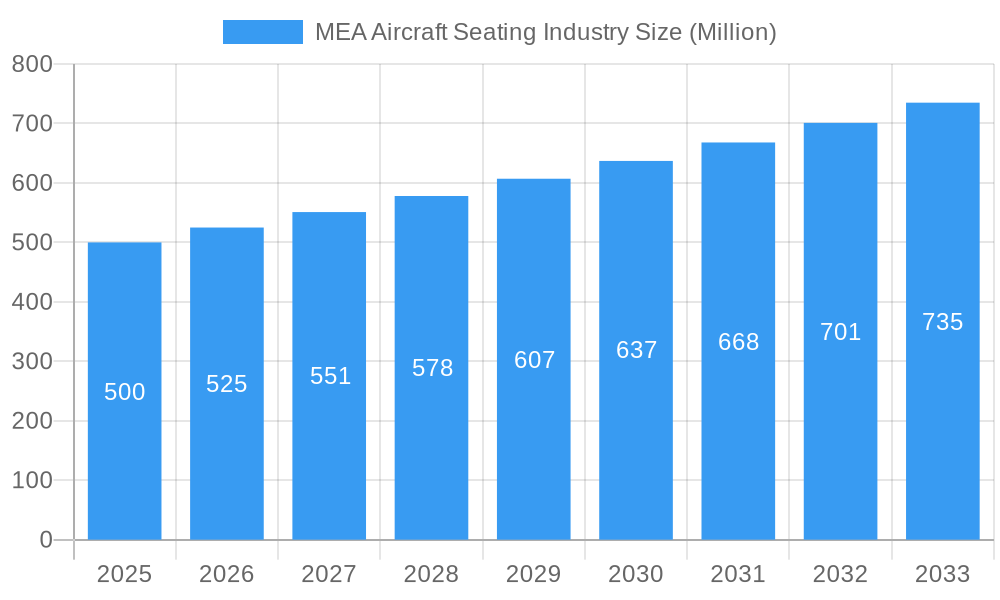
The Middle East and Africa (MEA) aircraft seating market is poised for significant expansion, propelled by robust air travel demand and substantial airline fleet growth. This market, valued at $9.44 billion in the base year of 2025, is projected to grow at a Compound Annual Growth Rate (CAGR) of 4.85% through 2033. Key growth drivers include increasing passenger numbers driven by regional tourism and rising disposable incomes, fueling aircraft orders. The growing demand for premium travel experiences is also boosting the market for Business and First Class seating. Furthermore, fleet modernization efforts requiring retrofitting and the delivery of new wide-body and narrow-body aircraft contribute significantly to demand for both line-fit and retrofit installations. The market is segmented by aircraft type (wide-body, narrow-body, regional), fitment (line-fit, retrofit), and seat type (economy, premium economy, business, first class). Aviation hubs in the United Arab Emirates and Saudi Arabia are expected to lead market share within the MEA region.
MEA Aircraft Seating Industry Market Size (In Billion)
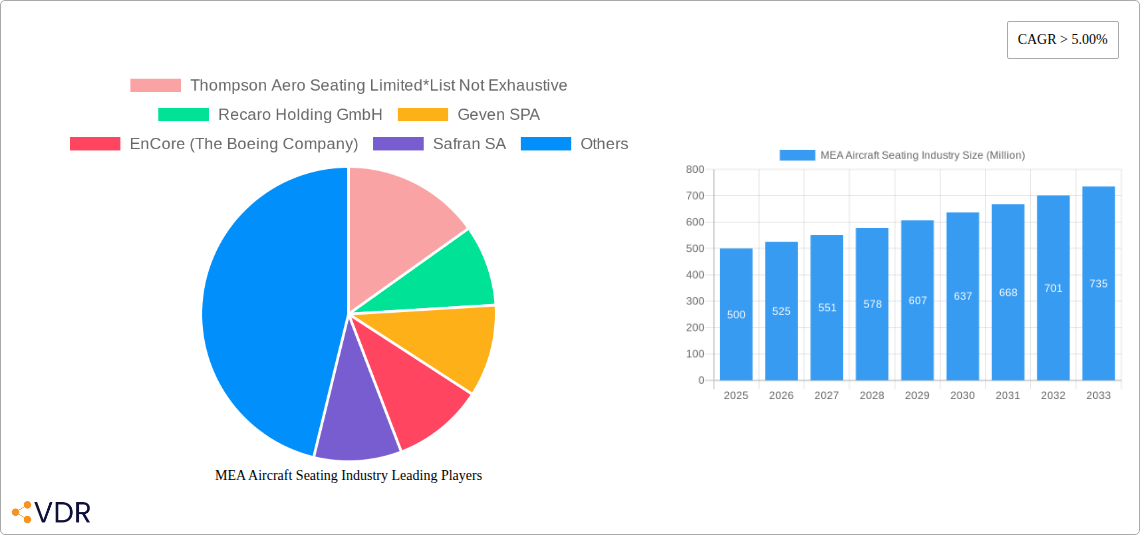
The MEA aircraft seating market features intense competition among global and regional manufacturers. Key players include Thompson Aero Seating, Recaro Holding, Geven, EnCore (Boeing), Safran, HAECO, Acro Aircraft Seating, Collins Aerospace, Jamco, STELIA Aerospace, and Aviointeriors. Companies are focusing on innovation, technological advancements, and customer service to enhance their competitive positions. Future market dynamics will be influenced by regional economic stability, fuel prices, geopolitical events, and advancements in seating design and manufacturing. Consolidation through mergers and acquisitions is probable, alongside a continued emphasis on sustainability and lightweight materials in aircraft seating development for the MEA region.
MEA Aircraft Seating Industry Company Market Share
MEA Aircraft Seating Industry: A Comprehensive Market Report (2019-2033)
This in-depth report provides a comprehensive analysis of the Middle East and Africa (MEA) aircraft seating industry, covering market dynamics, growth trends, key players, and future outlook. The study period spans from 2019 to 2033, with 2025 serving as the base and estimated year. This report is crucial for industry professionals, investors, and stakeholders seeking to understand and capitalize on opportunities within this dynamic market. The report segments the market by aircraft type (wide-body, narrow-body, regional), fitment (line-fit, retrofit), and seat class (economy & premium economy, business, first class). The total market size is projected to reach xx Million units by 2033.
MEA Aircraft Seating Industry Market Dynamics & Structure
This section analyzes the MEA aircraft seating market's competitive landscape, technological advancements, regulatory environment, and market trends. The market exhibits a moderately concentrated structure, with key players holding significant market share. However, the presence of several smaller, specialized companies fosters competition and innovation.
- Market Concentration: The top 5 players account for approximately xx% of the market share in 2025.
- Technological Innovation: Lightweight materials, improved ergonomics, and in-seat entertainment systems are driving innovation. Barriers to entry include high R&D costs and stringent certification requirements.
- Regulatory Framework: Compliance with safety and environmental regulations is paramount, influencing product design and manufacturing processes.
- Competitive Substitutes: The primary substitutes are older generation seats and limited options for retrofitting. This presents both challenges and opportunities for innovation.
- End-User Demographics: The growth is driven primarily by the increasing demand from budget airlines expanding their fleets and full-service carriers upgrading cabins for enhanced passenger experience.
- M&A Trends: The MEA region has witnessed xx M&A deals in the aircraft seating sector between 2019 and 2024, primarily focused on expanding market reach and acquiring specialized technologies. The average deal size was approximately xx Million USD.
MEA Aircraft Seating Industry Growth Trends & Insights
The MEA aircraft seating market is experiencing robust growth, fueled by rising air passenger traffic and airline fleet expansions. The historical period (2019-2024) saw a CAGR of xx%, driven by factors such as increasing disposable incomes, tourism growth, and government initiatives to improve air connectivity across the region. The forecast period (2025-2033) projects a CAGR of xx%, indicating sustained growth momentum. Technological advancements such as advanced materials and personalized seating options are driving market adoption. Shifting consumer preferences towards enhanced comfort and entertainment are influencing demand patterns. Market penetration for advanced features like in-seat power and connectivity is expected to increase significantly by 2033.
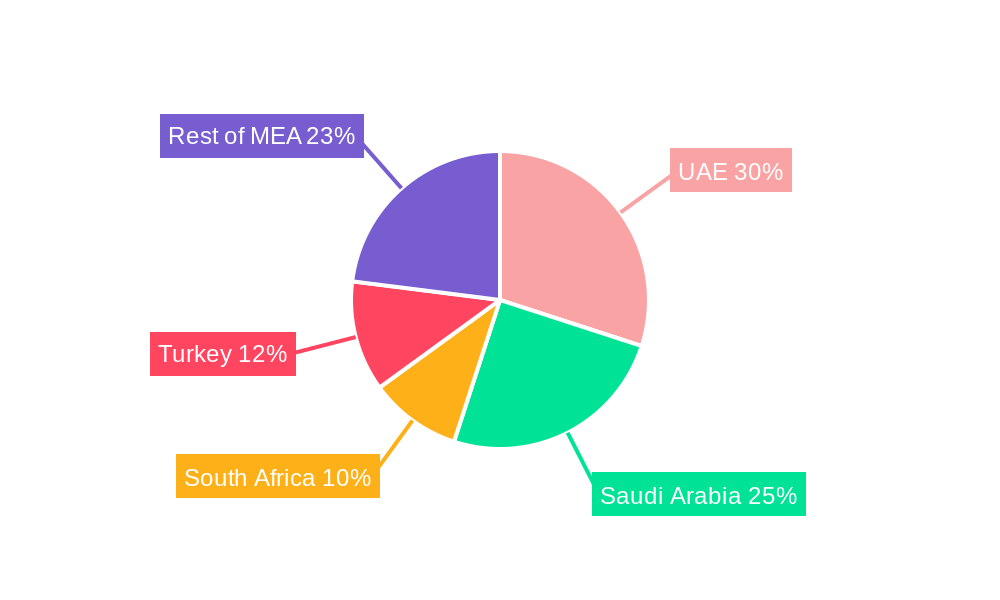
Dominant Regions, Countries, or Segments in MEA Aircraft Seating Industry
The UAE and Saudi Arabia are the leading markets in the MEA region, driven by strong economic growth, substantial investments in aviation infrastructure, and the presence of major airlines. Narrow-body aircraft account for the largest segment, owing to its prevalence in the region's airline fleets. Line-fit installations represent a larger share than retrofit, reflecting the trend of new aircraft deliveries. The economy and premium economy class segment holds the largest market share, reflecting price-sensitivity and overall higher demand within the market.
- Key Drivers:
- Growing passenger traffic
- Increasing airline fleet modernization
- Government investments in aviation infrastructure
- Expansion of budget airlines
- Dominance Factors:
- Strong air travel demand
- Hub airport development
- Favorable economic conditions
MEA Aircraft Seating Industry Product Landscape
The MEA aircraft seating market features a diverse range of products catering to varying aircraft types and passenger preferences. Innovations include lighter-weight designs, enhanced ergonomics, improved safety features, and advanced in-seat entertainment systems. Key selling propositions focus on comfort, durability, and sustainability, appealing to both airlines and passengers. Technological advancements such as the integration of advanced materials (e.g., composites) and the use of smart technologies are enhancing product performance and passenger experience.
Key Drivers, Barriers & Challenges in MEA Aircraft Seating Industry
Key Drivers:
- Rising air passenger traffic and fleet expansion
- Government investments in aviation infrastructure
- Technological advancements in seat design and manufacturing
- Growing demand for enhanced passenger comfort
Challenges:
- Supply chain disruptions
- Fluctuations in oil prices
- Stringent safety and environmental regulations
- Intense competition
Emerging Opportunities in MEA Aircraft Seating Industry
- Growing demand for premium economy and business class seating
- Increasing adoption of advanced in-seat entertainment systems
- Expansion of low-cost carriers
- Rise of regional airlines
Growth Accelerators in the MEA Aircraft Seating Industry Industry
Technological advancements like lighter, more sustainable materials, and improved cabin designs are key growth catalysts. Strategic partnerships between seating manufacturers and airlines will further accelerate growth by enhancing product customization and supply chain efficiency. Government initiatives to support the aviation sector, including infrastructure development and fleet modernization programs, will also play a crucial role in driving the long-term growth of the MEA aircraft seating market.
Key Players Shaping the MEA Aircraft Seating Industry Market
- Thompson Aero Seating Limited
- Recaro Holding GmbH
- Geven SPA
- EnCore (The Boeing Company)
- Safran SA
- Hong Kong Aircraft Engineering Company Limited (HAECO)
- Acro Aircraft Seating
- Collins Aerospace (Raytheon Technologies Corporation)
- Jamco Corp
- STELIA Aerospace (Airbus SE)
- Aviointeriors SPA
Notable Milestones in MEA Aircraft Seating Industry Sector
- September 2021: Saudi Arabian Airlines (Saudia) unveiled new next-generation aircraft seats for its Airbus A321XLR deliveries.
- January 2021: Recaro Aircraft Seating revealed a luxury seat for Emirates' first premium economy cabin.
In-Depth MEA Aircraft Seating Industry Market Outlook
The MEA aircraft seating market is poised for significant growth in the coming years, driven by ongoing fleet expansion, technological innovations, and increasing passenger demand for enhanced comfort and in-flight experiences. Strategic partnerships, investment in R&D, and focus on sustainability will be key success factors for companies operating in this market. The market presents significant opportunities for players who can effectively cater to the unique needs of the MEA region's airlines and passengers.
MEA Aircraft Seating Industry Segmentation
- 1. Production Analysis
- 2. Consumption Analysis
- 3. Import Market Analysis (Value & Volume)
- 4. Export Market Analysis (Value & Volume)
- 5. Price Trend Analysis
MEA Aircraft Seating Industry Segmentation By Geography
-
1. North America
- 1.1. United States
- 1.2. Canada
- 1.3. Mexico
-
2. South America
- 2.1. Brazil
- 2.2. Argentina
- 2.3. Rest of South America
-
3. Europe
- 3.1. United Kingdom
- 3.2. Germany
- 3.3. France
- 3.4. Italy
- 3.5. Spain
- 3.6. Russia
- 3.7. Benelux
- 3.8. Nordics
- 3.9. Rest of Europe
-
4. Middle East & Africa
- 4.1. Turkey
- 4.2. Israel
- 4.3. GCC
- 4.4. North Africa
- 4.5. South Africa
- 4.6. Rest of Middle East & Africa
-
5. Asia Pacific
- 5.1. China
- 5.2. India
- 5.3. Japan
- 5.4. South Korea
- 5.5. ASEAN
- 5.6. Oceania
- 5.7. Rest of Asia Pacific
MEA Aircraft Seating Industry Regional Market Share
Geographic Coverage of MEA Aircraft Seating Industry
MEA Aircraft Seating Industry REPORT HIGHLIGHTS
| Aspects | Details |
|---|---|
| Study Period | 2020-2034 |
| Base Year | 2025 |
| Estimated Year | 2026 |
| Forecast Period | 2026-2034 |
| Historical Period | 2020-2025 |
| Growth Rate | CAGR of 4.85% from 2020-2034 |
| Segmentation |
|
Table of Contents
- 1. Introduction
- 1.1. Research Scope
- 1.2. Market Segmentation
- 1.3. Research Objective
- 1.4. Definitions and Assumptions
- 2. Executive Summary
- 2.1. Market Snapshot
- 3. Market Dynamics
- 3.1. Market Drivers
- 3.2. Market Restrains
- 3.3. Market Trends
- 3.4. Market Opportunities
- 4. Market Factor Analysis
- 4.1. Porters Five Forces
- 4.1.1. Bargaining Power of Suppliers
- 4.1.2. Bargaining Power of Buyers
- 4.1.3. Threat of New Entrants
- 4.1.4. Threat of Substitutes
- 4.1.5. Competitive Rivalry
- 4.2. PESTEL analysis
- 4.3. BCG Analysis
- 4.3.1. Stars (High Growth, High Market Share)
- 4.3.2. Cash Cows (Low Growth, High Market Share)
- 4.3.3. Question Mark (High Growth, Low Market Share)
- 4.3.4. Dogs (Low Growth, Low Market Share)
- 4.4. Ansoff Matrix Analysis
- 4.5. Supply Chain Analysis
- 4.6. Regulatory Landscape
- 4.7. Current Market Potential and Opportunity Assessment (TAM–SAM–SOM Framework)
- 4.8. VDR Analyst Note
- 4.1. Porters Five Forces
- 5. Market Analysis, Insights and Forecast 2021-2033
- 5.1. Market Analysis, Insights and Forecast - by Production Analysis
- 5.2. Market Analysis, Insights and Forecast - by Consumption Analysis
- 5.3. Market Analysis, Insights and Forecast - by Import Market Analysis (Value & Volume)
- 5.4. Market Analysis, Insights and Forecast - by Export Market Analysis (Value & Volume)
- 5.5. Market Analysis, Insights and Forecast - by Price Trend Analysis
- 5.6. Market Analysis, Insights and Forecast - by Region
- 5.6.1. North America
- 5.6.2. South America
- 5.6.3. Europe
- 5.6.4. Middle East & Africa
- 5.6.5. Asia Pacific
- 6. Global MEA Aircraft Seating Industry Analysis, Insights and Forecast, 2021-2033
- 6.1. Market Analysis, Insights and Forecast - by Production Analysis
- 6.2. Market Analysis, Insights and Forecast - by Consumption Analysis
- 6.3. Market Analysis, Insights and Forecast - by Import Market Analysis (Value & Volume)
- 6.4. Market Analysis, Insights and Forecast - by Export Market Analysis (Value & Volume)
- 6.5. Market Analysis, Insights and Forecast - by Price Trend Analysis
- 7. North America MEA Aircraft Seating Industry Analysis, Insights and Forecast, 2021-2033
- 7.1. Market Analysis, Insights and Forecast - by Production Analysis
- 7.2. Market Analysis, Insights and Forecast - by Consumption Analysis
- 7.3. Market Analysis, Insights and Forecast - by Import Market Analysis (Value & Volume)
- 7.4. Market Analysis, Insights and Forecast - by Export Market Analysis (Value & Volume)
- 7.5. Market Analysis, Insights and Forecast - by Price Trend Analysis
- 8. South America MEA Aircraft Seating Industry Analysis, Insights and Forecast, 2021-2033
- 8.1. Market Analysis, Insights and Forecast - by Production Analysis
- 8.2. Market Analysis, Insights and Forecast - by Consumption Analysis
- 8.3. Market Analysis, Insights and Forecast - by Import Market Analysis (Value & Volume)
- 8.4. Market Analysis, Insights and Forecast - by Export Market Analysis (Value & Volume)
- 8.5. Market Analysis, Insights and Forecast - by Price Trend Analysis
- 9. Europe MEA Aircraft Seating Industry Analysis, Insights and Forecast, 2021-2033
- 9.1. Market Analysis, Insights and Forecast - by Production Analysis
- 9.2. Market Analysis, Insights and Forecast - by Consumption Analysis
- 9.3. Market Analysis, Insights and Forecast - by Import Market Analysis (Value & Volume)
- 9.4. Market Analysis, Insights and Forecast - by Export Market Analysis (Value & Volume)
- 9.5. Market Analysis, Insights and Forecast - by Price Trend Analysis
- 10. Middle East & Africa MEA Aircraft Seating Industry Analysis, Insights and Forecast, 2021-2033
- 10.1. Market Analysis, Insights and Forecast - by Production Analysis
- 10.2. Market Analysis, Insights and Forecast - by Consumption Analysis
- 10.3. Market Analysis, Insights and Forecast - by Import Market Analysis (Value & Volume)
- 10.4. Market Analysis, Insights and Forecast - by Export Market Analysis (Value & Volume)
- 10.5. Market Analysis, Insights and Forecast - by Price Trend Analysis
- 11. Asia Pacific MEA Aircraft Seating Industry Analysis, Insights and Forecast, 2021-2033
- 11.1. Market Analysis, Insights and Forecast - by Production Analysis
- 11.2. Market Analysis, Insights and Forecast - by Consumption Analysis
- 11.3. Market Analysis, Insights and Forecast - by Import Market Analysis (Value & Volume)
- 11.4. Market Analysis, Insights and Forecast - by Export Market Analysis (Value & Volume)
- 11.5. Market Analysis, Insights and Forecast - by Price Trend Analysis
- 12. Competitive Analysis
- 12.1. Company Profiles
- 12.1.1 Thompson Aero Seating Limited*List Not Exhaustive
- 12.1.1.1. Company Overview
- 12.1.1.2. Products
- 12.1.1.3. Company Financials
- 12.1.1.4. SWOT Analysis
- 12.1.2 Recaro Holding GmbH
- 12.1.2.1. Company Overview
- 12.1.2.2. Products
- 12.1.2.3. Company Financials
- 12.1.2.4. SWOT Analysis
- 12.1.3 Geven SPA
- 12.1.3.1. Company Overview
- 12.1.3.2. Products
- 12.1.3.3. Company Financials
- 12.1.3.4. SWOT Analysis
- 12.1.4 EnCore (The Boeing Company)
- 12.1.4.1. Company Overview
- 12.1.4.2. Products
- 12.1.4.3. Company Financials
- 12.1.4.4. SWOT Analysis
- 12.1.5 Safran SA
- 12.1.5.1. Company Overview
- 12.1.5.2. Products
- 12.1.5.3. Company Financials
- 12.1.5.4. SWOT Analysis
- 12.1.6 Hong Kong Aircraft Engineering Company Limited (HAECO)
- 12.1.6.1. Company Overview
- 12.1.6.2. Products
- 12.1.6.3. Company Financials
- 12.1.6.4. SWOT Analysis
- 12.1.7 Acro Aircraft Seating
- 12.1.7.1. Company Overview
- 12.1.7.2. Products
- 12.1.7.3. Company Financials
- 12.1.7.4. SWOT Analysis
- 12.1.8 Collins Aerospace (Raytheon Technologies Corporation)
- 12.1.8.1. Company Overview
- 12.1.8.2. Products
- 12.1.8.3. Company Financials
- 12.1.8.4. SWOT Analysis
- 12.1.9 Jamco Corp
- 12.1.9.1. Company Overview
- 12.1.9.2. Products
- 12.1.9.3. Company Financials
- 12.1.9.4. SWOT Analysis
- 12.1.10 STELIA Aerospace (Airbus SE)
- 12.1.10.1. Company Overview
- 12.1.10.2. Products
- 12.1.10.3. Company Financials
- 12.1.10.4. SWOT Analysis
- 12.1.11 Aviointeriors SPA
- 12.1.11.1. Company Overview
- 12.1.11.2. Products
- 12.1.11.3. Company Financials
- 12.1.11.4. SWOT Analysis
- 12.1.1 Thompson Aero Seating Limited*List Not Exhaustive
- 12.2. Market Entropy
- 12.2.1 Company's Key Areas Served
- 12.2.2 Recent Developments
- 12.3. Company Market Share Analysis 2025
- 12.3.1 Top 5 Companies Market Share Analysis
- 12.3.2 Top 3 Companies Market Share Analysis
- 12.4. List of Potential Customers
- 13. Research Methodology
List of Figures
- Figure 1: Global MEA Aircraft Seating Industry Revenue Breakdown (billion, %) by Region 2025 & 2033
- Figure 2: North America MEA Aircraft Seating Industry Revenue (billion), by Production Analysis 2025 & 2033
- Figure 3: North America MEA Aircraft Seating Industry Revenue Share (%), by Production Analysis 2025 & 2033
- Figure 4: North America MEA Aircraft Seating Industry Revenue (billion), by Consumption Analysis 2025 & 2033
- Figure 5: North America MEA Aircraft Seating Industry Revenue Share (%), by Consumption Analysis 2025 & 2033
- Figure 6: North America MEA Aircraft Seating Industry Revenue (billion), by Import Market Analysis (Value & Volume) 2025 & 2033
- Figure 7: North America MEA Aircraft Seating Industry Revenue Share (%), by Import Market Analysis (Value & Volume) 2025 & 2033
- Figure 8: North America MEA Aircraft Seating Industry Revenue (billion), by Export Market Analysis (Value & Volume) 2025 & 2033
- Figure 9: North America MEA Aircraft Seating Industry Revenue Share (%), by Export Market Analysis (Value & Volume) 2025 & 2033
- Figure 10: North America MEA Aircraft Seating Industry Revenue (billion), by Price Trend Analysis 2025 & 2033
- Figure 11: North America MEA Aircraft Seating Industry Revenue Share (%), by Price Trend Analysis 2025 & 2033
- Figure 12: North America MEA Aircraft Seating Industry Revenue (billion), by Country 2025 & 2033
- Figure 13: North America MEA Aircraft Seating Industry Revenue Share (%), by Country 2025 & 2033
- Figure 14: South America MEA Aircraft Seating Industry Revenue (billion), by Production Analysis 2025 & 2033
- Figure 15: South America MEA Aircraft Seating Industry Revenue Share (%), by Production Analysis 2025 & 2033
- Figure 16: South America MEA Aircraft Seating Industry Revenue (billion), by Consumption Analysis 2025 & 2033
- Figure 17: South America MEA Aircraft Seating Industry Revenue Share (%), by Consumption Analysis 2025 & 2033
- Figure 18: South America MEA Aircraft Seating Industry Revenue (billion), by Import Market Analysis (Value & Volume) 2025 & 2033
- Figure 19: South America MEA Aircraft Seating Industry Revenue Share (%), by Import Market Analysis (Value & Volume) 2025 & 2033
- Figure 20: South America MEA Aircraft Seating Industry Revenue (billion), by Export Market Analysis (Value & Volume) 2025 & 2033
- Figure 21: South America MEA Aircraft Seating Industry Revenue Share (%), by Export Market Analysis (Value & Volume) 2025 & 2033
- Figure 22: South America MEA Aircraft Seating Industry Revenue (billion), by Price Trend Analysis 2025 & 2033
- Figure 23: South America MEA Aircraft Seating Industry Revenue Share (%), by Price Trend Analysis 2025 & 2033
- Figure 24: South America MEA Aircraft Seating Industry Revenue (billion), by Country 2025 & 2033
- Figure 25: South America MEA Aircraft Seating Industry Revenue Share (%), by Country 2025 & 2033
- Figure 26: Europe MEA Aircraft Seating Industry Revenue (billion), by Production Analysis 2025 & 2033
- Figure 27: Europe MEA Aircraft Seating Industry Revenue Share (%), by Production Analysis 2025 & 2033
- Figure 28: Europe MEA Aircraft Seating Industry Revenue (billion), by Consumption Analysis 2025 & 2033
- Figure 29: Europe MEA Aircraft Seating Industry Revenue Share (%), by Consumption Analysis 2025 & 2033
- Figure 30: Europe MEA Aircraft Seating Industry Revenue (billion), by Import Market Analysis (Value & Volume) 2025 & 2033
- Figure 31: Europe MEA Aircraft Seating Industry Revenue Share (%), by Import Market Analysis (Value & Volume) 2025 & 2033
- Figure 32: Europe MEA Aircraft Seating Industry Revenue (billion), by Export Market Analysis (Value & Volume) 2025 & 2033
- Figure 33: Europe MEA Aircraft Seating Industry Revenue Share (%), by Export Market Analysis (Value & Volume) 2025 & 2033
- Figure 34: Europe MEA Aircraft Seating Industry Revenue (billion), by Price Trend Analysis 2025 & 2033
- Figure 35: Europe MEA Aircraft Seating Industry Revenue Share (%), by Price Trend Analysis 2025 & 2033
- Figure 36: Europe MEA Aircraft Seating Industry Revenue (billion), by Country 2025 & 2033
- Figure 37: Europe MEA Aircraft Seating Industry Revenue Share (%), by Country 2025 & 2033
- Figure 38: Middle East & Africa MEA Aircraft Seating Industry Revenue (billion), by Production Analysis 2025 & 2033
- Figure 39: Middle East & Africa MEA Aircraft Seating Industry Revenue Share (%), by Production Analysis 2025 & 2033
- Figure 40: Middle East & Africa MEA Aircraft Seating Industry Revenue (billion), by Consumption Analysis 2025 & 2033
- Figure 41: Middle East & Africa MEA Aircraft Seating Industry Revenue Share (%), by Consumption Analysis 2025 & 2033
- Figure 42: Middle East & Africa MEA Aircraft Seating Industry Revenue (billion), by Import Market Analysis (Value & Volume) 2025 & 2033
- Figure 43: Middle East & Africa MEA Aircraft Seating Industry Revenue Share (%), by Import Market Analysis (Value & Volume) 2025 & 2033
- Figure 44: Middle East & Africa MEA Aircraft Seating Industry Revenue (billion), by Export Market Analysis (Value & Volume) 2025 & 2033
- Figure 45: Middle East & Africa MEA Aircraft Seating Industry Revenue Share (%), by Export Market Analysis (Value & Volume) 2025 & 2033
- Figure 46: Middle East & Africa MEA Aircraft Seating Industry Revenue (billion), by Price Trend Analysis 2025 & 2033
- Figure 47: Middle East & Africa MEA Aircraft Seating Industry Revenue Share (%), by Price Trend Analysis 2025 & 2033
- Figure 48: Middle East & Africa MEA Aircraft Seating Industry Revenue (billion), by Country 2025 & 2033
- Figure 49: Middle East & Africa MEA Aircraft Seating Industry Revenue Share (%), by Country 2025 & 2033
- Figure 50: Asia Pacific MEA Aircraft Seating Industry Revenue (billion), by Production Analysis 2025 & 2033
- Figure 51: Asia Pacific MEA Aircraft Seating Industry Revenue Share (%), by Production Analysis 2025 & 2033
- Figure 52: Asia Pacific MEA Aircraft Seating Industry Revenue (billion), by Consumption Analysis 2025 & 2033
- Figure 53: Asia Pacific MEA Aircraft Seating Industry Revenue Share (%), by Consumption Analysis 2025 & 2033
- Figure 54: Asia Pacific MEA Aircraft Seating Industry Revenue (billion), by Import Market Analysis (Value & Volume) 2025 & 2033
- Figure 55: Asia Pacific MEA Aircraft Seating Industry Revenue Share (%), by Import Market Analysis (Value & Volume) 2025 & 2033
- Figure 56: Asia Pacific MEA Aircraft Seating Industry Revenue (billion), by Export Market Analysis (Value & Volume) 2025 & 2033
- Figure 57: Asia Pacific MEA Aircraft Seating Industry Revenue Share (%), by Export Market Analysis (Value & Volume) 2025 & 2033
- Figure 58: Asia Pacific MEA Aircraft Seating Industry Revenue (billion), by Price Trend Analysis 2025 & 2033
- Figure 59: Asia Pacific MEA Aircraft Seating Industry Revenue Share (%), by Price Trend Analysis 2025 & 2033
- Figure 60: Asia Pacific MEA Aircraft Seating Industry Revenue (billion), by Country 2025 & 2033
- Figure 61: Asia Pacific MEA Aircraft Seating Industry Revenue Share (%), by Country 2025 & 2033
List of Tables
- Table 1: Global MEA Aircraft Seating Industry Revenue billion Forecast, by Production Analysis 2020 & 2033
- Table 2: Global MEA Aircraft Seating Industry Revenue billion Forecast, by Consumption Analysis 2020 & 2033
- Table 3: Global MEA Aircraft Seating Industry Revenue billion Forecast, by Import Market Analysis (Value & Volume) 2020 & 2033
- Table 4: Global MEA Aircraft Seating Industry Revenue billion Forecast, by Export Market Analysis (Value & Volume) 2020 & 2033
- Table 5: Global MEA Aircraft Seating Industry Revenue billion Forecast, by Price Trend Analysis 2020 & 2033
- Table 6: Global MEA Aircraft Seating Industry Revenue billion Forecast, by Region 2020 & 2033
- Table 7: Global MEA Aircraft Seating Industry Revenue billion Forecast, by Production Analysis 2020 & 2033
- Table 8: Global MEA Aircraft Seating Industry Revenue billion Forecast, by Consumption Analysis 2020 & 2033
- Table 9: Global MEA Aircraft Seating Industry Revenue billion Forecast, by Import Market Analysis (Value & Volume) 2020 & 2033
- Table 10: Global MEA Aircraft Seating Industry Revenue billion Forecast, by Export Market Analysis (Value & Volume) 2020 & 2033
- Table 11: Global MEA Aircraft Seating Industry Revenue billion Forecast, by Price Trend Analysis 2020 & 2033
- Table 12: Global MEA Aircraft Seating Industry Revenue billion Forecast, by Country 2020 & 2033
- Table 13: United States MEA Aircraft Seating Industry Revenue (billion) Forecast, by Application 2020 & 2033
- Table 14: Canada MEA Aircraft Seating Industry Revenue (billion) Forecast, by Application 2020 & 2033
- Table 15: Mexico MEA Aircraft Seating Industry Revenue (billion) Forecast, by Application 2020 & 2033
- Table 16: Global MEA Aircraft Seating Industry Revenue billion Forecast, by Production Analysis 2020 & 2033
- Table 17: Global MEA Aircraft Seating Industry Revenue billion Forecast, by Consumption Analysis 2020 & 2033
- Table 18: Global MEA Aircraft Seating Industry Revenue billion Forecast, by Import Market Analysis (Value & Volume) 2020 & 2033
- Table 19: Global MEA Aircraft Seating Industry Revenue billion Forecast, by Export Market Analysis (Value & Volume) 2020 & 2033
- Table 20: Global MEA Aircraft Seating Industry Revenue billion Forecast, by Price Trend Analysis 2020 & 2033
- Table 21: Global MEA Aircraft Seating Industry Revenue billion Forecast, by Country 2020 & 2033
- Table 22: Brazil MEA Aircraft Seating Industry Revenue (billion) Forecast, by Application 2020 & 2033
- Table 23: Argentina MEA Aircraft Seating Industry Revenue (billion) Forecast, by Application 2020 & 2033
- Table 24: Rest of South America MEA Aircraft Seating Industry Revenue (billion) Forecast, by Application 2020 & 2033
- Table 25: Global MEA Aircraft Seating Industry Revenue billion Forecast, by Production Analysis 2020 & 2033
- Table 26: Global MEA Aircraft Seating Industry Revenue billion Forecast, by Consumption Analysis 2020 & 2033
- Table 27: Global MEA Aircraft Seating Industry Revenue billion Forecast, by Import Market Analysis (Value & Volume) 2020 & 2033
- Table 28: Global MEA Aircraft Seating Industry Revenue billion Forecast, by Export Market Analysis (Value & Volume) 2020 & 2033
- Table 29: Global MEA Aircraft Seating Industry Revenue billion Forecast, by Price Trend Analysis 2020 & 2033
- Table 30: Global MEA Aircraft Seating Industry Revenue billion Forecast, by Country 2020 & 2033
- Table 31: United Kingdom MEA Aircraft Seating Industry Revenue (billion) Forecast, by Application 2020 & 2033
- Table 32: Germany MEA Aircraft Seating Industry Revenue (billion) Forecast, by Application 2020 & 2033
- Table 33: France MEA Aircraft Seating Industry Revenue (billion) Forecast, by Application 2020 & 2033
- Table 34: Italy MEA Aircraft Seating Industry Revenue (billion) Forecast, by Application 2020 & 2033
- Table 35: Spain MEA Aircraft Seating Industry Revenue (billion) Forecast, by Application 2020 & 2033
- Table 36: Russia MEA Aircraft Seating Industry Revenue (billion) Forecast, by Application 2020 & 2033
- Table 37: Benelux MEA Aircraft Seating Industry Revenue (billion) Forecast, by Application 2020 & 2033
- Table 38: Nordics MEA Aircraft Seating Industry Revenue (billion) Forecast, by Application 2020 & 2033
- Table 39: Rest of Europe MEA Aircraft Seating Industry Revenue (billion) Forecast, by Application 2020 & 2033
- Table 40: Global MEA Aircraft Seating Industry Revenue billion Forecast, by Production Analysis 2020 & 2033
- Table 41: Global MEA Aircraft Seating Industry Revenue billion Forecast, by Consumption Analysis 2020 & 2033
- Table 42: Global MEA Aircraft Seating Industry Revenue billion Forecast, by Import Market Analysis (Value & Volume) 2020 & 2033
- Table 43: Global MEA Aircraft Seating Industry Revenue billion Forecast, by Export Market Analysis (Value & Volume) 2020 & 2033
- Table 44: Global MEA Aircraft Seating Industry Revenue billion Forecast, by Price Trend Analysis 2020 & 2033
- Table 45: Global MEA Aircraft Seating Industry Revenue billion Forecast, by Country 2020 & 2033
- Table 46: Turkey MEA Aircraft Seating Industry Revenue (billion) Forecast, by Application 2020 & 2033
- Table 47: Israel MEA Aircraft Seating Industry Revenue (billion) Forecast, by Application 2020 & 2033
- Table 48: GCC MEA Aircraft Seating Industry Revenue (billion) Forecast, by Application 2020 & 2033
- Table 49: North Africa MEA Aircraft Seating Industry Revenue (billion) Forecast, by Application 2020 & 2033
- Table 50: South Africa MEA Aircraft Seating Industry Revenue (billion) Forecast, by Application 2020 & 2033
- Table 51: Rest of Middle East & Africa MEA Aircraft Seating Industry Revenue (billion) Forecast, by Application 2020 & 2033
- Table 52: Global MEA Aircraft Seating Industry Revenue billion Forecast, by Production Analysis 2020 & 2033
- Table 53: Global MEA Aircraft Seating Industry Revenue billion Forecast, by Consumption Analysis 2020 & 2033
- Table 54: Global MEA Aircraft Seating Industry Revenue billion Forecast, by Import Market Analysis (Value & Volume) 2020 & 2033
- Table 55: Global MEA Aircraft Seating Industry Revenue billion Forecast, by Export Market Analysis (Value & Volume) 2020 & 2033
- Table 56: Global MEA Aircraft Seating Industry Revenue billion Forecast, by Price Trend Analysis 2020 & 2033
- Table 57: Global MEA Aircraft Seating Industry Revenue billion Forecast, by Country 2020 & 2033
- Table 58: China MEA Aircraft Seating Industry Revenue (billion) Forecast, by Application 2020 & 2033
- Table 59: India MEA Aircraft Seating Industry Revenue (billion) Forecast, by Application 2020 & 2033
- Table 60: Japan MEA Aircraft Seating Industry Revenue (billion) Forecast, by Application 2020 & 2033
- Table 61: South Korea MEA Aircraft Seating Industry Revenue (billion) Forecast, by Application 2020 & 2033
- Table 62: ASEAN MEA Aircraft Seating Industry Revenue (billion) Forecast, by Application 2020 & 2033
- Table 63: Oceania MEA Aircraft Seating Industry Revenue (billion) Forecast, by Application 2020 & 2033
- Table 64: Rest of Asia Pacific MEA Aircraft Seating Industry Revenue (billion) Forecast, by Application 2020 & 2033
Frequently Asked Questions
1. What is the projected Compound Annual Growth Rate (CAGR) of the MEA Aircraft Seating Industry?
The projected CAGR is approximately 4.85%.
2. Which companies are prominent players in the MEA Aircraft Seating Industry?
Key companies in the market include Thompson Aero Seating Limited*List Not Exhaustive, Recaro Holding GmbH, Geven SPA, EnCore (The Boeing Company), Safran SA, Hong Kong Aircraft Engineering Company Limited (HAECO), Acro Aircraft Seating, Collins Aerospace (Raytheon Technologies Corporation), Jamco Corp, STELIA Aerospace (Airbus SE), Aviointeriors SPA.
3. What are the main segments of the MEA Aircraft Seating Industry?
The market segments include Production Analysis, Consumption Analysis, Import Market Analysis (Value & Volume), Export Market Analysis (Value & Volume), Price Trend Analysis.
4. Can you provide details about the market size?
The market size is estimated to be USD 9.44 billion as of 2022.
5. What are some drivers contributing to market growth?
; Increased Seaborne Threats And Ambiguous Maritime Security Policies; Increasing Adoption Of Security Technologies In Bric Countries.
6. What are the notable trends driving market growth?
The Narrow-body Aircraft Segment Held the Highest Market Share.
7. Are there any restraints impacting market growth?
; High Risk Rate In Ungoverned Zones; Unstructured Security Standards And Technologies.
8. Can you provide examples of recent developments in the market?
September 2021: Saudi Arabian Airlines (Saudia) unveiled various models of the latest next-generation aircraft seats in both business and economy classes which would be included in the airline's upcoming new Airbus A321XLR aircraft deliveries.
9. What pricing options are available for accessing the report?
Pricing options include single-user, multi-user, and enterprise licenses priced at USD 3800, USD 4500, and USD 5800 respectively.
10. Is the market size provided in terms of value or volume?
The market size is provided in terms of value, measured in billion.
11. Are there any specific market keywords associated with the report?
Yes, the market keyword associated with the report is "MEA Aircraft Seating Industry," which aids in identifying and referencing the specific market segment covered.
12. How do I determine which pricing option suits my needs best?
The pricing options vary based on user requirements and access needs. Individual users may opt for single-user licenses, while businesses requiring broader access may choose multi-user or enterprise licenses for cost-effective access to the report.
13. Are there any additional resources or data provided in the MEA Aircraft Seating Industry report?
While the report offers comprehensive insights, it's advisable to review the specific contents or supplementary materials provided to ascertain if additional resources or data are available.
14. How can I stay updated on further developments or reports in the MEA Aircraft Seating Industry?
To stay informed about further developments, trends, and reports in the MEA Aircraft Seating Industry, consider subscribing to industry newsletters, following relevant companies and organizations, or regularly checking reputable industry news sources and publications.
Methodology
Step 1 - Identification of Relevant Samples Size from Population Database


Step 2 - Approaches for Defining Global Market Size (Value, Volume* & Price*)

Note*: In applicable scenarios
Step 3 - Data Sources
Primary Research
- Web Analytics
- Survey Reports
- Research Institute
- Latest Research Reports
- Opinion Leaders
Secondary Research
- Annual Reports
- White Paper
- Latest Press Release
- Industry Association
- Paid Database
- Investor Presentations

Step 4 - Data Triangulation
Involves using different sources of information in order to increase the validity of a study
These sources are likely to be stakeholders in a program - participants, other researchers, program staff, other community members, and so on.
Then we put all data in single framework & apply various statistical tools to find out the dynamic on the market.
During the analysis stage, feedback from the stakeholder groups would be compared to determine areas of agreement as well as areas of divergence