
Key Insights
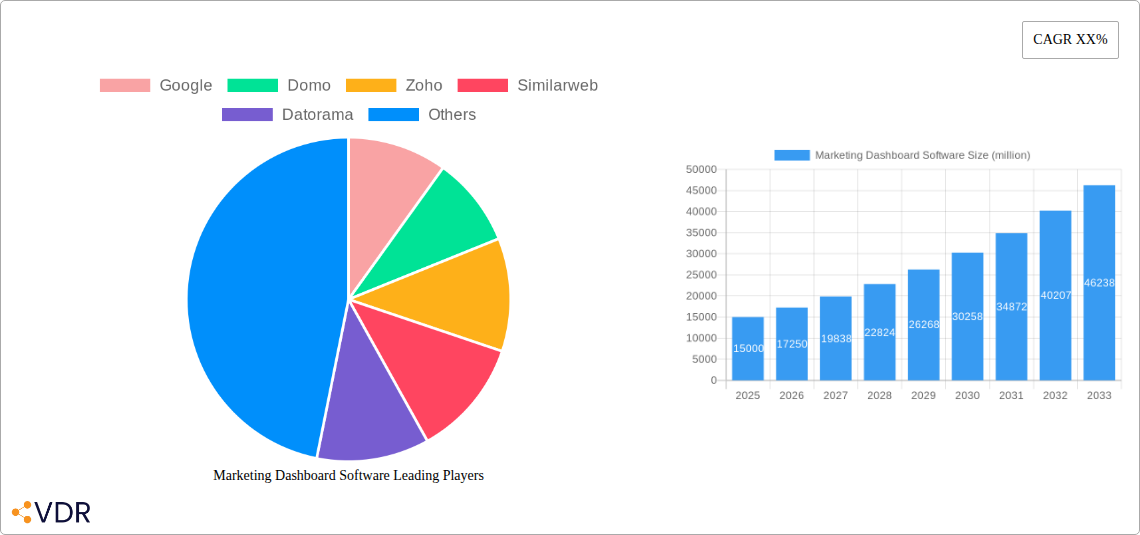
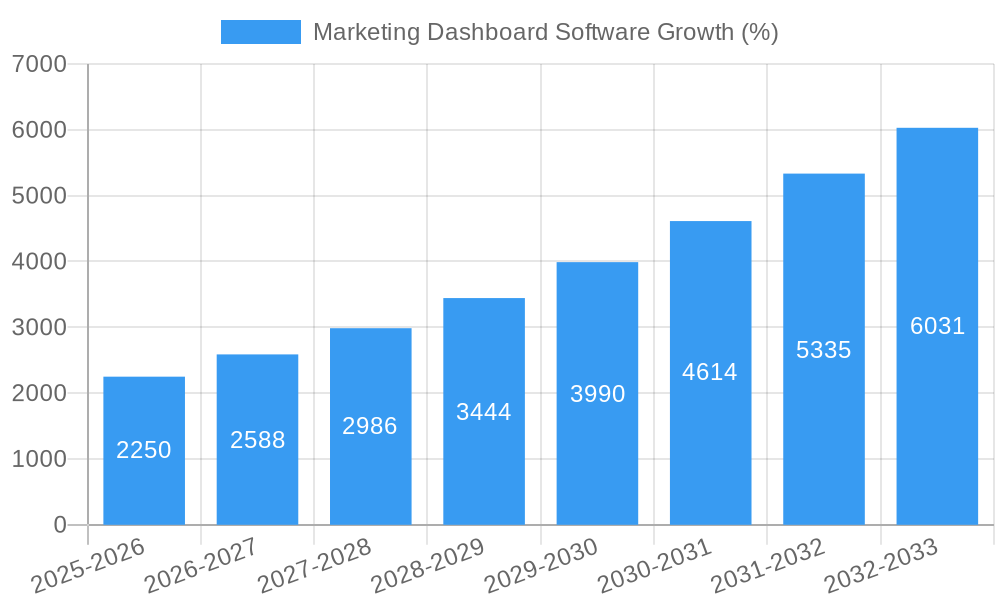
The Marketing Dashboard Software market is experiencing robust growth, driven by the increasing need for businesses to gain actionable insights from their marketing data. The market, estimated at $15 billion in 2025, is projected to exhibit a Compound Annual Growth Rate (CAGR) of 15% from 2025 to 2033, reaching approximately $45 billion by 2033. This expansion is fueled by several key factors. Firstly, the rising adoption of data-driven decision-making across marketing teams necessitates comprehensive dashboards providing a unified view of campaign performance, customer behavior, and ROI. Secondly, the proliferation of marketing channels and data sources makes consolidated reporting and analysis crucial, a capability effectively addressed by marketing dashboard software. Thirdly, advancements in artificial intelligence (AI) and machine learning (ML) are integrating into these dashboards, enabling predictive analytics and automated insights generation, further enhancing their value proposition. Competition is fierce, with established players like Google and Domo alongside agile startups such as Similarweb and Sigma Computing vying for market share. The market is segmented by deployment (cloud-based and on-premise), size of business (small, medium, and large enterprises), and functionality (reporting, analytics, and predictive modeling).
The market's growth, however, faces certain restraints. Integration complexities with existing marketing technology stacks can hinder adoption, while the need for specialized skills to effectively utilize the software's advanced analytical capabilities presents a barrier for some businesses. Furthermore, the high initial cost of implementation and ongoing maintenance can be a deterrent, particularly for smaller businesses. Despite these challenges, the long-term outlook for the Marketing Dashboard Software market remains positive. The increasing availability of affordable and user-friendly solutions, coupled with growing awareness of the benefits of data-driven marketing, is expected to drive wider adoption across various industries and business sizes in the coming years. Regional growth will likely be strongest in North America and Europe, followed by Asia-Pacific and other regions.
This comprehensive report provides a detailed analysis of the global Marketing Dashboard Software market, encompassing market dynamics, growth trends, regional performance, competitive landscape, and future outlook. The study period covers 2019-2033, with 2025 as the base and estimated year. The forecast period is 2025-2033, and the historical period is 2019-2024. This report is an invaluable resource for industry professionals, investors, and anyone seeking to understand this rapidly evolving market segment. The parent market is Business Intelligence (BI) software, and the child market is specifically Marketing Analytics dashboards.
Marketing Dashboard Software Market Dynamics & Structure
The global Marketing Dashboard Software market, valued at $xx billion in 2024, is experiencing robust growth driven by increasing demand for data-driven marketing strategies across various industries. Market concentration is moderately high, with key players like Google, Domo, and Zoho holding significant market share. Technological innovations such as AI-powered analytics and real-time data visualization are transforming the landscape. Regulatory frameworks concerning data privacy (like GDPR) influence product development and deployment. Competitive substitutes include generic BI tools with marketing add-ons, however, specialized dashboards offer superior ROI and ease of use. End-users span various industries, with significant adoption in retail, e-commerce, and financial services. M&A activity in this sector has been moderate, with approximately xx deals recorded between 2019 and 2024, totaling xx billion USD in value.
- Market Concentration: Moderately high, with top 5 players holding approximately 60% market share in 2024.
- Technological Innovation: AI, machine learning, real-time data visualization, and improved data integration are key drivers.
- Regulatory Frameworks: GDPR and CCPA compliance significantly impact data security and usage.
- Competitive Substitutes: Generic BI tools with customizable dashboards pose a threat, but specialized solutions still dominate.
- End-User Demographics: Retail, e-commerce, finance, and technology sectors are major adopters.
- M&A Trends: Moderate activity, with xx billion USD in total deal value (2019-2024).
Marketing Dashboard Software Growth Trends & Insights
The Marketing Dashboard Software market demonstrates a consistent upward trajectory, exhibiting a Compound Annual Growth Rate (CAGR) of xx% during the historical period (2019-2024) and a projected CAGR of xx% during the forecast period (2025-2033). Market size is anticipated to reach $xx billion by 2033. Increased adoption of cloud-based solutions, coupled with the rising demand for data-driven decision-making, is fueling this growth. Technological advancements such as enhanced data integration capabilities and more sophisticated analytics are further accelerating market penetration. Consumer behavior shifts toward personalized marketing experiences necessitate real-time data analysis and effective campaign tracking, significantly increasing the demand for sophisticated marketing dashboards. Market penetration is projected to reach xx% by 2033. The shift towards omnichannel marketing strategies, demanding centralized data management and real-time performance monitoring, is another crucial factor.
Dominant Regions, Countries, or Segments in Marketing Dashboard Software
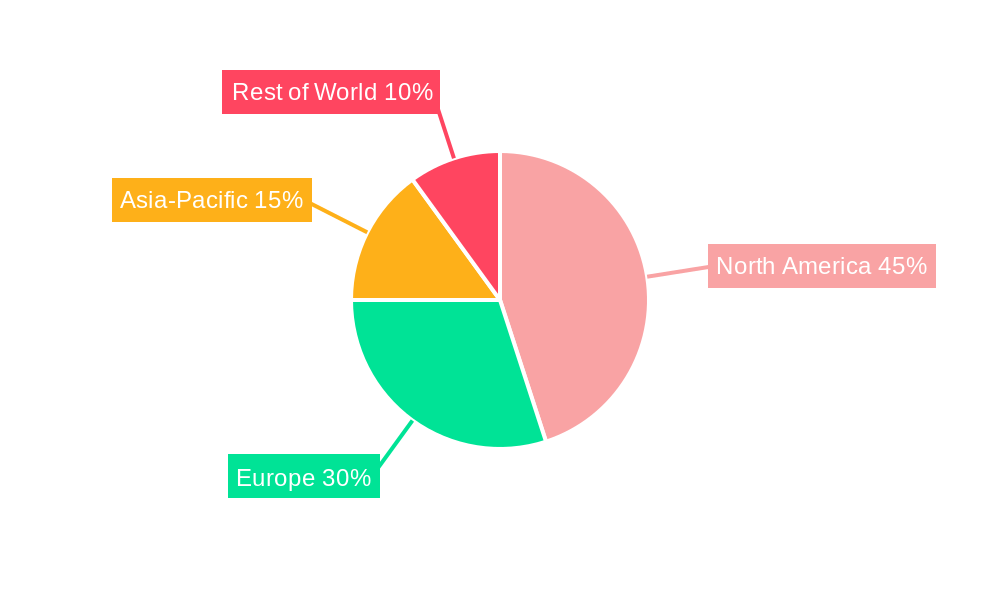
North America currently dominates the Marketing Dashboard Software market, holding approximately xx% market share in 2024, primarily driven by high technological adoption, robust infrastructure, and the presence of major market players. Europe follows closely with a market share of xx%, experiencing strong growth fueled by increasing regulatory compliance needs and the growing adoption of digital marketing techniques. Asia-Pacific is expected to exhibit the fastest growth in the forecast period, driven by burgeoning digital economies and the increasing adoption of cloud computing solutions.
- North America: High technological adoption, established market players, and robust infrastructure.
- Europe: Strong growth due to regulatory compliance requirements and increased digital marketing adoption.
- Asia-Pacific: Fastest-growing region driven by expanding digital economies and cloud computing adoption.
- Market Share: North America (xx%), Europe (xx%), Asia-Pacific (xx%), Rest of World (xx%) in 2024.
Marketing Dashboard Software Product Landscape
Marketing dashboard software solutions are evolving rapidly, integrating advanced analytics, AI-powered insights, and real-time data visualization. Key features include customizable dashboards, cross-channel performance tracking, and automated reporting capabilities. Products are increasingly focusing on user-friendly interfaces and seamless integrations with other marketing tools. Unique selling propositions often center around specialized industry features, advanced AI capabilities, and exceptional ease of use, delivering a superior user experience. Technological advancements, like predictive analytics and improved data security features, are consistently enhancing market offerings.
Key Drivers, Barriers & Challenges in Marketing Dashboard Software
Key Drivers: The increasing need for data-driven marketing decisions, the growing adoption of cloud-based solutions, and the rising demand for real-time data analysis are major drivers. Furthermore, the expansion of e-commerce and omnichannel marketing strategies necessitates effective data management and performance tracking, leading to increased market demand.
Key Challenges: High initial investment costs, integration complexities with existing marketing systems, and the need for skilled professionals to interpret the data effectively present significant barriers. Data privacy regulations and the rising cost of data storage further add to the challenges. Competition from established players and emerging startups also creates market pressure. Supply chain disruptions can impact the timely delivery of software updates and support.
Emerging Opportunities in Marketing Dashboard Software
Untapped markets in developing economies represent significant growth opportunities, especially in regions with a burgeoning digital landscape. The integration of innovative technologies like AR/VR, blockchain and the metaverse into marketing strategies could also open new market segments. The increasing need for personalized marketing experiences necessitates the development of highly customizable dashboards and tailored solutions.
Growth Accelerators in the Marketing Dashboard Software Industry
Strategic partnerships between software providers and marketing agencies, coupled with ongoing investments in research and development, are critical growth accelerators. Expanding into new geographical markets and offering specialized solutions for niche industries further contribute to market expansion. Technological breakthroughs in AI, machine learning, and data visualization will continue to enhance the capabilities of marketing dashboards, driving product adoption.
Key Players Shaping the Marketing Dashboard Software Market
- Domo
- Zoho
- Similarweb
- Datorama (Salesforce)
- Sigma Computing
- AnyRoad
- Beckon
- BrandOps
- ClicData
- E-Kalite
- Get Easy Software
- Origami Logic
- Webmaxy
- Sweetspot
Notable Milestones in Marketing Dashboard Software Sector
- 2020: Google integrates enhanced analytics features into its marketing platform.
- 2021: Domo launches a new AI-powered dashboard for predictive marketing.
- 2022: Zoho releases an updated marketing dashboard with improved data integration capabilities.
- 2023: Several mergers and acquisitions reshape the competitive landscape.
- 2024: Several companies release new dashboard features including improved predictive analytics capabilities and advanced data visualization options.
In-Depth Marketing Dashboard Software Market Outlook
The Marketing Dashboard Software market is poised for continued growth, driven by technological advancements, increasing data-driven marketing adoption, and expansion into new markets. Strategic partnerships and the development of innovative solutions catering to evolving consumer preferences will further enhance market potential. The integration of AI and machine learning will improve predictive capabilities and offer new opportunities for marketers. The focus on user-friendly interfaces and seamless integrations will also drive product adoption.
Marketing Dashboard Software Segmentation
-
1. Application
- 1.1. Large Enterprises
- 1.2. SMEs
-
2. Types
- 2.1. Cloud-Based
- 2.2. On-Premise
Marketing Dashboard Software Segmentation By Geography
-
1. North America
- 1.1. United States
- 1.2. Canada
- 1.3. Mexico
-
2. South America
- 2.1. Brazil
- 2.2. Argentina
- 2.3. Rest of South America
-
3. Europe
- 3.1. United Kingdom
- 3.2. Germany
- 3.3. France
- 3.4. Italy
- 3.5. Spain
- 3.6. Russia
- 3.7. Benelux
- 3.8. Nordics
- 3.9. Rest of Europe
-
4. Middle East & Africa
- 4.1. Turkey
- 4.2. Israel
- 4.3. GCC
- 4.4. North Africa
- 4.5. South Africa
- 4.6. Rest of Middle East & Africa
-
5. Asia Pacific
- 5.1. China
- 5.2. India
- 5.3. Japan
- 5.4. South Korea
- 5.5. ASEAN
- 5.6. Oceania
- 5.7. Rest of Asia Pacific
Marketing Dashboard Software REPORT HIGHLIGHTS
| Aspects | Details |
|---|---|
| Study Period | 2019-2033 |
| Base Year | 2024 |
| Estimated Year | 2025 |
| Forecast Period | 2025-2033 |
| Historical Period | 2019-2024 |
| Growth Rate | CAGR of XX% from 2019-2033 |
| Segmentation |
|
Table of Contents
- 1. Introduction
- 1.1. Research Scope
- 1.2. Market Segmentation
- 1.3. Research Methodology
- 1.4. Definitions and Assumptions
- 2. Executive Summary
- 2.1. Introduction
- 3. Market Dynamics
- 3.1. Introduction
- 3.2. Market Drivers
- 3.3. Market Restrains
- 3.4. Market Trends
- 4. Market Factor Analysis
- 4.1. Porters Five Forces
- 4.2. Supply/Value Chain
- 4.3. PESTEL analysis
- 4.4. Market Entropy
- 4.5. Patent/Trademark Analysis
- 5. Global Marketing Dashboard Software Analysis, Insights and Forecast, 2019-2031
- 5.1. Market Analysis, Insights and Forecast - by Application
- 5.1.1. Large Enterprises
- 5.1.2. SMEs
- 5.2. Market Analysis, Insights and Forecast - by Types
- 5.2.1. Cloud-Based
- 5.2.2. On-Premise
- 5.3. Market Analysis, Insights and Forecast - by Region
- 5.3.1. North America
- 5.3.2. South America
- 5.3.3. Europe
- 5.3.4. Middle East & Africa
- 5.3.5. Asia Pacific
- 5.1. Market Analysis, Insights and Forecast - by Application
- 6. North America Marketing Dashboard Software Analysis, Insights and Forecast, 2019-2031
- 6.1. Market Analysis, Insights and Forecast - by Application
- 6.1.1. Large Enterprises
- 6.1.2. SMEs
- 6.2. Market Analysis, Insights and Forecast - by Types
- 6.2.1. Cloud-Based
- 6.2.2. On-Premise
- 6.1. Market Analysis, Insights and Forecast - by Application
- 7. South America Marketing Dashboard Software Analysis, Insights and Forecast, 2019-2031
- 7.1. Market Analysis, Insights and Forecast - by Application
- 7.1.1. Large Enterprises
- 7.1.2. SMEs
- 7.2. Market Analysis, Insights and Forecast - by Types
- 7.2.1. Cloud-Based
- 7.2.2. On-Premise
- 7.1. Market Analysis, Insights and Forecast - by Application
- 8. Europe Marketing Dashboard Software Analysis, Insights and Forecast, 2019-2031
- 8.1. Market Analysis, Insights and Forecast - by Application
- 8.1.1. Large Enterprises
- 8.1.2. SMEs
- 8.2. Market Analysis, Insights and Forecast - by Types
- 8.2.1. Cloud-Based
- 8.2.2. On-Premise
- 8.1. Market Analysis, Insights and Forecast - by Application
- 9. Middle East & Africa Marketing Dashboard Software Analysis, Insights and Forecast, 2019-2031
- 9.1. Market Analysis, Insights and Forecast - by Application
- 9.1.1. Large Enterprises
- 9.1.2. SMEs
- 9.2. Market Analysis, Insights and Forecast - by Types
- 9.2.1. Cloud-Based
- 9.2.2. On-Premise
- 9.1. Market Analysis, Insights and Forecast - by Application
- 10. Asia Pacific Marketing Dashboard Software Analysis, Insights and Forecast, 2019-2031
- 10.1. Market Analysis, Insights and Forecast - by Application
- 10.1.1. Large Enterprises
- 10.1.2. SMEs
- 10.2. Market Analysis, Insights and Forecast - by Types
- 10.2.1. Cloud-Based
- 10.2.2. On-Premise
- 10.1. Market Analysis, Insights and Forecast - by Application
- 11. Competitive Analysis
- 11.1. Global Market Share Analysis 2024
- 11.2. Company Profiles
- 11.2.1 Google
- 11.2.1.1. Overview
- 11.2.1.2. Products
- 11.2.1.3. SWOT Analysis
- 11.2.1.4. Recent Developments
- 11.2.1.5. Financials (Based on Availability)
- 11.2.2 Domo
- 11.2.2.1. Overview
- 11.2.2.2. Products
- 11.2.2.3. SWOT Analysis
- 11.2.2.4. Recent Developments
- 11.2.2.5. Financials (Based on Availability)
- 11.2.3 Zoho
- 11.2.3.1. Overview
- 11.2.3.2. Products
- 11.2.3.3. SWOT Analysis
- 11.2.3.4. Recent Developments
- 11.2.3.5. Financials (Based on Availability)
- 11.2.4 Similarweb
- 11.2.4.1. Overview
- 11.2.4.2. Products
- 11.2.4.3. SWOT Analysis
- 11.2.4.4. Recent Developments
- 11.2.4.5. Financials (Based on Availability)
- 11.2.5 Datorama
- 11.2.5.1. Overview
- 11.2.5.2. Products
- 11.2.5.3. SWOT Analysis
- 11.2.5.4. Recent Developments
- 11.2.5.5. Financials (Based on Availability)
- 11.2.6 Sigma Computing
- 11.2.6.1. Overview
- 11.2.6.2. Products
- 11.2.6.3. SWOT Analysis
- 11.2.6.4. Recent Developments
- 11.2.6.5. Financials (Based on Availability)
- 11.2.7 AnyRoad
- 11.2.7.1. Overview
- 11.2.7.2. Products
- 11.2.7.3. SWOT Analysis
- 11.2.7.4. Recent Developments
- 11.2.7.5. Financials (Based on Availability)
- 11.2.8 Beckon
- 11.2.8.1. Overview
- 11.2.8.2. Products
- 11.2.8.3. SWOT Analysis
- 11.2.8.4. Recent Developments
- 11.2.8.5. Financials (Based on Availability)
- 11.2.9 BrandOps
- 11.2.9.1. Overview
- 11.2.9.2. Products
- 11.2.9.3. SWOT Analysis
- 11.2.9.4. Recent Developments
- 11.2.9.5. Financials (Based on Availability)
- 11.2.10 ClicData
- 11.2.10.1. Overview
- 11.2.10.2. Products
- 11.2.10.3. SWOT Analysis
- 11.2.10.4. Recent Developments
- 11.2.10.5. Financials (Based on Availability)
- 11.2.11 E-Kalite
- 11.2.11.1. Overview
- 11.2.11.2. Products
- 11.2.11.3. SWOT Analysis
- 11.2.11.4. Recent Developments
- 11.2.11.5. Financials (Based on Availability)
- 11.2.12 Get Easy Software
- 11.2.12.1. Overview
- 11.2.12.2. Products
- 11.2.12.3. SWOT Analysis
- 11.2.12.4. Recent Developments
- 11.2.12.5. Financials (Based on Availability)
- 11.2.13 Origami Logic
- 11.2.13.1. Overview
- 11.2.13.2. Products
- 11.2.13.3. SWOT Analysis
- 11.2.13.4. Recent Developments
- 11.2.13.5. Financials (Based on Availability)
- 11.2.14 Webmaxy
- 11.2.14.1. Overview
- 11.2.14.2. Products
- 11.2.14.3. SWOT Analysis
- 11.2.14.4. Recent Developments
- 11.2.14.5. Financials (Based on Availability)
- 11.2.15 Sweetspot
- 11.2.15.1. Overview
- 11.2.15.2. Products
- 11.2.15.3. SWOT Analysis
- 11.2.15.4. Recent Developments
- 11.2.15.5. Financials (Based on Availability)
- 11.2.1 Google
List of Figures
- Figure 1: Global Marketing Dashboard Software Revenue Breakdown (million, %) by Region 2024 & 2032
- Figure 2: North America Marketing Dashboard Software Revenue (million), by Application 2024 & 2032
- Figure 3: North America Marketing Dashboard Software Revenue Share (%), by Application 2024 & 2032
- Figure 4: North America Marketing Dashboard Software Revenue (million), by Types 2024 & 2032
- Figure 5: North America Marketing Dashboard Software Revenue Share (%), by Types 2024 & 2032
- Figure 6: North America Marketing Dashboard Software Revenue (million), by Country 2024 & 2032
- Figure 7: North America Marketing Dashboard Software Revenue Share (%), by Country 2024 & 2032
- Figure 8: South America Marketing Dashboard Software Revenue (million), by Application 2024 & 2032
- Figure 9: South America Marketing Dashboard Software Revenue Share (%), by Application 2024 & 2032
- Figure 10: South America Marketing Dashboard Software Revenue (million), by Types 2024 & 2032
- Figure 11: South America Marketing Dashboard Software Revenue Share (%), by Types 2024 & 2032
- Figure 12: South America Marketing Dashboard Software Revenue (million), by Country 2024 & 2032
- Figure 13: South America Marketing Dashboard Software Revenue Share (%), by Country 2024 & 2032
- Figure 14: Europe Marketing Dashboard Software Revenue (million), by Application 2024 & 2032
- Figure 15: Europe Marketing Dashboard Software Revenue Share (%), by Application 2024 & 2032
- Figure 16: Europe Marketing Dashboard Software Revenue (million), by Types 2024 & 2032
- Figure 17: Europe Marketing Dashboard Software Revenue Share (%), by Types 2024 & 2032
- Figure 18: Europe Marketing Dashboard Software Revenue (million), by Country 2024 & 2032
- Figure 19: Europe Marketing Dashboard Software Revenue Share (%), by Country 2024 & 2032
- Figure 20: Middle East & Africa Marketing Dashboard Software Revenue (million), by Application 2024 & 2032
- Figure 21: Middle East & Africa Marketing Dashboard Software Revenue Share (%), by Application 2024 & 2032
- Figure 22: Middle East & Africa Marketing Dashboard Software Revenue (million), by Types 2024 & 2032
- Figure 23: Middle East & Africa Marketing Dashboard Software Revenue Share (%), by Types 2024 & 2032
- Figure 24: Middle East & Africa Marketing Dashboard Software Revenue (million), by Country 2024 & 2032
- Figure 25: Middle East & Africa Marketing Dashboard Software Revenue Share (%), by Country 2024 & 2032
- Figure 26: Asia Pacific Marketing Dashboard Software Revenue (million), by Application 2024 & 2032
- Figure 27: Asia Pacific Marketing Dashboard Software Revenue Share (%), by Application 2024 & 2032
- Figure 28: Asia Pacific Marketing Dashboard Software Revenue (million), by Types 2024 & 2032
- Figure 29: Asia Pacific Marketing Dashboard Software Revenue Share (%), by Types 2024 & 2032
- Figure 30: Asia Pacific Marketing Dashboard Software Revenue (million), by Country 2024 & 2032
- Figure 31: Asia Pacific Marketing Dashboard Software Revenue Share (%), by Country 2024 & 2032
List of Tables
- Table 1: Global Marketing Dashboard Software Revenue million Forecast, by Region 2019 & 2032
- Table 2: Global Marketing Dashboard Software Revenue million Forecast, by Application 2019 & 2032
- Table 3: Global Marketing Dashboard Software Revenue million Forecast, by Types 2019 & 2032
- Table 4: Global Marketing Dashboard Software Revenue million Forecast, by Region 2019 & 2032
- Table 5: Global Marketing Dashboard Software Revenue million Forecast, by Application 2019 & 2032
- Table 6: Global Marketing Dashboard Software Revenue million Forecast, by Types 2019 & 2032
- Table 7: Global Marketing Dashboard Software Revenue million Forecast, by Country 2019 & 2032
- Table 8: United States Marketing Dashboard Software Revenue (million) Forecast, by Application 2019 & 2032
- Table 9: Canada Marketing Dashboard Software Revenue (million) Forecast, by Application 2019 & 2032
- Table 10: Mexico Marketing Dashboard Software Revenue (million) Forecast, by Application 2019 & 2032
- Table 11: Global Marketing Dashboard Software Revenue million Forecast, by Application 2019 & 2032
- Table 12: Global Marketing Dashboard Software Revenue million Forecast, by Types 2019 & 2032
- Table 13: Global Marketing Dashboard Software Revenue million Forecast, by Country 2019 & 2032
- Table 14: Brazil Marketing Dashboard Software Revenue (million) Forecast, by Application 2019 & 2032
- Table 15: Argentina Marketing Dashboard Software Revenue (million) Forecast, by Application 2019 & 2032
- Table 16: Rest of South America Marketing Dashboard Software Revenue (million) Forecast, by Application 2019 & 2032
- Table 17: Global Marketing Dashboard Software Revenue million Forecast, by Application 2019 & 2032
- Table 18: Global Marketing Dashboard Software Revenue million Forecast, by Types 2019 & 2032
- Table 19: Global Marketing Dashboard Software Revenue million Forecast, by Country 2019 & 2032
- Table 20: United Kingdom Marketing Dashboard Software Revenue (million) Forecast, by Application 2019 & 2032
- Table 21: Germany Marketing Dashboard Software Revenue (million) Forecast, by Application 2019 & 2032
- Table 22: France Marketing Dashboard Software Revenue (million) Forecast, by Application 2019 & 2032
- Table 23: Italy Marketing Dashboard Software Revenue (million) Forecast, by Application 2019 & 2032
- Table 24: Spain Marketing Dashboard Software Revenue (million) Forecast, by Application 2019 & 2032
- Table 25: Russia Marketing Dashboard Software Revenue (million) Forecast, by Application 2019 & 2032
- Table 26: Benelux Marketing Dashboard Software Revenue (million) Forecast, by Application 2019 & 2032
- Table 27: Nordics Marketing Dashboard Software Revenue (million) Forecast, by Application 2019 & 2032
- Table 28: Rest of Europe Marketing Dashboard Software Revenue (million) Forecast, by Application 2019 & 2032
- Table 29: Global Marketing Dashboard Software Revenue million Forecast, by Application 2019 & 2032
- Table 30: Global Marketing Dashboard Software Revenue million Forecast, by Types 2019 & 2032
- Table 31: Global Marketing Dashboard Software Revenue million Forecast, by Country 2019 & 2032
- Table 32: Turkey Marketing Dashboard Software Revenue (million) Forecast, by Application 2019 & 2032
- Table 33: Israel Marketing Dashboard Software Revenue (million) Forecast, by Application 2019 & 2032
- Table 34: GCC Marketing Dashboard Software Revenue (million) Forecast, by Application 2019 & 2032
- Table 35: North Africa Marketing Dashboard Software Revenue (million) Forecast, by Application 2019 & 2032
- Table 36: South Africa Marketing Dashboard Software Revenue (million) Forecast, by Application 2019 & 2032
- Table 37: Rest of Middle East & Africa Marketing Dashboard Software Revenue (million) Forecast, by Application 2019 & 2032
- Table 38: Global Marketing Dashboard Software Revenue million Forecast, by Application 2019 & 2032
- Table 39: Global Marketing Dashboard Software Revenue million Forecast, by Types 2019 & 2032
- Table 40: Global Marketing Dashboard Software Revenue million Forecast, by Country 2019 & 2032
- Table 41: China Marketing Dashboard Software Revenue (million) Forecast, by Application 2019 & 2032
- Table 42: India Marketing Dashboard Software Revenue (million) Forecast, by Application 2019 & 2032
- Table 43: Japan Marketing Dashboard Software Revenue (million) Forecast, by Application 2019 & 2032
- Table 44: South Korea Marketing Dashboard Software Revenue (million) Forecast, by Application 2019 & 2032
- Table 45: ASEAN Marketing Dashboard Software Revenue (million) Forecast, by Application 2019 & 2032
- Table 46: Oceania Marketing Dashboard Software Revenue (million) Forecast, by Application 2019 & 2032
- Table 47: Rest of Asia Pacific Marketing Dashboard Software Revenue (million) Forecast, by Application 2019 & 2032
Frequently Asked Questions
1. What is the projected Compound Annual Growth Rate (CAGR) of the Marketing Dashboard Software?
The projected CAGR is approximately XX%.
2. Which companies are prominent players in the Marketing Dashboard Software?
Key companies in the market include Google, Domo, Zoho, Similarweb, Datorama, Sigma Computing, AnyRoad, Beckon, BrandOps, ClicData, E-Kalite, Get Easy Software, Origami Logic, Webmaxy, Sweetspot.
3. What are the main segments of the Marketing Dashboard Software?
The market segments include Application, Types.
4. Can you provide details about the market size?
The market size is estimated to be USD XXX million as of 2022.
5. What are some drivers contributing to market growth?
N/A
6. What are the notable trends driving market growth?
N/A
7. Are there any restraints impacting market growth?
N/A
8. Can you provide examples of recent developments in the market?
N/A
9. What pricing options are available for accessing the report?
Pricing options include single-user, multi-user, and enterprise licenses priced at USD 2900.00, USD 4350.00, and USD 5800.00 respectively.
10. Is the market size provided in terms of value or volume?
The market size is provided in terms of value, measured in million.
11. Are there any specific market keywords associated with the report?
Yes, the market keyword associated with the report is "Marketing Dashboard Software," which aids in identifying and referencing the specific market segment covered.
12. How do I determine which pricing option suits my needs best?
The pricing options vary based on user requirements and access needs. Individual users may opt for single-user licenses, while businesses requiring broader access may choose multi-user or enterprise licenses for cost-effective access to the report.
13. Are there any additional resources or data provided in the Marketing Dashboard Software report?
While the report offers comprehensive insights, it's advisable to review the specific contents or supplementary materials provided to ascertain if additional resources or data are available.
14. How can I stay updated on further developments or reports in the Marketing Dashboard Software?
To stay informed about further developments, trends, and reports in the Marketing Dashboard Software, consider subscribing to industry newsletters, following relevant companies and organizations, or regularly checking reputable industry news sources and publications.
Methodology
Step 1 - Identification of Relevant Samples Size from Population Database


Step 2 - Approaches for Defining Global Market Size (Value, Volume* & Price*)

Note*: In applicable scenarios
Step 3 - Data Sources
Primary Research
- Web Analytics
- Survey Reports
- Research Institute
- Latest Research Reports
- Opinion Leaders
Secondary Research
- Annual Reports
- White Paper
- Latest Press Release
- Industry Association
- Paid Database
- Investor Presentations

Step 4 - Data Triangulation
Involves using different sources of information in order to increase the validity of a study
These sources are likely to be stakeholders in a program - participants, other researchers, program staff, other community members, and so on.
Then we put all data in single framework & apply various statistical tools to find out the dynamic on the market.
During the analysis stage, feedback from the stakeholder groups would be compared to determine areas of agreement as well as areas of divergence


