
Key Insights
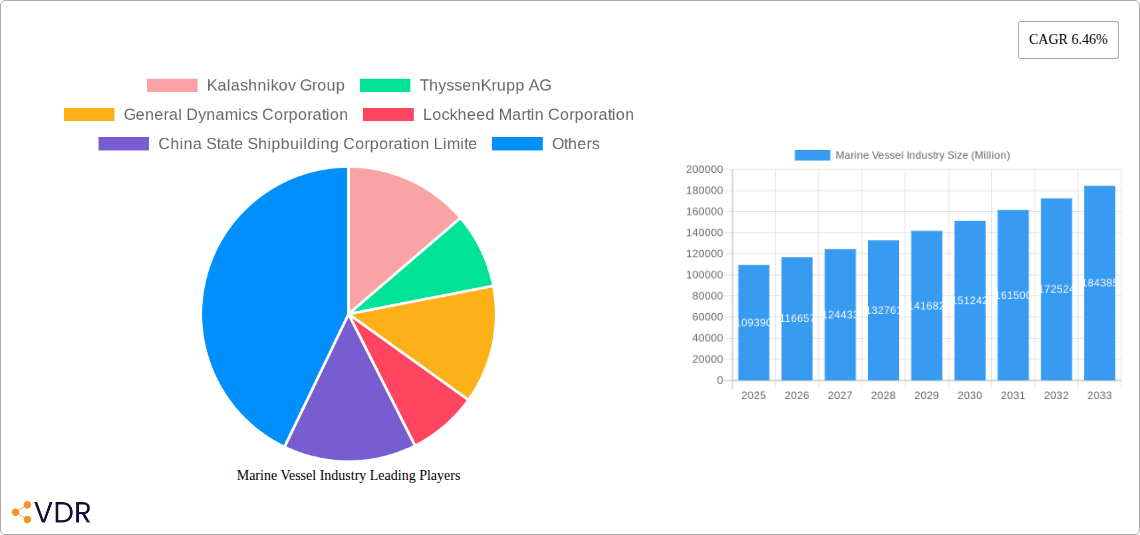
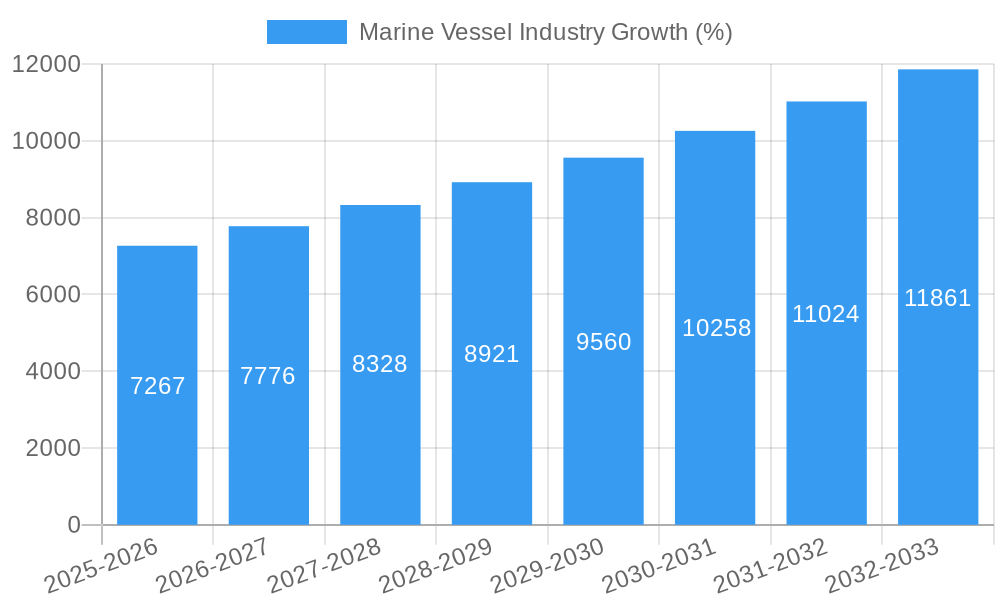
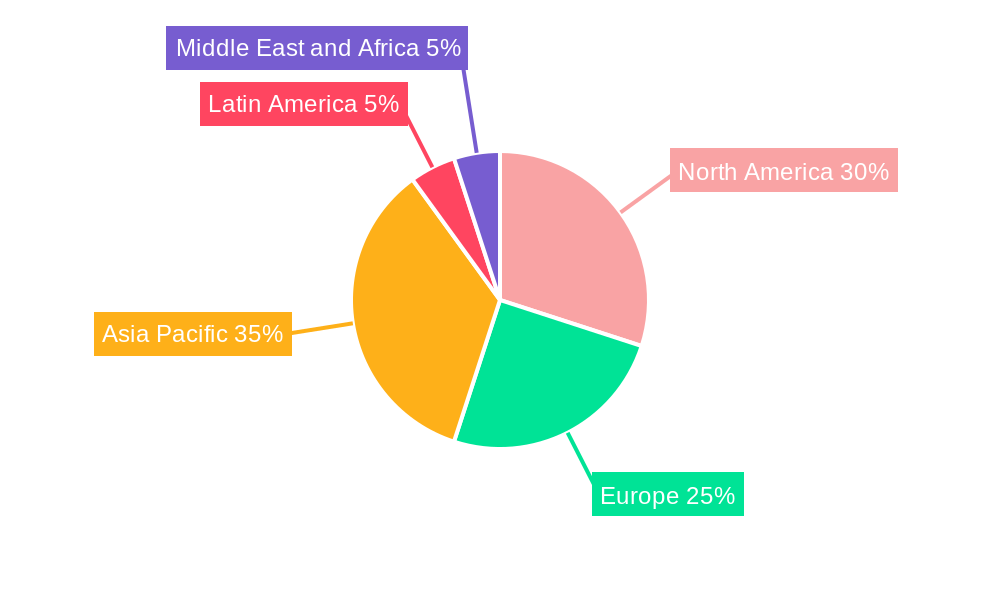
The global marine vessel market, valued at $109.39 billion in 2025, is projected to experience robust growth, driven by increasing defense budgets worldwide, escalating geopolitical tensions necessitating naval modernization, and the growing demand for maritime trade and transportation. A compound annual growth rate (CAGR) of 6.46% from 2025 to 2033 indicates a significant expansion, with the market expected to surpass $180 billion by 2033. Key drivers include technological advancements in vessel design and construction, leading to improved efficiency, fuel economy, and operational capabilities. Furthermore, the rising adoption of autonomous and remotely operated vessels is expected to significantly shape the industry's future, alongside the increasing focus on sustainable shipbuilding practices to minimize environmental impact. Market segmentation reveals significant demand across various vessel types, with destroyers, frigates, and submarines consistently representing substantial market shares. However, emerging trends indicate a growing interest in corvettes and specialized vessels, driven by the need for flexible and cost-effective naval solutions and a growing focus on specialized tasks. Geographical distribution shows strong demand across North America, Europe, and Asia-Pacific regions, reflecting significant naval investments and the concentration of major shipbuilding companies in these areas. While competitive pressures from established players like General Dynamics, Lockheed Martin, and BAE Systems remain significant, new entrants from regions like Asia are emerging, adding further dynamism to the market.
Geographic variations in market growth are expected, with Asia-Pacific projected to lead owing to substantial investments from countries such as China, India, and South Korea. The European market will continue to hold a strong position due to the presence of major players and consistent defense spending. North America will experience steady growth, propelled by the US Navy’s modernization programs. The market, however, faces certain restraints, such as fluctuating raw material prices, stringent environmental regulations, and the cyclical nature of defense spending. Effective strategies for mitigating these challenges will be crucial for industry players to maintain sustained growth. The competitive landscape will remain intensely competitive, demanding continuous innovation and adaptation to evolving market dynamics.
Marine Vessel Industry Market Report: 2019-2033
This comprehensive report provides an in-depth analysis of the Marine Vessel Industry, encompassing market dynamics, growth trends, key players, and future outlook. With a focus on the parent market (Defense & Maritime) and child markets (e.g., Destroyers, Frigates, Submarines), this report is essential for industry professionals, investors, and strategic decision-makers. The study period covers 2019-2033, with a base year of 2025 and a forecast period of 2025-2033. The market size is presented in million units.
Marine Vessel Industry Market Dynamics & Structure
The global marine vessel market is characterized by moderate concentration, with a few major players holding significant market share. Technological innovation, driven by advancements in automation, AI, and propulsion systems, is a key growth driver. Stringent regulatory frameworks concerning safety, emissions, and cybersecurity pose both challenges and opportunities. Competitive pressures stem from both established players and emerging entrants. The market exhibits diverse end-user demographics, including navies, coast guards, commercial shipping companies, and offshore energy operators. M&A activity has been relatively frequent, consolidating the industry landscape.
- Market Concentration: The top 5 players hold approximately xx% of the global market share in 2025.
- Technological Innovation: Focus on autonomous vessels, advanced sensors, and hybrid/electric propulsion systems.
- Regulatory Landscape: Compliance with IMO regulations and national defense standards.
- Competitive Landscape: Intense competition driven by price, innovation, and lifecycle management services.
- M&A Activity: xx major M&A deals were recorded between 2019 and 2024, valued at approximately $xx billion.
- Innovation Barriers: High R&D costs and lengthy certification processes.
Marine Vessel Industry Growth Trends & Insights
The marine vessel market exhibited a CAGR of xx% during the historical period (2019-2024) and is projected to grow at a CAGR of xx% during the forecast period (2025-2033). This growth is fueled by rising defense budgets globally, increasing demand for maritime security, and the expansion of offshore energy activities. Technological disruptions, such as the adoption of autonomous navigation and advanced materials, are reshaping the industry. Consumer behavior shifts include a greater focus on sustainability and operational efficiency. The market penetration of advanced technologies remains relatively low, with significant growth potential. By 2033, the global market size is expected to reach $xx billion.
Dominant Regions, Countries, or Segments in Marine Vessel Industry
The Asia-Pacific region is currently the dominant market for marine vessels, driven by strong demand from China, India, and other Southeast Asian nations. Within vessel types, the demand for frigates and corvettes is particularly high, given their versatility and cost-effectiveness for coastal defense and patrol operations.
- Key Drivers:
- Asia-Pacific: High defense spending, growing maritime trade, and expanding offshore energy exploration.
- Europe: Focus on modernizing fleets and collaborations on defense projects.
- North America: Significant investment in naval modernization programs.
- Dominant Segments: Frigates and corvettes account for xx% of the total market, followed by destroyers (xx%) and submarines (xx%). Aircraft carriers represent a smaller but strategically crucial segment.
- Growth Potential: Substantial growth is projected in the demand for unmanned and autonomous marine vessels, particularly for commercial applications.
Marine Vessel Industry Product Landscape
The marine vessel industry features a diverse range of products, including destroyers, frigates, submarines, corvettes, and aircraft carriers, each with varying functionalities, capabilities, and technological advancements. Recent innovations include integrated combat systems, improved stealth capabilities, and the incorporation of AI-powered automation systems. Key performance metrics include speed, range, payload capacity, and survivability. Unique selling propositions often center on advanced sensors, superior weapon systems, and enhanced operational efficiency.
Key Drivers, Barriers & Challenges in Marine Vessel Industry
Key Drivers:
- Increasing global defense budgets.
- Growing demand for maritime security.
- Expansion of offshore energy activities.
- Technological advancements in vessel design and construction.
Key Challenges:
- High initial investment costs for advanced vessels.
- Stringent regulatory compliance requirements.
- Supply chain disruptions and material shortages.
- Intense competition from established and emerging players. The impact of these challenges is estimated to result in a xx% reduction in market growth by 2030.
Emerging Opportunities in Marine Vessel Industry
- Growing demand for unmanned and autonomous marine vessels.
- Increasing adoption of green technologies and sustainable shipbuilding practices.
- Expansion of commercial applications for marine vessels (e.g., offshore wind energy).
- Emergence of new materials and technologies improving vessel performance and longevity.
Growth Accelerators in the Marine Vessel Industry Industry
Technological breakthroughs in propulsion systems, automation, and sensor technology are key catalysts for long-term growth. Strategic partnerships between defense contractors and technology providers facilitate innovation. Expansion into new markets, particularly in the developing world, presents significant opportunities.
Key Players Shaping the Marine Vessel Industry Market
- Kalashnikov Group
- ThyssenKrupp AG
- General Dynamics Corporation
- Lockheed Martin Corporation
- China State Shipbuilding Corporation Limited
- Fr Lurssen Werft Gmbh & Co KG
- Naval Group SA
- BAE Systems PLC
- Austal Limited
- Huntington Ingalls Industries Inc
- EDGE Group PJSC
- HD Korea Shipbuilding & Offshore Engineering Co Ltd
- Navantia SA SME
- Hanwha Ocean (Hanwha Group)
- FINCANTIERI SpA
- Damen Shipyards Group
- LARSEN & TOUBRO LIMITED
- PT PAL Indonesia
Notable Milestones in Marine Vessel Industry Sector
- March 2023: The Indian Navy contracted Goa Shipyard (GSL) and Garden Reach Shipbuilders & Engineers (GRSE) to produce 11 offshore patrol vessels and six next-generation missile vessels.
- April 2023: The UK Ministry of Defence awarded a USD 57 million contract to BAE Systems plc to support communication, command, control, computer, and intelligence (C4I) services for surface vessels.
In-Depth Marine Vessel Industry Market Outlook
The future of the marine vessel market is bright, driven by technological advancements, increased defense spending, and the growth of offshore industries. Strategic partnerships and innovative business models will be crucial for success. The market is poised for significant expansion, with opportunities for both established players and new entrants. The continued focus on sustainability and autonomous technologies will further shape the industry landscape in the coming decade.
Marine Vessel Industry Segmentation
-
1. Vessel Type
- 1.1. Destroyers
- 1.2. Frigates
- 1.3. Submarines
- 1.4. Corvettes
- 1.5. Aircraft Carriers
- 1.6. Other Vessel Types
Marine Vessel Industry Segmentation By Geography
-
1. North America
- 1.1. United States
- 1.2. Canada
-
2. Europe
- 2.1. Germany
- 2.2. United Kingdom
- 2.3. France
- 2.4. Russia
- 2.5. Spain
- 2.6. Rest of Europe
-
3. Asia Pacific
- 3.1. China
- 3.2. India
- 3.3. Japan
- 3.4. South Korea
- 3.5. Australia
- 3.6. Singapore
- 3.7. Rest of Asia Pacific
-
4. Latin America
- 4.1. Brazil
- 4.2. Mexico
- 4.3. Rest of Latin America
-
5. Middle East and Africa
- 5.1. United Arab Emirates
- 5.2. Saudi Arabia
- 5.3. South Africa
- 5.4. Rest of Middle East and Africa
Marine Vessel Industry REPORT HIGHLIGHTS
| Aspects | Details |
|---|---|
| Study Period | 2019-2033 |
| Base Year | 2024 |
| Estimated Year | 2025 |
| Forecast Period | 2025-2033 |
| Historical Period | 2019-2024 |
| Growth Rate | CAGR of 6.46% from 2019-2033 |
| Segmentation |
|
Table of Contents
- 1. Introduction
- 1.1. Research Scope
- 1.2. Market Segmentation
- 1.3. Research Methodology
- 1.4. Definitions and Assumptions
- 2. Executive Summary
- 2.1. Introduction
- 3. Market Dynamics
- 3.1. Introduction
- 3.2. Market Drivers
- 3.3. Market Restrains
- 3.4. Market Trends
- 3.4.1. Submarines Segment is Expected to Witness Significant Growth During the Forecast Period
- 4. Market Factor Analysis
- 4.1. Porters Five Forces
- 4.2. Supply/Value Chain
- 4.3. PESTEL analysis
- 4.4. Market Entropy
- 4.5. Patent/Trademark Analysis
- 5. Global Marine Vessel Industry Analysis, Insights and Forecast, 2019-2031
- 5.1. Market Analysis, Insights and Forecast - by Vessel Type
- 5.1.1. Destroyers
- 5.1.2. Frigates
- 5.1.3. Submarines
- 5.1.4. Corvettes
- 5.1.5. Aircraft Carriers
- 5.1.6. Other Vessel Types
- 5.2. Market Analysis, Insights and Forecast - by Region
- 5.2.1. North America
- 5.2.2. Europe
- 5.2.3. Asia Pacific
- 5.2.4. Latin America
- 5.2.5. Middle East and Africa
- 5.1. Market Analysis, Insights and Forecast - by Vessel Type
- 6. North America Marine Vessel Industry Analysis, Insights and Forecast, 2019-2031
- 6.1. Market Analysis, Insights and Forecast - by Vessel Type
- 6.1.1. Destroyers
- 6.1.2. Frigates
- 6.1.3. Submarines
- 6.1.4. Corvettes
- 6.1.5. Aircraft Carriers
- 6.1.6. Other Vessel Types
- 6.1. Market Analysis, Insights and Forecast - by Vessel Type
- 7. Europe Marine Vessel Industry Analysis, Insights and Forecast, 2019-2031
- 7.1. Market Analysis, Insights and Forecast - by Vessel Type
- 7.1.1. Destroyers
- 7.1.2. Frigates
- 7.1.3. Submarines
- 7.1.4. Corvettes
- 7.1.5. Aircraft Carriers
- 7.1.6. Other Vessel Types
- 7.1. Market Analysis, Insights and Forecast - by Vessel Type
- 8. Asia Pacific Marine Vessel Industry Analysis, Insights and Forecast, 2019-2031
- 8.1. Market Analysis, Insights and Forecast - by Vessel Type
- 8.1.1. Destroyers
- 8.1.2. Frigates
- 8.1.3. Submarines
- 8.1.4. Corvettes
- 8.1.5. Aircraft Carriers
- 8.1.6. Other Vessel Types
- 8.1. Market Analysis, Insights and Forecast - by Vessel Type
- 9. Latin America Marine Vessel Industry Analysis, Insights and Forecast, 2019-2031
- 9.1. Market Analysis, Insights and Forecast - by Vessel Type
- 9.1.1. Destroyers
- 9.1.2. Frigates
- 9.1.3. Submarines
- 9.1.4. Corvettes
- 9.1.5. Aircraft Carriers
- 9.1.6. Other Vessel Types
- 9.1. Market Analysis, Insights and Forecast - by Vessel Type
- 10. Middle East and Africa Marine Vessel Industry Analysis, Insights and Forecast, 2019-2031
- 10.1. Market Analysis, Insights and Forecast - by Vessel Type
- 10.1.1. Destroyers
- 10.1.2. Frigates
- 10.1.3. Submarines
- 10.1.4. Corvettes
- 10.1.5. Aircraft Carriers
- 10.1.6. Other Vessel Types
- 10.1. Market Analysis, Insights and Forecast - by Vessel Type
- 11. North America Marine Vessel Industry Analysis, Insights and Forecast, 2019-2031
- 11.1. Market Analysis, Insights and Forecast - By Country/Sub-region
- 11.1.1 United States
- 11.1.2 Canada
- 12. Europe Marine Vessel Industry Analysis, Insights and Forecast, 2019-2031
- 12.1. Market Analysis, Insights and Forecast - By Country/Sub-region
- 12.1.1 Germany
- 12.1.2 United Kingdom
- 12.1.3 France
- 12.1.4 Russia
- 12.1.5 Spain
- 12.1.6 Rest of Europe
- 13. Asia Pacific Marine Vessel Industry Analysis, Insights and Forecast, 2019-2031
- 13.1. Market Analysis, Insights and Forecast - By Country/Sub-region
- 13.1.1 China
- 13.1.2 India
- 13.1.3 Japan
- 13.1.4 South Korea
- 13.1.5 Australia
- 13.1.6 Singapore
- 13.1.7 Rest of Asia Pacific
- 14. Latin America Marine Vessel Industry Analysis, Insights and Forecast, 2019-2031
- 14.1. Market Analysis, Insights and Forecast - By Country/Sub-region
- 14.1.1 Brazil
- 14.1.2 Mexico
- 14.1.3 Rest of Latin America
- 15. Middle East and Africa Marine Vessel Industry Analysis, Insights and Forecast, 2019-2031
- 15.1. Market Analysis, Insights and Forecast - By Country/Sub-region
- 15.1.1 United Arab Emirates
- 15.1.2 Saudi Arabia
- 15.1.3 South Africa
- 15.1.4 Rest of Middle East and Africa
- 16. Competitive Analysis
- 16.1. Global Market Share Analysis 2024
- 16.2. Company Profiles
- 16.2.1 Kalashnikov Group
- 16.2.1.1. Overview
- 16.2.1.2. Products
- 16.2.1.3. SWOT Analysis
- 16.2.1.4. Recent Developments
- 16.2.1.5. Financials (Based on Availability)
- 16.2.2 ThyssenKrupp AG
- 16.2.2.1. Overview
- 16.2.2.2. Products
- 16.2.2.3. SWOT Analysis
- 16.2.2.4. Recent Developments
- 16.2.2.5. Financials (Based on Availability)
- 16.2.3 General Dynamics Corporation
- 16.2.3.1. Overview
- 16.2.3.2. Products
- 16.2.3.3. SWOT Analysis
- 16.2.3.4. Recent Developments
- 16.2.3.5. Financials (Based on Availability)
- 16.2.4 Lockheed Martin Corporation
- 16.2.4.1. Overview
- 16.2.4.2. Products
- 16.2.4.3. SWOT Analysis
- 16.2.4.4. Recent Developments
- 16.2.4.5. Financials (Based on Availability)
- 16.2.5 China State Shipbuilding Corporation Limite
- 16.2.5.1. Overview
- 16.2.5.2. Products
- 16.2.5.3. SWOT Analysis
- 16.2.5.4. Recent Developments
- 16.2.5.5. Financials (Based on Availability)
- 16.2.6 Fr Lurssen Werft Gmbh & Co KG
- 16.2.6.1. Overview
- 16.2.6.2. Products
- 16.2.6.3. SWOT Analysis
- 16.2.6.4. Recent Developments
- 16.2.6.5. Financials (Based on Availability)
- 16.2.7 Naval Group SA
- 16.2.7.1. Overview
- 16.2.7.2. Products
- 16.2.7.3. SWOT Analysis
- 16.2.7.4. Recent Developments
- 16.2.7.5. Financials (Based on Availability)
- 16.2.8 BAE Systems PLC
- 16.2.8.1. Overview
- 16.2.8.2. Products
- 16.2.8.3. SWOT Analysis
- 16.2.8.4. Recent Developments
- 16.2.8.5. Financials (Based on Availability)
- 16.2.9 Austal Limited
- 16.2.9.1. Overview
- 16.2.9.2. Products
- 16.2.9.3. SWOT Analysis
- 16.2.9.4. Recent Developments
- 16.2.9.5. Financials (Based on Availability)
- 16.2.10 Huntington Ingalls Industries Inc
- 16.2.10.1. Overview
- 16.2.10.2. Products
- 16.2.10.3. SWOT Analysis
- 16.2.10.4. Recent Developments
- 16.2.10.5. Financials (Based on Availability)
- 16.2.11 EDGE Group PJSC
- 16.2.11.1. Overview
- 16.2.11.2. Products
- 16.2.11.3. SWOT Analysis
- 16.2.11.4. Recent Developments
- 16.2.11.5. Financials (Based on Availability)
- 16.2.12 HD Korea Shipbuilding & Offshore Engineering Co Ltd
- 16.2.12.1. Overview
- 16.2.12.2. Products
- 16.2.12.3. SWOT Analysis
- 16.2.12.4. Recent Developments
- 16.2.12.5. Financials (Based on Availability)
- 16.2.13 Navantia SA SME
- 16.2.13.1. Overview
- 16.2.13.2. Products
- 16.2.13.3. SWOT Analysis
- 16.2.13.4. Recent Developments
- 16.2.13.5. Financials (Based on Availability)
- 16.2.14 Hanwha Ocean (Hanwha Group)
- 16.2.14.1. Overview
- 16.2.14.2. Products
- 16.2.14.3. SWOT Analysis
- 16.2.14.4. Recent Developments
- 16.2.14.5. Financials (Based on Availability)
- 16.2.15 FINCANTIERI SpA
- 16.2.15.1. Overview
- 16.2.15.2. Products
- 16.2.15.3. SWOT Analysis
- 16.2.15.4. Recent Developments
- 16.2.15.5. Financials (Based on Availability)
- 16.2.16 Damen Shipyards Group
- 16.2.16.1. Overview
- 16.2.16.2. Products
- 16.2.16.3. SWOT Analysis
- 16.2.16.4. Recent Developments
- 16.2.16.5. Financials (Based on Availability)
- 16.2.17 LARSEN & TOUBRO LIMITED6 3 Other Players
- 16.2.17.1. Overview
- 16.2.17.2. Products
- 16.2.17.3. SWOT Analysis
- 16.2.17.4. Recent Developments
- 16.2.17.5. Financials (Based on Availability)
- 16.2.18 PT PAL Indonesia
- 16.2.18.1. Overview
- 16.2.18.2. Products
- 16.2.18.3. SWOT Analysis
- 16.2.18.4. Recent Developments
- 16.2.18.5. Financials (Based on Availability)
- 16.2.1 Kalashnikov Group
List of Figures
- Figure 1: Global Marine Vessel Industry Revenue Breakdown (Million, %) by Region 2024 & 2032
- Figure 2: North America Marine Vessel Industry Revenue (Million), by Country 2024 & 2032
- Figure 3: North America Marine Vessel Industry Revenue Share (%), by Country 2024 & 2032
- Figure 4: Europe Marine Vessel Industry Revenue (Million), by Country 2024 & 2032
- Figure 5: Europe Marine Vessel Industry Revenue Share (%), by Country 2024 & 2032
- Figure 6: Asia Pacific Marine Vessel Industry Revenue (Million), by Country 2024 & 2032
- Figure 7: Asia Pacific Marine Vessel Industry Revenue Share (%), by Country 2024 & 2032
- Figure 8: Latin America Marine Vessel Industry Revenue (Million), by Country 2024 & 2032
- Figure 9: Latin America Marine Vessel Industry Revenue Share (%), by Country 2024 & 2032
- Figure 10: Middle East and Africa Marine Vessel Industry Revenue (Million), by Country 2024 & 2032
- Figure 11: Middle East and Africa Marine Vessel Industry Revenue Share (%), by Country 2024 & 2032
- Figure 12: North America Marine Vessel Industry Revenue (Million), by Vessel Type 2024 & 2032
- Figure 13: North America Marine Vessel Industry Revenue Share (%), by Vessel Type 2024 & 2032
- Figure 14: North America Marine Vessel Industry Revenue (Million), by Country 2024 & 2032
- Figure 15: North America Marine Vessel Industry Revenue Share (%), by Country 2024 & 2032
- Figure 16: Europe Marine Vessel Industry Revenue (Million), by Vessel Type 2024 & 2032
- Figure 17: Europe Marine Vessel Industry Revenue Share (%), by Vessel Type 2024 & 2032
- Figure 18: Europe Marine Vessel Industry Revenue (Million), by Country 2024 & 2032
- Figure 19: Europe Marine Vessel Industry Revenue Share (%), by Country 2024 & 2032
- Figure 20: Asia Pacific Marine Vessel Industry Revenue (Million), by Vessel Type 2024 & 2032
- Figure 21: Asia Pacific Marine Vessel Industry Revenue Share (%), by Vessel Type 2024 & 2032
- Figure 22: Asia Pacific Marine Vessel Industry Revenue (Million), by Country 2024 & 2032
- Figure 23: Asia Pacific Marine Vessel Industry Revenue Share (%), by Country 2024 & 2032
- Figure 24: Latin America Marine Vessel Industry Revenue (Million), by Vessel Type 2024 & 2032
- Figure 25: Latin America Marine Vessel Industry Revenue Share (%), by Vessel Type 2024 & 2032
- Figure 26: Latin America Marine Vessel Industry Revenue (Million), by Country 2024 & 2032
- Figure 27: Latin America Marine Vessel Industry Revenue Share (%), by Country 2024 & 2032
- Figure 28: Middle East and Africa Marine Vessel Industry Revenue (Million), by Vessel Type 2024 & 2032
- Figure 29: Middle East and Africa Marine Vessel Industry Revenue Share (%), by Vessel Type 2024 & 2032
- Figure 30: Middle East and Africa Marine Vessel Industry Revenue (Million), by Country 2024 & 2032
- Figure 31: Middle East and Africa Marine Vessel Industry Revenue Share (%), by Country 2024 & 2032
List of Tables
- Table 1: Global Marine Vessel Industry Revenue Million Forecast, by Region 2019 & 2032
- Table 2: Global Marine Vessel Industry Revenue Million Forecast, by Vessel Type 2019 & 2032
- Table 3: Global Marine Vessel Industry Revenue Million Forecast, by Region 2019 & 2032
- Table 4: Global Marine Vessel Industry Revenue Million Forecast, by Country 2019 & 2032
- Table 5: United States Marine Vessel Industry Revenue (Million) Forecast, by Application 2019 & 2032
- Table 6: Canada Marine Vessel Industry Revenue (Million) Forecast, by Application 2019 & 2032
- Table 7: Global Marine Vessel Industry Revenue Million Forecast, by Country 2019 & 2032
- Table 8: Germany Marine Vessel Industry Revenue (Million) Forecast, by Application 2019 & 2032
- Table 9: United Kingdom Marine Vessel Industry Revenue (Million) Forecast, by Application 2019 & 2032
- Table 10: France Marine Vessel Industry Revenue (Million) Forecast, by Application 2019 & 2032
- Table 11: Russia Marine Vessel Industry Revenue (Million) Forecast, by Application 2019 & 2032
- Table 12: Spain Marine Vessel Industry Revenue (Million) Forecast, by Application 2019 & 2032
- Table 13: Rest of Europe Marine Vessel Industry Revenue (Million) Forecast, by Application 2019 & 2032
- Table 14: Global Marine Vessel Industry Revenue Million Forecast, by Country 2019 & 2032
- Table 15: China Marine Vessel Industry Revenue (Million) Forecast, by Application 2019 & 2032
- Table 16: India Marine Vessel Industry Revenue (Million) Forecast, by Application 2019 & 2032
- Table 17: Japan Marine Vessel Industry Revenue (Million) Forecast, by Application 2019 & 2032
- Table 18: South Korea Marine Vessel Industry Revenue (Million) Forecast, by Application 2019 & 2032
- Table 19: Australia Marine Vessel Industry Revenue (Million) Forecast, by Application 2019 & 2032
- Table 20: Singapore Marine Vessel Industry Revenue (Million) Forecast, by Application 2019 & 2032
- Table 21: Rest of Asia Pacific Marine Vessel Industry Revenue (Million) Forecast, by Application 2019 & 2032
- Table 22: Global Marine Vessel Industry Revenue Million Forecast, by Country 2019 & 2032
- Table 23: Brazil Marine Vessel Industry Revenue (Million) Forecast, by Application 2019 & 2032
- Table 24: Mexico Marine Vessel Industry Revenue (Million) Forecast, by Application 2019 & 2032
- Table 25: Rest of Latin America Marine Vessel Industry Revenue (Million) Forecast, by Application 2019 & 2032
- Table 26: Global Marine Vessel Industry Revenue Million Forecast, by Country 2019 & 2032
- Table 27: United Arab Emirates Marine Vessel Industry Revenue (Million) Forecast, by Application 2019 & 2032
- Table 28: Saudi Arabia Marine Vessel Industry Revenue (Million) Forecast, by Application 2019 & 2032
- Table 29: South Africa Marine Vessel Industry Revenue (Million) Forecast, by Application 2019 & 2032
- Table 30: Rest of Middle East and Africa Marine Vessel Industry Revenue (Million) Forecast, by Application 2019 & 2032
- Table 31: Global Marine Vessel Industry Revenue Million Forecast, by Vessel Type 2019 & 2032
- Table 32: Global Marine Vessel Industry Revenue Million Forecast, by Country 2019 & 2032
- Table 33: United States Marine Vessel Industry Revenue (Million) Forecast, by Application 2019 & 2032
- Table 34: Canada Marine Vessel Industry Revenue (Million) Forecast, by Application 2019 & 2032
- Table 35: Global Marine Vessel Industry Revenue Million Forecast, by Vessel Type 2019 & 2032
- Table 36: Global Marine Vessel Industry Revenue Million Forecast, by Country 2019 & 2032
- Table 37: Germany Marine Vessel Industry Revenue (Million) Forecast, by Application 2019 & 2032
- Table 38: United Kingdom Marine Vessel Industry Revenue (Million) Forecast, by Application 2019 & 2032
- Table 39: France Marine Vessel Industry Revenue (Million) Forecast, by Application 2019 & 2032
- Table 40: Russia Marine Vessel Industry Revenue (Million) Forecast, by Application 2019 & 2032
- Table 41: Spain Marine Vessel Industry Revenue (Million) Forecast, by Application 2019 & 2032
- Table 42: Rest of Europe Marine Vessel Industry Revenue (Million) Forecast, by Application 2019 & 2032
- Table 43: Global Marine Vessel Industry Revenue Million Forecast, by Vessel Type 2019 & 2032
- Table 44: Global Marine Vessel Industry Revenue Million Forecast, by Country 2019 & 2032
- Table 45: China Marine Vessel Industry Revenue (Million) Forecast, by Application 2019 & 2032
- Table 46: India Marine Vessel Industry Revenue (Million) Forecast, by Application 2019 & 2032
- Table 47: Japan Marine Vessel Industry Revenue (Million) Forecast, by Application 2019 & 2032
- Table 48: South Korea Marine Vessel Industry Revenue (Million) Forecast, by Application 2019 & 2032
- Table 49: Australia Marine Vessel Industry Revenue (Million) Forecast, by Application 2019 & 2032
- Table 50: Singapore Marine Vessel Industry Revenue (Million) Forecast, by Application 2019 & 2032
- Table 51: Rest of Asia Pacific Marine Vessel Industry Revenue (Million) Forecast, by Application 2019 & 2032
- Table 52: Global Marine Vessel Industry Revenue Million Forecast, by Vessel Type 2019 & 2032
- Table 53: Global Marine Vessel Industry Revenue Million Forecast, by Country 2019 & 2032
- Table 54: Brazil Marine Vessel Industry Revenue (Million) Forecast, by Application 2019 & 2032
- Table 55: Mexico Marine Vessel Industry Revenue (Million) Forecast, by Application 2019 & 2032
- Table 56: Rest of Latin America Marine Vessel Industry Revenue (Million) Forecast, by Application 2019 & 2032
- Table 57: Global Marine Vessel Industry Revenue Million Forecast, by Vessel Type 2019 & 2032
- Table 58: Global Marine Vessel Industry Revenue Million Forecast, by Country 2019 & 2032
- Table 59: United Arab Emirates Marine Vessel Industry Revenue (Million) Forecast, by Application 2019 & 2032
- Table 60: Saudi Arabia Marine Vessel Industry Revenue (Million) Forecast, by Application 2019 & 2032
- Table 61: South Africa Marine Vessel Industry Revenue (Million) Forecast, by Application 2019 & 2032
- Table 62: Rest of Middle East and Africa Marine Vessel Industry Revenue (Million) Forecast, by Application 2019 & 2032
Frequently Asked Questions
1. What is the projected Compound Annual Growth Rate (CAGR) of the Marine Vessel Industry?
The projected CAGR is approximately 6.46%.
2. Which companies are prominent players in the Marine Vessel Industry?
Key companies in the market include Kalashnikov Group, ThyssenKrupp AG, General Dynamics Corporation, Lockheed Martin Corporation, China State Shipbuilding Corporation Limite, Fr Lurssen Werft Gmbh & Co KG, Naval Group SA, BAE Systems PLC, Austal Limited, Huntington Ingalls Industries Inc, EDGE Group PJSC, HD Korea Shipbuilding & Offshore Engineering Co Ltd, Navantia SA SME, Hanwha Ocean (Hanwha Group), FINCANTIERI SpA, Damen Shipyards Group, LARSEN & TOUBRO LIMITED6 3 Other Players, PT PAL Indonesia.
3. What are the main segments of the Marine Vessel Industry?
The market segments include Vessel Type.
4. Can you provide details about the market size?
The market size is estimated to be USD 109.39 Million as of 2022.
5. What are some drivers contributing to market growth?
N/A
6. What are the notable trends driving market growth?
Submarines Segment is Expected to Witness Significant Growth During the Forecast Period.
7. Are there any restraints impacting market growth?
N/A
8. Can you provide examples of recent developments in the market?
April 2023: The UK Ministry of Defence awarded a USD 57 million contract to BAE Systems plc to support communication, command, control, computer, and intelligence (C4I) services for surface vessels. According to the contract, BAE Systems will likely be able to help with C4I services and data deliverables throughout the five phases of shipboard integration.
9. What pricing options are available for accessing the report?
Pricing options include single-user, multi-user, and enterprise licenses priced at USD 4750, USD 5250, and USD 8750 respectively.
10. Is the market size provided in terms of value or volume?
The market size is provided in terms of value, measured in Million.
11. Are there any specific market keywords associated with the report?
Yes, the market keyword associated with the report is "Marine Vessel Industry," which aids in identifying and referencing the specific market segment covered.
12. How do I determine which pricing option suits my needs best?
The pricing options vary based on user requirements and access needs. Individual users may opt for single-user licenses, while businesses requiring broader access may choose multi-user or enterprise licenses for cost-effective access to the report.
13. Are there any additional resources or data provided in the Marine Vessel Industry report?
While the report offers comprehensive insights, it's advisable to review the specific contents or supplementary materials provided to ascertain if additional resources or data are available.
14. How can I stay updated on further developments or reports in the Marine Vessel Industry?
To stay informed about further developments, trends, and reports in the Marine Vessel Industry, consider subscribing to industry newsletters, following relevant companies and organizations, or regularly checking reputable industry news sources and publications.
Methodology
Step 1 - Identification of Relevant Samples Size from Population Database


Step 2 - Approaches for Defining Global Market Size (Value, Volume* & Price*)

Note*: In applicable scenarios
Step 3 - Data Sources
Primary Research
- Web Analytics
- Survey Reports
- Research Institute
- Latest Research Reports
- Opinion Leaders
Secondary Research
- Annual Reports
- White Paper
- Latest Press Release
- Industry Association
- Paid Database
- Investor Presentations

Step 4 - Data Triangulation
Involves using different sources of information in order to increase the validity of a study
These sources are likely to be stakeholders in a program - participants, other researchers, program staff, other community members, and so on.
Then we put all data in single framework & apply various statistical tools to find out the dynamic on the market.
During the analysis stage, feedback from the stakeholder groups would be compared to determine areas of agreement as well as areas of divergence


