

Key Insights
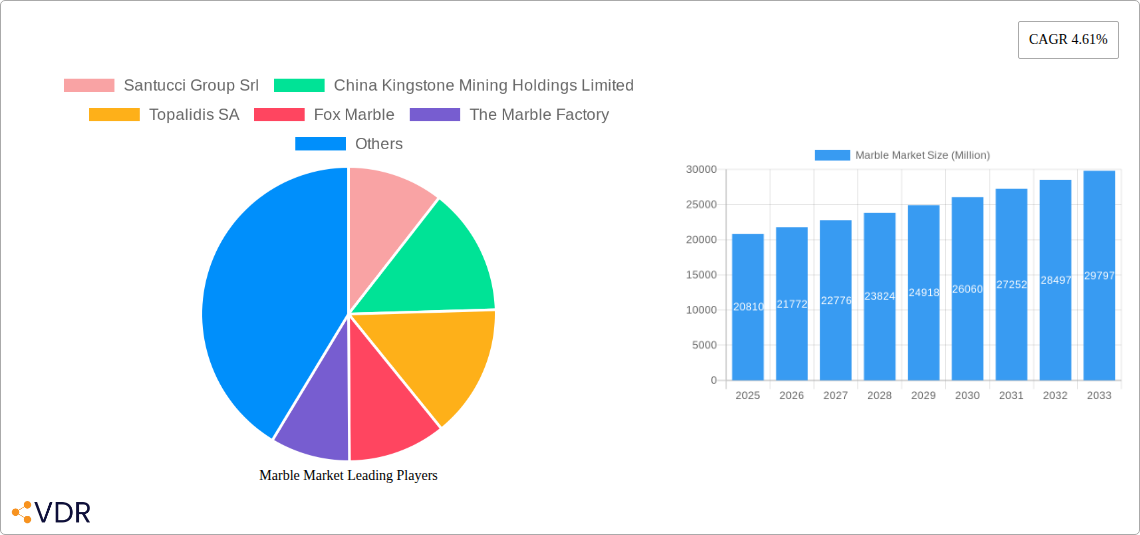
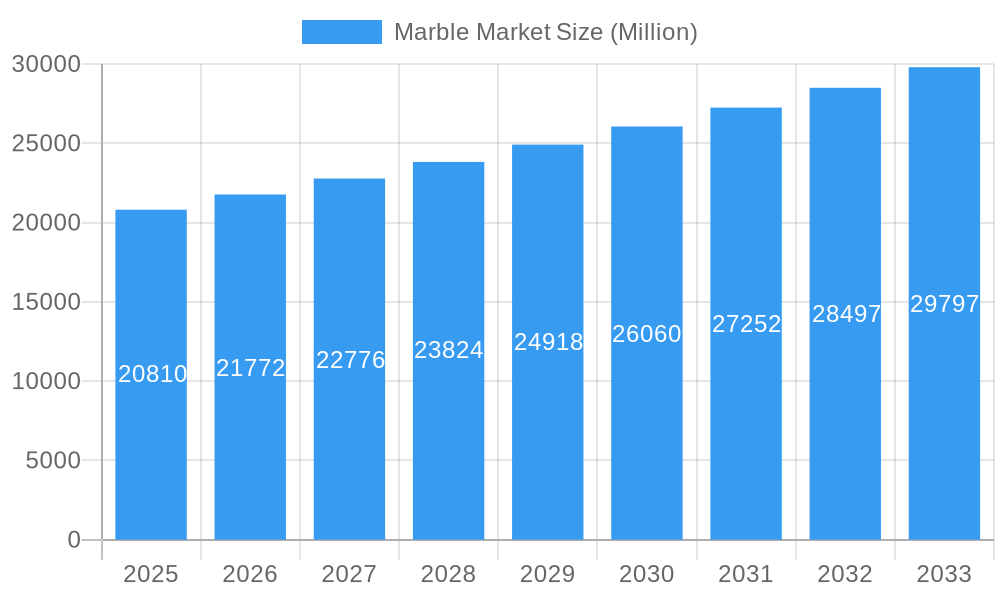
The global marble market, valued at $20.81 billion in 2025, is projected to experience steady growth, driven by a compound annual growth rate (CAGR) of 4.61% from 2025 to 2033. This growth is fueled by several key factors. The increasing popularity of marble in construction and decoration projects, particularly in high-end residential and commercial buildings, significantly boosts demand. Furthermore, the enduring aesthetic appeal of marble, its versatility in design applications (from flooring and countertops to statues and monuments), and its perceived value as a luxury material contribute to market expansion. The rising disposable incomes in developing economies, coupled with expanding urbanization and infrastructure development, further fuel market growth. However, the market faces certain restraints, including the high cost of marble extraction, processing, and transportation, as well as the availability of substitute materials like engineered stone and ceramic tiles. The market segmentation reveals a diverse landscape, with white and black marble holding dominant positions in the color segment, while the building and decoration application segment accounts for the largest share of market revenue. Leading companies such as Antolini Luigi & C SpA, Levantina, and Kangli Stone Group are key players, leveraging their established distribution networks and brand recognition to maintain market share. Competitive pressures will likely intensify as new players enter the market, potentially driven by technological advancements in marble processing and sustainable extraction practices.
Marble Market Market Size (In Billion)
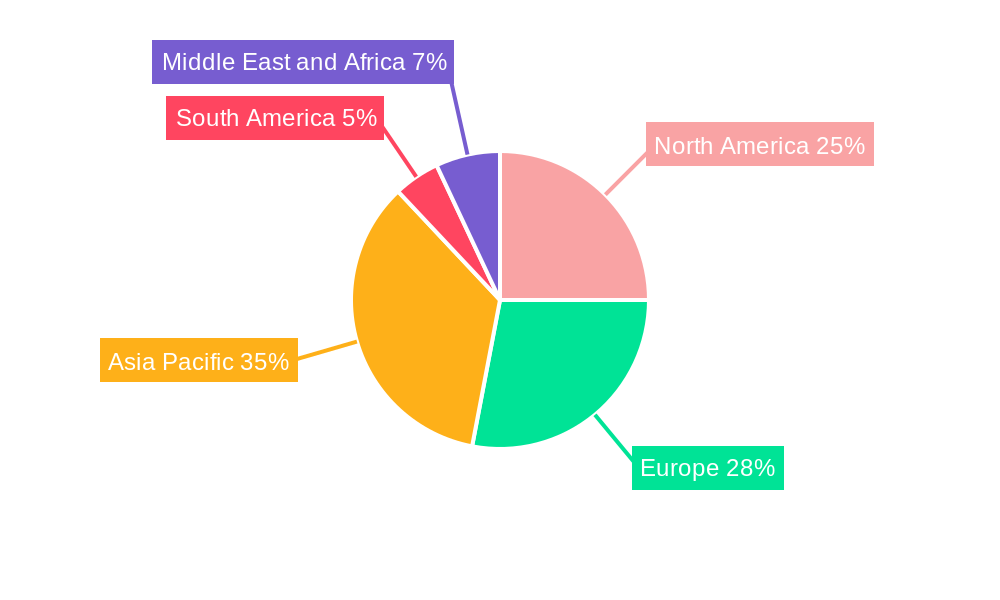
The regional distribution of the market reveals significant variations in demand. Asia Pacific, particularly China and India, is expected to remain a major growth driver due to rapid economic expansion and extensive infrastructure projects. North America and Europe will also contribute significantly, albeit with slower growth rates compared to Asia Pacific. The market's future trajectory depends on several factors, including global economic conditions, the volatility of raw material prices, and evolving consumer preferences. Sustainability concerns related to marble extraction and its environmental impact are gaining prominence, influencing both consumer choices and industry practices. Innovation in sustainable extraction techniques and the development of eco-friendly processing methods will be crucial for ensuring the long-term health and growth of the marble market. Companies are investing in technologies that reduce waste and improve resource efficiency to meet the increasing demand for environmentally responsible products.
Marble Market Company Market Share
Marble Market: A Comprehensive Market Report (2019-2033)
This comprehensive report provides an in-depth analysis of the global marble market, encompassing market dynamics, growth trends, regional segmentation, product landscape, key players, and future outlook. The study period covers 2019-2033, with 2025 as the base year and a forecast period of 2025-2033. The report is essential for industry professionals, investors, and strategic decision-makers seeking to navigate this dynamic market. Market values are presented in million units.
Marble Market Dynamics & Structure
The global marble market is characterized by a moderately consolidated structure with several key players commanding significant market share. However, a large number of smaller regional players also contribute to the overall market volume. Technological innovations, such as advanced cutting and polishing techniques, are driving efficiency and expanding design possibilities. Stringent regulatory frameworks concerning environmental impact and worker safety significantly influence operational costs and market accessibility. The market faces competition from alternative materials like engineered stone and ceramic tiles, forcing continuous innovation to maintain competitiveness. End-user demographics are diverse, encompassing residential, commercial, and monumental applications. M&A activity in the sector has been moderate, primarily focusing on consolidation and expansion into new markets.
- Market Concentration: Moderately consolidated, with top 10 players holding approximately xx% market share (2024).
- Technological Innovation: Focus on automation, precision cutting, and sustainable extraction methods.
- Regulatory Framework: Stringent environmental and safety regulations impacting operational costs.
- Competitive Substitutes: Engineered stone, ceramic tiles, and other natural stones posing significant competition.
- End-User Demographics: Diverse, spanning residential, commercial, monumental, and artistic applications.
- M&A Trends: Moderate activity, primarily driven by consolidation and geographical expansion. Estimated xx M&A deals in the past five years.
Marble Market Growth Trends & Insights
The global marble market experienced steady growth during the historical period (2019-2024), driven by robust demand from the construction and infrastructure sectors, particularly in developing economies. The market is projected to maintain a healthy CAGR of xx% during the forecast period (2025-2033), fueled by increasing urbanization, rising disposable incomes, and growing preference for premium building materials. Technological advancements are enhancing processing efficiency and product quality. Shifts in consumer preferences towards sustainable and ethically sourced materials are also shaping market trends. The market penetration of marble in different applications varies significantly, with the building and decoration sector maintaining its dominant position.
- Market Size (2024): xx Million Units
- CAGR (2025-2033): xx%
- Market Penetration (Building & Decoration, 2024): xx%
- Key Growth Drivers: Urbanization, infrastructure development, rising disposable incomes, and architectural preferences.
Dominant Regions, Countries, or Segments in Marble Market
The Asia-Pacific region, specifically China and India, dominates the global marble market due to large-scale infrastructure projects, rapid urbanization, and a growing middle class with increasing disposable income. Italy and Turkey are also significant producers and exporters of marble, benefiting from established expertise and abundant resources. Within the color segment, white marble maintains the largest market share, followed by black and other colors. The building and decoration application sector constitutes the dominant market segment, representing the majority of marble consumption.
- Leading Region: Asia-Pacific (China and India being key drivers).
- Leading Color Segment: White Marble
- Leading Application Segment: Building and Decoration
- Key Drivers (Asia-Pacific): Rapid urbanization, infrastructure development, rising construction activity.
- Key Drivers (Italy/Turkey): Established expertise, abundant resources, strong export capabilities.
Marble Market Product Landscape
The marble market offers a wide range of products, from raw blocks to highly processed tiles, slabs, and customized designs. Innovations focus on enhancing durability, aesthetic appeal, and ease of installation. Advanced techniques like water-jet cutting, polishing, and surface treatments allow for intricate designs and customized finishes. Unique selling propositions often center around the origin, color variations, and processing quality of the marble. Technological advancements continuously improve efficiency and product quality, supporting market expansion.
Key Drivers, Barriers & Challenges in Marble Market
Key Drivers: Growing construction activity, rising demand for premium building materials, technological advancements in processing and design, increasing urbanization in developing economies.
Key Challenges & Restraints: Fluctuations in raw material prices, environmental regulations impacting extraction and processing, competition from alternative materials, supply chain disruptions, and geopolitical instability affecting trade routes. These challenges can impact the market by reducing profitability and limiting growth. Estimated overall market impact of these challenges around xx% reduction on projected growth.
Emerging Opportunities in Marble Market
Emerging opportunities exist in sustainable marble sourcing and processing, expansion into niche applications like high-end furniture and interior design, tapping into the growing market for recycled and reclaimed marble, and leveraging advanced digital technologies for design and visualization. Moreover, exploring new geographic markets and strategic partnerships to enhance distribution networks presents significant opportunities for market expansion.
Growth Accelerators in the Marble Market Industry
Long-term growth in the marble market will be driven by several factors, including technological innovations leading to higher efficiency and superior products, strategic partnerships fostering expansion into new markets, and focused marketing efforts to highlight the unique qualities and sustainability aspects of marble. The construction industry's ongoing growth in various regions also fuels the industry’s expansion.
Key Players Shaping the Marble Market Market
- Santucci Group Srl
- China Kingstone Mining Holdings Limited
- Topalidis SA
- Fox Marble
- The Marble Factory
- Levantina y Asociados de Minerales S A
- Şimşekler Mermer
- Dimpomar
- BC Marble Products Ltd
- Temmer Marble
- FHL I Kiriakidis Marbles and Granites SA
- Universal Marble & Granite Group Ltd
- Tekmar
- Daltile
- Antolini Luigi & C SpA
- Kangli stone group
- Xishi Group Ltd
- Hilltop Granite
- HELLENIC GRANITE Co
- Indiana Limestone Company (A Polycor Inc Company)
- Mumal Marble
- Best Cheer Stone
Notable Milestones in Marble Market Sector
- November 2021: Fox Marble signed a joint venture agreement with the Al Bab Al Mumtaz Group in the UAE, expanding its market reach in the Middle East.
In-Depth Marble Market Market Outlook
The future of the marble market looks promising, with continued growth driven by technological advancements, strategic partnerships, and increasing demand from emerging economies. Strategic focus on sustainable practices, innovative product design, and expansion into new applications will be crucial for long-term success in this dynamic and competitive market. The market's potential is significant, especially in regions with robust infrastructure development and growing consumer preferences for high-quality building materials.
Marble Market Segmentation
-
1. Color
- 1.1. White
- 1.2. Black
- 1.3. Yellow
- 1.4. Red
- 1.5. Other Colors
-
2. Application
- 2.1. Building and Decoration
- 2.2. Statues and Monuments
- 2.3. Furniture
- 2.4. Other Applications
Marble Market Segmentation By Geography
-
1. Asia Pacific
- 1.1. China
- 1.2. India
- 1.3. Japan
- 1.4. South Korea
- 1.5. Rest of Asia Pacific
-
2. North America
- 2.1. United States
- 2.2. Canada
- 2.3. Mexico
-
3. Europe
- 3.1. Germany
- 3.2. United Kingdom
- 3.3. France
- 3.4. Italy
- 3.5. Turkey
- 3.6. Rest of Europe
-
4. South America
- 4.1. Brazil
- 4.2. Argentina
- 4.3. Rest of South America
-
5. Middle East and Africa
- 5.1. Saudi Arabia
- 5.2. South Africa
- 5.3. Rest of Middle East and Africa
Marble Market Regional Market Share
Geographic Coverage of Marble Market
Marble Market REPORT HIGHLIGHTS
| Aspects | Details |
|---|---|
| Study Period | 2020-2034 |
| Base Year | 2025 |
| Estimated Year | 2026 |
| Forecast Period | 2026-2034 |
| Historical Period | 2020-2025 |
| Growth Rate | CAGR of 4.61% from 2020-2034 |
| Segmentation |
|
Table of Contents
- 1. Introduction
- 1.1. Research Scope
- 1.2. Market Segmentation
- 1.3. Research Objective
- 1.4. Definitions and Assumptions
- 2. Executive Summary
- 2.1. Market Snapshot
- 3. Market Dynamics
- 3.1. Market Drivers
- 3.2. Market Restrains
- 3.3. Market Trends
- 3.4. Market Opportunities
- 4. Market Factor Analysis
- 4.1. Porters Five Forces
- 4.1.1. Bargaining Power of Suppliers
- 4.1.2. Bargaining Power of Buyers
- 4.1.3. Threat of New Entrants
- 4.1.4. Threat of Substitutes
- 4.1.5. Competitive Rivalry
- 4.2. PESTEL analysis
- 4.3. BCG Analysis
- 4.3.1. Stars (High Growth, High Market Share)
- 4.3.2. Cash Cows (Low Growth, High Market Share)
- 4.3.3. Question Mark (High Growth, Low Market Share)
- 4.3.4. Dogs (Low Growth, Low Market Share)
- 4.4. Ansoff Matrix Analysis
- 4.5. Supply Chain Analysis
- 4.6. Regulatory Landscape
- 4.7. Current Market Potential and Opportunity Assessment (TAM–SAM–SOM Framework)
- 4.8. VDR Analyst Note
- 4.1. Porters Five Forces
- 5. Market Analysis, Insights and Forecast 2021-2033
- 5.1. Market Analysis, Insights and Forecast - by Color
- 5.1.1. White
- 5.1.2. Black
- 5.1.3. Yellow
- 5.1.4. Red
- 5.1.5. Other Colors
- 5.2. Market Analysis, Insights and Forecast - by Application
- 5.2.1. Building and Decoration
- 5.2.2. Statues and Monuments
- 5.2.3. Furniture
- 5.2.4. Other Applications
- 5.3. Market Analysis, Insights and Forecast - by Region
- 5.3.1. Asia Pacific
- 5.3.2. North America
- 5.3.3. Europe
- 5.3.4. South America
- 5.3.5. Middle East and Africa
- 5.1. Market Analysis, Insights and Forecast - by Color
- 6. Global Marble Market Analysis, Insights and Forecast, 2021-2033
- 6.1. Market Analysis, Insights and Forecast - by Color
- 6.1.1. White
- 6.1.2. Black
- 6.1.3. Yellow
- 6.1.4. Red
- 6.1.5. Other Colors
- 6.2. Market Analysis, Insights and Forecast - by Application
- 6.2.1. Building and Decoration
- 6.2.2. Statues and Monuments
- 6.2.3. Furniture
- 6.2.4. Other Applications
- 6.1. Market Analysis, Insights and Forecast - by Color
- 7. Asia Pacific Marble Market Analysis, Insights and Forecast, 2021-2033
- 7.1. Market Analysis, Insights and Forecast - by Color
- 7.1.1. White
- 7.1.2. Black
- 7.1.3. Yellow
- 7.1.4. Red
- 7.1.5. Other Colors
- 7.2. Market Analysis, Insights and Forecast - by Application
- 7.2.1. Building and Decoration
- 7.2.2. Statues and Monuments
- 7.2.3. Furniture
- 7.2.4. Other Applications
- 7.1. Market Analysis, Insights and Forecast - by Color
- 8. North America Marble Market Analysis, Insights and Forecast, 2021-2033
- 8.1. Market Analysis, Insights and Forecast - by Color
- 8.1.1. White
- 8.1.2. Black
- 8.1.3. Yellow
- 8.1.4. Red
- 8.1.5. Other Colors
- 8.2. Market Analysis, Insights and Forecast - by Application
- 8.2.1. Building and Decoration
- 8.2.2. Statues and Monuments
- 8.2.3. Furniture
- 8.2.4. Other Applications
- 8.1. Market Analysis, Insights and Forecast - by Color
- 9. Europe Marble Market Analysis, Insights and Forecast, 2021-2033
- 9.1. Market Analysis, Insights and Forecast - by Color
- 9.1.1. White
- 9.1.2. Black
- 9.1.3. Yellow
- 9.1.4. Red
- 9.1.5. Other Colors
- 9.2. Market Analysis, Insights and Forecast - by Application
- 9.2.1. Building and Decoration
- 9.2.2. Statues and Monuments
- 9.2.3. Furniture
- 9.2.4. Other Applications
- 9.1. Market Analysis, Insights and Forecast - by Color
- 10. South America Marble Market Analysis, Insights and Forecast, 2021-2033
- 10.1. Market Analysis, Insights and Forecast - by Color
- 10.1.1. White
- 10.1.2. Black
- 10.1.3. Yellow
- 10.1.4. Red
- 10.1.5. Other Colors
- 10.2. Market Analysis, Insights and Forecast - by Application
- 10.2.1. Building and Decoration
- 10.2.2. Statues and Monuments
- 10.2.3. Furniture
- 10.2.4. Other Applications
- 10.1. Market Analysis, Insights and Forecast - by Color
- 11. Middle East and Africa Marble Market Analysis, Insights and Forecast, 2021-2033
- 11.1. Market Analysis, Insights and Forecast - by Color
- 11.1.1. White
- 11.1.2. Black
- 11.1.3. Yellow
- 11.1.4. Red
- 11.1.5. Other Colors
- 11.2. Market Analysis, Insights and Forecast - by Application
- 11.2.1. Building and Decoration
- 11.2.2. Statues and Monuments
- 11.2.3. Furniture
- 11.2.4. Other Applications
- 11.1. Market Analysis, Insights and Forecast - by Color
- 12. Competitive Analysis
- 12.1. Company Profiles
- 12.1.1 Santucci Group Srl
- 12.1.1.1. Company Overview
- 12.1.1.2. Products
- 12.1.1.3. Company Financials
- 12.1.1.4. SWOT Analysis
- 12.1.2 China Kingstone Mining Holdings Limited
- 12.1.2.1. Company Overview
- 12.1.2.2. Products
- 12.1.2.3. Company Financials
- 12.1.2.4. SWOT Analysis
- 12.1.3 Topalidis SA
- 12.1.3.1. Company Overview
- 12.1.3.2. Products
- 12.1.3.3. Company Financials
- 12.1.3.4. SWOT Analysis
- 12.1.4 Fox Marble
- 12.1.4.1. Company Overview
- 12.1.4.2. Products
- 12.1.4.3. Company Financials
- 12.1.4.4. SWOT Analysis
- 12.1.5 The Marble Factory
- 12.1.5.1. Company Overview
- 12.1.5.2. Products
- 12.1.5.3. Company Financials
- 12.1.5.4. SWOT Analysis
- 12.1.6 Levantina y Asociados de Minerales S A
- 12.1.6.1. Company Overview
- 12.1.6.2. Products
- 12.1.6.3. Company Financials
- 12.1.6.4. SWOT Analysis
- 12.1.7 Şimşekler Mermer
- 12.1.7.1. Company Overview
- 12.1.7.2. Products
- 12.1.7.3. Company Financials
- 12.1.7.4. SWOT Analysis
- 12.1.8 Dimpomar
- 12.1.8.1. Company Overview
- 12.1.8.2. Products
- 12.1.8.3. Company Financials
- 12.1.8.4. SWOT Analysis
- 12.1.9 BC Marble Products Ltd
- 12.1.9.1. Company Overview
- 12.1.9.2. Products
- 12.1.9.3. Company Financials
- 12.1.9.4. SWOT Analysis
- 12.1.10 Temmer Marble
- 12.1.10.1. Company Overview
- 12.1.10.2. Products
- 12.1.10.3. Company Financials
- 12.1.10.4. SWOT Analysis
- 12.1.11 FHL I Kiriakidis Marbles and Granites SA
- 12.1.11.1. Company Overview
- 12.1.11.2. Products
- 12.1.11.3. Company Financials
- 12.1.11.4. SWOT Analysis
- 12.1.12 Universal Marble & Granite Group Ltd
- 12.1.12.1. Company Overview
- 12.1.12.2. Products
- 12.1.12.3. Company Financials
- 12.1.12.4. SWOT Analysis
- 12.1.13 Tekmar
- 12.1.13.1. Company Overview
- 12.1.13.2. Products
- 12.1.13.3. Company Financials
- 12.1.13.4. SWOT Analysis
- 12.1.14 Daltile
- 12.1.14.1. Company Overview
- 12.1.14.2. Products
- 12.1.14.3. Company Financials
- 12.1.14.4. SWOT Analysis
- 12.1.15 Antolini Luigi & C SpA
- 12.1.15.1. Company Overview
- 12.1.15.2. Products
- 12.1.15.3. Company Financials
- 12.1.15.4. SWOT Analysis
- 12.1.16 Kangli stone group
- 12.1.16.1. Company Overview
- 12.1.16.2. Products
- 12.1.16.3. Company Financials
- 12.1.16.4. SWOT Analysis
- 12.1.17 Xishi Group Ltd*List Not Exhaustive
- 12.1.17.1. Company Overview
- 12.1.17.2. Products
- 12.1.17.3. Company Financials
- 12.1.17.4. SWOT Analysis
- 12.1.18 Hilltop Granite
- 12.1.18.1. Company Overview
- 12.1.18.2. Products
- 12.1.18.3. Company Financials
- 12.1.18.4. SWOT Analysis
- 12.1.19 HELLENIC GRANITE Co
- 12.1.19.1. Company Overview
- 12.1.19.2. Products
- 12.1.19.3. Company Financials
- 12.1.19.4. SWOT Analysis
- 12.1.20 Indiana Limestone Company (A Polycor Inc Company)
- 12.1.20.1. Company Overview
- 12.1.20.2. Products
- 12.1.20.3. Company Financials
- 12.1.20.4. SWOT Analysis
- 12.1.21 Mumal Marble
- 12.1.21.1. Company Overview
- 12.1.21.2. Products
- 12.1.21.3. Company Financials
- 12.1.21.4. SWOT Analysis
- 12.1.22 Best Cheer Stone
- 12.1.22.1. Company Overview
- 12.1.22.2. Products
- 12.1.22.3. Company Financials
- 12.1.22.4. SWOT Analysis
- 12.1.1 Santucci Group Srl
- 12.2. Market Entropy
- 12.2.1 Company's Key Areas Served
- 12.2.2 Recent Developments
- 12.3. Company Market Share Analysis 2025
- 12.3.1 Top 5 Companies Market Share Analysis
- 12.3.2 Top 3 Companies Market Share Analysis
- 12.4. List of Potential Customers
- 13. Research Methodology
List of Figures
- Figure 1: Global Marble Market Revenue Breakdown (Million, %) by Region 2025 & 2033
- Figure 2: Asia Pacific Marble Market Revenue (Million), by Color 2025 & 2033
- Figure 3: Asia Pacific Marble Market Revenue Share (%), by Color 2025 & 2033
- Figure 4: Asia Pacific Marble Market Revenue (Million), by Application 2025 & 2033
- Figure 5: Asia Pacific Marble Market Revenue Share (%), by Application 2025 & 2033
- Figure 6: Asia Pacific Marble Market Revenue (Million), by Country 2025 & 2033
- Figure 7: Asia Pacific Marble Market Revenue Share (%), by Country 2025 & 2033
- Figure 8: North America Marble Market Revenue (Million), by Color 2025 & 2033
- Figure 9: North America Marble Market Revenue Share (%), by Color 2025 & 2033
- Figure 10: North America Marble Market Revenue (Million), by Application 2025 & 2033
- Figure 11: North America Marble Market Revenue Share (%), by Application 2025 & 2033
- Figure 12: North America Marble Market Revenue (Million), by Country 2025 & 2033
- Figure 13: North America Marble Market Revenue Share (%), by Country 2025 & 2033
- Figure 14: Europe Marble Market Revenue (Million), by Color 2025 & 2033
- Figure 15: Europe Marble Market Revenue Share (%), by Color 2025 & 2033
- Figure 16: Europe Marble Market Revenue (Million), by Application 2025 & 2033
- Figure 17: Europe Marble Market Revenue Share (%), by Application 2025 & 2033
- Figure 18: Europe Marble Market Revenue (Million), by Country 2025 & 2033
- Figure 19: Europe Marble Market Revenue Share (%), by Country 2025 & 2033
- Figure 20: South America Marble Market Revenue (Million), by Color 2025 & 2033
- Figure 21: South America Marble Market Revenue Share (%), by Color 2025 & 2033
- Figure 22: South America Marble Market Revenue (Million), by Application 2025 & 2033
- Figure 23: South America Marble Market Revenue Share (%), by Application 2025 & 2033
- Figure 24: South America Marble Market Revenue (Million), by Country 2025 & 2033
- Figure 25: South America Marble Market Revenue Share (%), by Country 2025 & 2033
- Figure 26: Middle East and Africa Marble Market Revenue (Million), by Color 2025 & 2033
- Figure 27: Middle East and Africa Marble Market Revenue Share (%), by Color 2025 & 2033
- Figure 28: Middle East and Africa Marble Market Revenue (Million), by Application 2025 & 2033
- Figure 29: Middle East and Africa Marble Market Revenue Share (%), by Application 2025 & 2033
- Figure 30: Middle East and Africa Marble Market Revenue (Million), by Country 2025 & 2033
- Figure 31: Middle East and Africa Marble Market Revenue Share (%), by Country 2025 & 2033
List of Tables
- Table 1: Global Marble Market Revenue Million Forecast, by Color 2020 & 2033
- Table 2: Global Marble Market Revenue Million Forecast, by Application 2020 & 2033
- Table 3: Global Marble Market Revenue Million Forecast, by Region 2020 & 2033
- Table 4: Global Marble Market Revenue Million Forecast, by Color 2020 & 2033
- Table 5: Global Marble Market Revenue Million Forecast, by Application 2020 & 2033
- Table 6: Global Marble Market Revenue Million Forecast, by Country 2020 & 2033
- Table 7: China Marble Market Revenue (Million) Forecast, by Application 2020 & 2033
- Table 8: India Marble Market Revenue (Million) Forecast, by Application 2020 & 2033
- Table 9: Japan Marble Market Revenue (Million) Forecast, by Application 2020 & 2033
- Table 10: South Korea Marble Market Revenue (Million) Forecast, by Application 2020 & 2033
- Table 11: Rest of Asia Pacific Marble Market Revenue (Million) Forecast, by Application 2020 & 2033
- Table 12: Global Marble Market Revenue Million Forecast, by Color 2020 & 2033
- Table 13: Global Marble Market Revenue Million Forecast, by Application 2020 & 2033
- Table 14: Global Marble Market Revenue Million Forecast, by Country 2020 & 2033
- Table 15: United States Marble Market Revenue (Million) Forecast, by Application 2020 & 2033
- Table 16: Canada Marble Market Revenue (Million) Forecast, by Application 2020 & 2033
- Table 17: Mexico Marble Market Revenue (Million) Forecast, by Application 2020 & 2033
- Table 18: Global Marble Market Revenue Million Forecast, by Color 2020 & 2033
- Table 19: Global Marble Market Revenue Million Forecast, by Application 2020 & 2033
- Table 20: Global Marble Market Revenue Million Forecast, by Country 2020 & 2033
- Table 21: Germany Marble Market Revenue (Million) Forecast, by Application 2020 & 2033
- Table 22: United Kingdom Marble Market Revenue (Million) Forecast, by Application 2020 & 2033
- Table 23: France Marble Market Revenue (Million) Forecast, by Application 2020 & 2033
- Table 24: Italy Marble Market Revenue (Million) Forecast, by Application 2020 & 2033
- Table 25: Turkey Marble Market Revenue (Million) Forecast, by Application 2020 & 2033
- Table 26: Rest of Europe Marble Market Revenue (Million) Forecast, by Application 2020 & 2033
- Table 27: Global Marble Market Revenue Million Forecast, by Color 2020 & 2033
- Table 28: Global Marble Market Revenue Million Forecast, by Application 2020 & 2033
- Table 29: Global Marble Market Revenue Million Forecast, by Country 2020 & 2033
- Table 30: Brazil Marble Market Revenue (Million) Forecast, by Application 2020 & 2033
- Table 31: Argentina Marble Market Revenue (Million) Forecast, by Application 2020 & 2033
- Table 32: Rest of South America Marble Market Revenue (Million) Forecast, by Application 2020 & 2033
- Table 33: Global Marble Market Revenue Million Forecast, by Color 2020 & 2033
- Table 34: Global Marble Market Revenue Million Forecast, by Application 2020 & 2033
- Table 35: Global Marble Market Revenue Million Forecast, by Country 2020 & 2033
- Table 36: Saudi Arabia Marble Market Revenue (Million) Forecast, by Application 2020 & 2033
- Table 37: South Africa Marble Market Revenue (Million) Forecast, by Application 2020 & 2033
- Table 38: Rest of Middle East and Africa Marble Market Revenue (Million) Forecast, by Application 2020 & 2033
Frequently Asked Questions
1. What is the projected Compound Annual Growth Rate (CAGR) of the Marble Market?
The projected CAGR is approximately 4.61%.
2. Which companies are prominent players in the Marble Market?
Key companies in the market include Santucci Group Srl, China Kingstone Mining Holdings Limited, Topalidis SA, Fox Marble, The Marble Factory, Levantina y Asociados de Minerales S A, Şimşekler Mermer, Dimpomar, BC Marble Products Ltd, Temmer Marble, FHL I Kiriakidis Marbles and Granites SA, Universal Marble & Granite Group Ltd, Tekmar, Daltile, Antolini Luigi & C SpA, Kangli stone group, Xishi Group Ltd*List Not Exhaustive, Hilltop Granite, HELLENIC GRANITE Co, Indiana Limestone Company (A Polycor Inc Company), Mumal Marble, Best Cheer Stone.
3. What are the main segments of the Marble Market?
The market segments include Color, Application.
4. Can you provide details about the market size?
The market size is estimated to be USD 20.81 Million as of 2022.
5. What are some drivers contributing to market growth?
Rapid Growth in the Construction Industry; Other Drivers.
6. What are the notable trends driving market growth?
Building and Decoration Segment to Dominate the Market.
7. Are there any restraints impacting market growth?
Health Hazard Related to Marble Dust.
8. Can you provide examples of recent developments in the market?
In November 2021, Fox Marble signed a joint venture agreement with the Al Bab Al Mumtaz Group in the United Arab Emirates. Under this agreement, Fox Marble will supply marble tiles and slabs processed in its factory in Kosovo to Al Bab Al Mumtaz Group for sale via its range of outlets in the region.
9. What pricing options are available for accessing the report?
Pricing options include single-user, multi-user, and enterprise licenses priced at USD 4750, USD 5250, and USD 8750 respectively.
10. Is the market size provided in terms of value or volume?
The market size is provided in terms of value, measured in Million.
11. Are there any specific market keywords associated with the report?
Yes, the market keyword associated with the report is "Marble Market," which aids in identifying and referencing the specific market segment covered.
12. How do I determine which pricing option suits my needs best?
The pricing options vary based on user requirements and access needs. Individual users may opt for single-user licenses, while businesses requiring broader access may choose multi-user or enterprise licenses for cost-effective access to the report.
13. Are there any additional resources or data provided in the Marble Market report?
While the report offers comprehensive insights, it's advisable to review the specific contents or supplementary materials provided to ascertain if additional resources or data are available.
14. How can I stay updated on further developments or reports in the Marble Market?
To stay informed about further developments, trends, and reports in the Marble Market, consider subscribing to industry newsletters, following relevant companies and organizations, or regularly checking reputable industry news sources and publications.
Methodology
Step 1 - Identification of Relevant Samples Size from Population Database


Step 2 - Approaches for Defining Global Market Size (Value, Volume* & Price*)

Note*: In applicable scenarios
Step 3 - Data Sources
Primary Research
- Web Analytics
- Survey Reports
- Research Institute
- Latest Research Reports
- Opinion Leaders
Secondary Research
- Annual Reports
- White Paper
- Latest Press Release
- Industry Association
- Paid Database
- Investor Presentations

Step 4 - Data Triangulation
Involves using different sources of information in order to increase the validity of a study
These sources are likely to be stakeholders in a program - participants, other researchers, program staff, other community members, and so on.
Then we put all data in single framework & apply various statistical tools to find out the dynamic on the market.
During the analysis stage, feedback from the stakeholder groups would be compared to determine areas of agreement as well as areas of divergence