
Key Insights
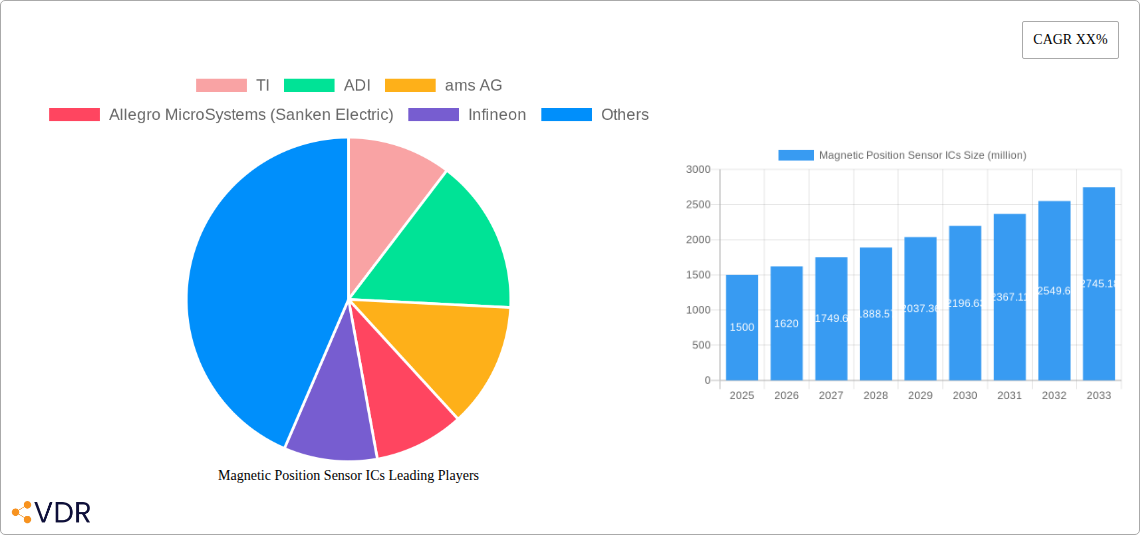
The global market for Magnetic Position Sensor ICs is experiencing robust growth, driven by increasing demand across diverse sectors such as automotive, industrial automation, and consumer electronics. The market's expansion is fueled by the rising adoption of electric vehicles (EVs), necessitating precise and reliable position sensing for motor control and advanced driver-assistance systems (ADAS). Furthermore, the increasing integration of smart sensors in industrial applications, such as robotics and factory automation, is further bolstering market demand. The shift towards miniaturization and higher performance requirements in consumer electronics, including smartphones and wearables, also contributes significantly to the market's growth trajectory. We estimate the 2025 market size to be approximately $1.5 billion, with a Compound Annual Growth Rate (CAGR) of 8% projected through 2033. This growth is expected to be relatively consistent across regions, with North America and Asia-Pacific leading in adoption due to robust technological advancements and manufacturing capabilities.
Despite the positive outlook, the market faces certain challenges. High initial investment costs for advanced sensor technologies and the complexities involved in integrating these sensors into existing systems could hinder wider adoption in some sectors. However, ongoing technological advancements leading to lower manufacturing costs and improved sensor performance are mitigating these restraints. The competitive landscape is characterized by a mix of established players, including TI, Infineon, and Analog Devices, and emerging companies specializing in niche applications. These companies are actively engaged in research and development, focusing on improving sensor accuracy, miniaturization, and energy efficiency to maintain their competitive edge and capture market share in this rapidly evolving technological landscape.
This comprehensive report provides a detailed analysis of the Magnetic Position Sensor ICs market, encompassing market dynamics, growth trends, regional dominance, product landscape, challenges, opportunities, and key players. The study period covers 2019-2033, with a base year of 2025 and a forecast period of 2025-2033. This report is essential for industry professionals, investors, and strategic decision-makers seeking a deep understanding of this rapidly evolving market. The parent market is the broader sensor market, while the child market encompasses automotive, industrial, and consumer applications.
Magnetic Position Sensor ICs Market Dynamics & Structure
This section analyzes the competitive landscape, technological advancements, regulatory influences, and market evolution within the Magnetic Position Sensor ICs industry. The market is characterized by a moderately concentrated structure with key players holding significant market share. Technological innovation, driven by increasing demand for higher precision and miniaturization, is a primary growth driver. Regulatory frameworks, particularly concerning automotive safety and emissions, play a crucial role in shaping market dynamics. The emergence of alternative technologies, such as optical sensors, presents competitive challenges. The end-user demographics are diverse, spanning automotive, industrial automation, consumer electronics, and healthcare. M&A activity in the sector has been moderate, with strategic acquisitions aiming to enhance technological capabilities and market reach.
- Market Concentration: Moderately concentrated, with the top 5 players holding approximately xx% of the market share in 2025.
- Technological Innovation: Focus on miniaturization, higher accuracy, lower power consumption, and integration with other sensor technologies.
- Regulatory Framework: Stringent automotive safety standards (e.g., ISO 26262) and environmental regulations are driving demand for high-performance, reliable sensors.
- Competitive Substitutes: Optical sensors, capacitive sensors, and hall-effect sensors pose competitive pressure.
- End-User Demographics: Automotive (xx million units), Industrial Automation (xx million units), Consumer Electronics (xx million units), and Healthcare (xx million units) are key segments.
- M&A Trends: xx major M&A deals occurred between 2019 and 2024, primarily focused on strengthening technology portfolios and expanding market presence.
Magnetic Position Sensor ICs Growth Trends & Insights
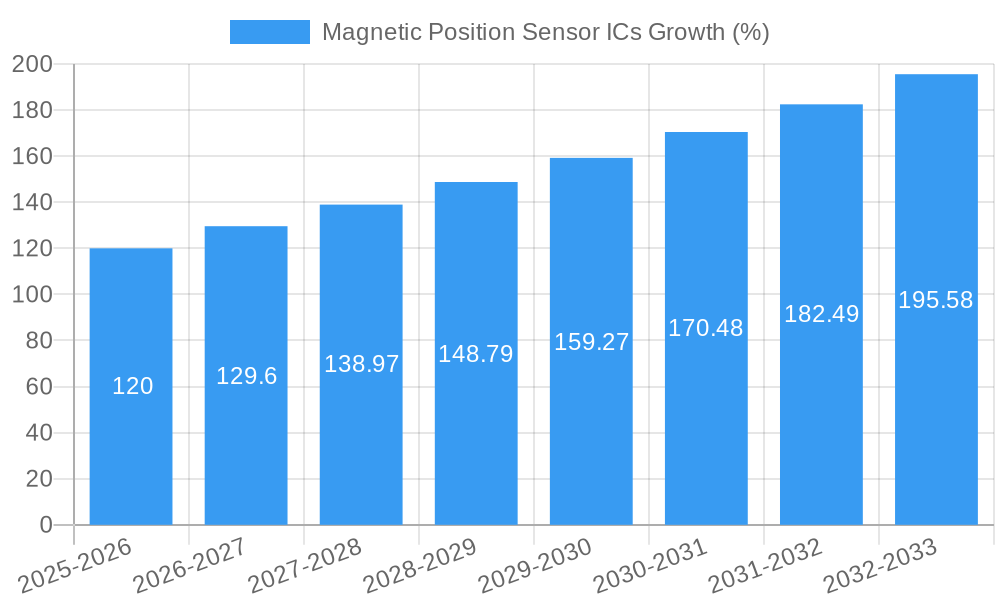
The Magnetic Position Sensor ICs market experienced robust growth during the historical period (2019-2024), driven by increased adoption across various applications. The market size reached xx million units in 2024, exhibiting a CAGR of xx% during this period. Technological disruptions, such as the development of advanced magnetic materials and improved signal processing techniques, are accelerating market expansion. Consumer behavior shifts toward automation, smart devices, and electric vehicles further fuel market growth. The forecast period (2025-2033) anticipates continued expansion, with a projected CAGR of xx% and a market size exceeding xx million units by 2033. Market penetration rates are increasing across various sectors. Emerging technologies like IoT and Industry 4.0 are expected to drive further growth.
Dominant Regions, Countries, or Segments in Magnetic Position Sensor ICs
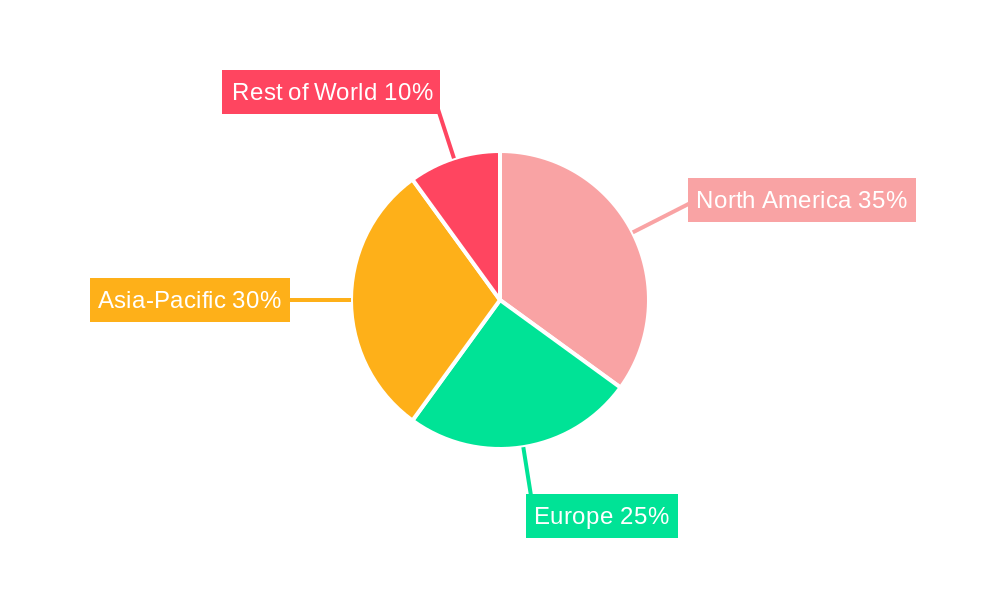
The automotive sector dominates the Magnetic Position Sensor ICs market, particularly in regions with robust automotive manufacturing industries. Asia-Pacific, specifically China, Japan, and South Korea, leads in terms of market share and growth potential due to significant automotive production. North America and Europe also exhibit strong growth, driven by increased demand from the automotive and industrial automation sectors. Government initiatives promoting electric and autonomous vehicles, along with robust industrial automation investments, further boost market growth in these regions.
- Key Drivers (Asia-Pacific): Large automotive manufacturing base, government support for electric vehicle adoption, and rapid industrialization.
- Key Drivers (North America): Growing adoption of advanced driver-assistance systems (ADAS) and industrial automation initiatives.
- Key Drivers (Europe): Stringent emission regulations and investments in renewable energy infrastructure.
Magnetic Position Sensor ICs Product Landscape
Magnetic position sensor ICs are witnessing advancements in miniaturization, enhanced accuracy, and improved power efficiency. Innovative designs incorporate features like integrated signal processing, advanced packaging technologies, and wider operating temperature ranges. These advancements are expanding their applications in diverse sectors, including automotive (e.g., throttle position sensing, wheel speed sensing), industrial automation (e.g., robotics, factory automation), and consumer electronics (e.g., smartphones, wearables). Unique selling propositions include high resolution, robustness, and cost-effectiveness.
Key Drivers, Barriers & Challenges in Magnetic Position Sensor ICs
Key Drivers: Increasing demand for precision and miniaturization in various applications, government regulations promoting automation and emission reduction, and technological advancements in magnetic materials and signal processing.
Challenges: Competition from alternative sensing technologies, supply chain disruptions impacting component availability, and the need to comply with stringent safety and quality standards. These challenges can lead to increased costs and potential production delays.
Emerging Opportunities in Magnetic Position Sensor ICs
Emerging trends include the integration of magnetic position sensors with other sensor technologies for advanced functionalities. Untapped markets in emerging economies present significant growth opportunities. Innovations in areas such as wireless sensor networks and low-power consumption are crucial for expanding the applications of these sensors.
Growth Accelerators in the Magnetic Position Sensor ICs Industry
Technological advancements in materials science and signal processing, strategic partnerships between sensor manufacturers and system integrators, and expanding market penetration in new application areas are key growth catalysts.
Key Players Shaping the Magnetic Position Sensor ICs Market
- TI
- ADI
- ams AG
- Allegro MicroSystems (Sanken Electric)
- Infineon
- Monolithic Power Systems
- Melexis
- ABLIC (MinebeaMitsumi)
- Renesas
- Honeywell
- QST
- Magntek Microelectronics
- Alfa Electronics
Notable Milestones in Magnetic Position Sensor ICs Sector
- 2020: Introduction of a new generation of high-precision magnetic position sensor ICs by TI.
- 2022: ADI acquired a leading manufacturer of magnetic sensors, expanding its product portfolio.
- 2023: Significant advancements in miniaturization and power efficiency by Melexis. (Further milestones can be added as needed.)
In-Depth Magnetic Position Sensor ICs Market Outlook
The Magnetic Position Sensor ICs market is poised for significant growth, driven by technological innovations, expanding applications, and increased demand from various industries. Strategic partnerships and market expansion into emerging economies will further fuel market expansion. The long-term outlook remains positive, indicating substantial growth opportunities for key players in the coming decade.
Magnetic Position Sensor ICs Segmentation
-
1. Application
- 1.1. Automotive
- 1.2. Industrial Automation
- 1.3. Process Control
- 1.4. Military & Aerospace
- 1.5. Others
-
2. Types
- 2.1. Rotary
- 2.2. Linear
- 2.3. Joystick
Magnetic Position Sensor ICs Segmentation By Geography
-
1. North America
- 1.1. United States
- 1.2. Canada
- 1.3. Mexico
-
2. South America
- 2.1. Brazil
- 2.2. Argentina
- 2.3. Rest of South America
-
3. Europe
- 3.1. United Kingdom
- 3.2. Germany
- 3.3. France
- 3.4. Italy
- 3.5. Spain
- 3.6. Russia
- 3.7. Benelux
- 3.8. Nordics
- 3.9. Rest of Europe
-
4. Middle East & Africa
- 4.1. Turkey
- 4.2. Israel
- 4.3. GCC
- 4.4. North Africa
- 4.5. South Africa
- 4.6. Rest of Middle East & Africa
-
5. Asia Pacific
- 5.1. China
- 5.2. India
- 5.3. Japan
- 5.4. South Korea
- 5.5. ASEAN
- 5.6. Oceania
- 5.7. Rest of Asia Pacific
Magnetic Position Sensor ICs REPORT HIGHLIGHTS
| Aspects | Details |
|---|---|
| Study Period | 2019-2033 |
| Base Year | 2024 |
| Estimated Year | 2025 |
| Forecast Period | 2025-2033 |
| Historical Period | 2019-2024 |
| Growth Rate | CAGR of XX% from 2019-2033 |
| Segmentation |
|
Table of Contents
- 1. Introduction
- 1.1. Research Scope
- 1.2. Market Segmentation
- 1.3. Research Methodology
- 1.4. Definitions and Assumptions
- 2. Executive Summary
- 2.1. Introduction
- 3. Market Dynamics
- 3.1. Introduction
- 3.2. Market Drivers
- 3.3. Market Restrains
- 3.4. Market Trends
- 4. Market Factor Analysis
- 4.1. Porters Five Forces
- 4.2. Supply/Value Chain
- 4.3. PESTEL analysis
- 4.4. Market Entropy
- 4.5. Patent/Trademark Analysis
- 5. Global Magnetic Position Sensor ICs Analysis, Insights and Forecast, 2019-2031
- 5.1. Market Analysis, Insights and Forecast - by Application
- 5.1.1. Automotive
- 5.1.2. Industrial Automation
- 5.1.3. Process Control
- 5.1.4. Military & Aerospace
- 5.1.5. Others
- 5.2. Market Analysis, Insights and Forecast - by Types
- 5.2.1. Rotary
- 5.2.2. Linear
- 5.2.3. Joystick
- 5.3. Market Analysis, Insights and Forecast - by Region
- 5.3.1. North America
- 5.3.2. South America
- 5.3.3. Europe
- 5.3.4. Middle East & Africa
- 5.3.5. Asia Pacific
- 5.1. Market Analysis, Insights and Forecast - by Application
- 6. North America Magnetic Position Sensor ICs Analysis, Insights and Forecast, 2019-2031
- 6.1. Market Analysis, Insights and Forecast - by Application
- 6.1.1. Automotive
- 6.1.2. Industrial Automation
- 6.1.3. Process Control
- 6.1.4. Military & Aerospace
- 6.1.5. Others
- 6.2. Market Analysis, Insights and Forecast - by Types
- 6.2.1. Rotary
- 6.2.2. Linear
- 6.2.3. Joystick
- 6.1. Market Analysis, Insights and Forecast - by Application
- 7. South America Magnetic Position Sensor ICs Analysis, Insights and Forecast, 2019-2031
- 7.1. Market Analysis, Insights and Forecast - by Application
- 7.1.1. Automotive
- 7.1.2. Industrial Automation
- 7.1.3. Process Control
- 7.1.4. Military & Aerospace
- 7.1.5. Others
- 7.2. Market Analysis, Insights and Forecast - by Types
- 7.2.1. Rotary
- 7.2.2. Linear
- 7.2.3. Joystick
- 7.1. Market Analysis, Insights and Forecast - by Application
- 8. Europe Magnetic Position Sensor ICs Analysis, Insights and Forecast, 2019-2031
- 8.1. Market Analysis, Insights and Forecast - by Application
- 8.1.1. Automotive
- 8.1.2. Industrial Automation
- 8.1.3. Process Control
- 8.1.4. Military & Aerospace
- 8.1.5. Others
- 8.2. Market Analysis, Insights and Forecast - by Types
- 8.2.1. Rotary
- 8.2.2. Linear
- 8.2.3. Joystick
- 8.1. Market Analysis, Insights and Forecast - by Application
- 9. Middle East & Africa Magnetic Position Sensor ICs Analysis, Insights and Forecast, 2019-2031
- 9.1. Market Analysis, Insights and Forecast - by Application
- 9.1.1. Automotive
- 9.1.2. Industrial Automation
- 9.1.3. Process Control
- 9.1.4. Military & Aerospace
- 9.1.5. Others
- 9.2. Market Analysis, Insights and Forecast - by Types
- 9.2.1. Rotary
- 9.2.2. Linear
- 9.2.3. Joystick
- 9.1. Market Analysis, Insights and Forecast - by Application
- 10. Asia Pacific Magnetic Position Sensor ICs Analysis, Insights and Forecast, 2019-2031
- 10.1. Market Analysis, Insights and Forecast - by Application
- 10.1.1. Automotive
- 10.1.2. Industrial Automation
- 10.1.3. Process Control
- 10.1.4. Military & Aerospace
- 10.1.5. Others
- 10.2. Market Analysis, Insights and Forecast - by Types
- 10.2.1. Rotary
- 10.2.2. Linear
- 10.2.3. Joystick
- 10.1. Market Analysis, Insights and Forecast - by Application
- 11. Competitive Analysis
- 11.1. Global Market Share Analysis 2024
- 11.2. Company Profiles
- 11.2.1 TI
- 11.2.1.1. Overview
- 11.2.1.2. Products
- 11.2.1.3. SWOT Analysis
- 11.2.1.4. Recent Developments
- 11.2.1.5. Financials (Based on Availability)
- 11.2.2 ADI
- 11.2.2.1. Overview
- 11.2.2.2. Products
- 11.2.2.3. SWOT Analysis
- 11.2.2.4. Recent Developments
- 11.2.2.5. Financials (Based on Availability)
- 11.2.3 ams AG
- 11.2.3.1. Overview
- 11.2.3.2. Products
- 11.2.3.3. SWOT Analysis
- 11.2.3.4. Recent Developments
- 11.2.3.5. Financials (Based on Availability)
- 11.2.4 Allegro MicroSystems (Sanken Electric)
- 11.2.4.1. Overview
- 11.2.4.2. Products
- 11.2.4.3. SWOT Analysis
- 11.2.4.4. Recent Developments
- 11.2.4.5. Financials (Based on Availability)
- 11.2.5 Infineon
- 11.2.5.1. Overview
- 11.2.5.2. Products
- 11.2.5.3. SWOT Analysis
- 11.2.5.4. Recent Developments
- 11.2.5.5. Financials (Based on Availability)
- 11.2.6 Monolithic Power Systems
- 11.2.6.1. Overview
- 11.2.6.2. Products
- 11.2.6.3. SWOT Analysis
- 11.2.6.4. Recent Developments
- 11.2.6.5. Financials (Based on Availability)
- 11.2.7 Melexis
- 11.2.7.1. Overview
- 11.2.7.2. Products
- 11.2.7.3. SWOT Analysis
- 11.2.7.4. Recent Developments
- 11.2.7.5. Financials (Based on Availability)
- 11.2.8 ABLIC (MinebeaMitsumi)
- 11.2.8.1. Overview
- 11.2.8.2. Products
- 11.2.8.3. SWOT Analysis
- 11.2.8.4. Recent Developments
- 11.2.8.5. Financials (Based on Availability)
- 11.2.9 Renesas
- 11.2.9.1. Overview
- 11.2.9.2. Products
- 11.2.9.3. SWOT Analysis
- 11.2.9.4. Recent Developments
- 11.2.9.5. Financials (Based on Availability)
- 11.2.10 Honeywell
- 11.2.10.1. Overview
- 11.2.10.2. Products
- 11.2.10.3. SWOT Analysis
- 11.2.10.4. Recent Developments
- 11.2.10.5. Financials (Based on Availability)
- 11.2.11 QST
- 11.2.11.1. Overview
- 11.2.11.2. Products
- 11.2.11.3. SWOT Analysis
- 11.2.11.4. Recent Developments
- 11.2.11.5. Financials (Based on Availability)
- 11.2.12 Magntek Microelectronics
- 11.2.12.1. Overview
- 11.2.12.2. Products
- 11.2.12.3. SWOT Analysis
- 11.2.12.4. Recent Developments
- 11.2.12.5. Financials (Based on Availability)
- 11.2.13 Alfa Electronics
- 11.2.13.1. Overview
- 11.2.13.2. Products
- 11.2.13.3. SWOT Analysis
- 11.2.13.4. Recent Developments
- 11.2.13.5. Financials (Based on Availability)
- 11.2.1 TI
List of Figures
- Figure 1: Global Magnetic Position Sensor ICs Revenue Breakdown (million, %) by Region 2024 & 2032
- Figure 2: Global Magnetic Position Sensor ICs Volume Breakdown (K, %) by Region 2024 & 2032
- Figure 3: North America Magnetic Position Sensor ICs Revenue (million), by Application 2024 & 2032
- Figure 4: North America Magnetic Position Sensor ICs Volume (K), by Application 2024 & 2032
- Figure 5: North America Magnetic Position Sensor ICs Revenue Share (%), by Application 2024 & 2032
- Figure 6: North America Magnetic Position Sensor ICs Volume Share (%), by Application 2024 & 2032
- Figure 7: North America Magnetic Position Sensor ICs Revenue (million), by Types 2024 & 2032
- Figure 8: North America Magnetic Position Sensor ICs Volume (K), by Types 2024 & 2032
- Figure 9: North America Magnetic Position Sensor ICs Revenue Share (%), by Types 2024 & 2032
- Figure 10: North America Magnetic Position Sensor ICs Volume Share (%), by Types 2024 & 2032
- Figure 11: North America Magnetic Position Sensor ICs Revenue (million), by Country 2024 & 2032
- Figure 12: North America Magnetic Position Sensor ICs Volume (K), by Country 2024 & 2032
- Figure 13: North America Magnetic Position Sensor ICs Revenue Share (%), by Country 2024 & 2032
- Figure 14: North America Magnetic Position Sensor ICs Volume Share (%), by Country 2024 & 2032
- Figure 15: South America Magnetic Position Sensor ICs Revenue (million), by Application 2024 & 2032
- Figure 16: South America Magnetic Position Sensor ICs Volume (K), by Application 2024 & 2032
- Figure 17: South America Magnetic Position Sensor ICs Revenue Share (%), by Application 2024 & 2032
- Figure 18: South America Magnetic Position Sensor ICs Volume Share (%), by Application 2024 & 2032
- Figure 19: South America Magnetic Position Sensor ICs Revenue (million), by Types 2024 & 2032
- Figure 20: South America Magnetic Position Sensor ICs Volume (K), by Types 2024 & 2032
- Figure 21: South America Magnetic Position Sensor ICs Revenue Share (%), by Types 2024 & 2032
- Figure 22: South America Magnetic Position Sensor ICs Volume Share (%), by Types 2024 & 2032
- Figure 23: South America Magnetic Position Sensor ICs Revenue (million), by Country 2024 & 2032
- Figure 24: South America Magnetic Position Sensor ICs Volume (K), by Country 2024 & 2032
- Figure 25: South America Magnetic Position Sensor ICs Revenue Share (%), by Country 2024 & 2032
- Figure 26: South America Magnetic Position Sensor ICs Volume Share (%), by Country 2024 & 2032
- Figure 27: Europe Magnetic Position Sensor ICs Revenue (million), by Application 2024 & 2032
- Figure 28: Europe Magnetic Position Sensor ICs Volume (K), by Application 2024 & 2032
- Figure 29: Europe Magnetic Position Sensor ICs Revenue Share (%), by Application 2024 & 2032
- Figure 30: Europe Magnetic Position Sensor ICs Volume Share (%), by Application 2024 & 2032
- Figure 31: Europe Magnetic Position Sensor ICs Revenue (million), by Types 2024 & 2032
- Figure 32: Europe Magnetic Position Sensor ICs Volume (K), by Types 2024 & 2032
- Figure 33: Europe Magnetic Position Sensor ICs Revenue Share (%), by Types 2024 & 2032
- Figure 34: Europe Magnetic Position Sensor ICs Volume Share (%), by Types 2024 & 2032
- Figure 35: Europe Magnetic Position Sensor ICs Revenue (million), by Country 2024 & 2032
- Figure 36: Europe Magnetic Position Sensor ICs Volume (K), by Country 2024 & 2032
- Figure 37: Europe Magnetic Position Sensor ICs Revenue Share (%), by Country 2024 & 2032
- Figure 38: Europe Magnetic Position Sensor ICs Volume Share (%), by Country 2024 & 2032
- Figure 39: Middle East & Africa Magnetic Position Sensor ICs Revenue (million), by Application 2024 & 2032
- Figure 40: Middle East & Africa Magnetic Position Sensor ICs Volume (K), by Application 2024 & 2032
- Figure 41: Middle East & Africa Magnetic Position Sensor ICs Revenue Share (%), by Application 2024 & 2032
- Figure 42: Middle East & Africa Magnetic Position Sensor ICs Volume Share (%), by Application 2024 & 2032
- Figure 43: Middle East & Africa Magnetic Position Sensor ICs Revenue (million), by Types 2024 & 2032
- Figure 44: Middle East & Africa Magnetic Position Sensor ICs Volume (K), by Types 2024 & 2032
- Figure 45: Middle East & Africa Magnetic Position Sensor ICs Revenue Share (%), by Types 2024 & 2032
- Figure 46: Middle East & Africa Magnetic Position Sensor ICs Volume Share (%), by Types 2024 & 2032
- Figure 47: Middle East & Africa Magnetic Position Sensor ICs Revenue (million), by Country 2024 & 2032
- Figure 48: Middle East & Africa Magnetic Position Sensor ICs Volume (K), by Country 2024 & 2032
- Figure 49: Middle East & Africa Magnetic Position Sensor ICs Revenue Share (%), by Country 2024 & 2032
- Figure 50: Middle East & Africa Magnetic Position Sensor ICs Volume Share (%), by Country 2024 & 2032
- Figure 51: Asia Pacific Magnetic Position Sensor ICs Revenue (million), by Application 2024 & 2032
- Figure 52: Asia Pacific Magnetic Position Sensor ICs Volume (K), by Application 2024 & 2032
- Figure 53: Asia Pacific Magnetic Position Sensor ICs Revenue Share (%), by Application 2024 & 2032
- Figure 54: Asia Pacific Magnetic Position Sensor ICs Volume Share (%), by Application 2024 & 2032
- Figure 55: Asia Pacific Magnetic Position Sensor ICs Revenue (million), by Types 2024 & 2032
- Figure 56: Asia Pacific Magnetic Position Sensor ICs Volume (K), by Types 2024 & 2032
- Figure 57: Asia Pacific Magnetic Position Sensor ICs Revenue Share (%), by Types 2024 & 2032
- Figure 58: Asia Pacific Magnetic Position Sensor ICs Volume Share (%), by Types 2024 & 2032
- Figure 59: Asia Pacific Magnetic Position Sensor ICs Revenue (million), by Country 2024 & 2032
- Figure 60: Asia Pacific Magnetic Position Sensor ICs Volume (K), by Country 2024 & 2032
- Figure 61: Asia Pacific Magnetic Position Sensor ICs Revenue Share (%), by Country 2024 & 2032
- Figure 62: Asia Pacific Magnetic Position Sensor ICs Volume Share (%), by Country 2024 & 2032
List of Tables
- Table 1: Global Magnetic Position Sensor ICs Revenue million Forecast, by Region 2019 & 2032
- Table 2: Global Magnetic Position Sensor ICs Volume K Forecast, by Region 2019 & 2032
- Table 3: Global Magnetic Position Sensor ICs Revenue million Forecast, by Application 2019 & 2032
- Table 4: Global Magnetic Position Sensor ICs Volume K Forecast, by Application 2019 & 2032
- Table 5: Global Magnetic Position Sensor ICs Revenue million Forecast, by Types 2019 & 2032
- Table 6: Global Magnetic Position Sensor ICs Volume K Forecast, by Types 2019 & 2032
- Table 7: Global Magnetic Position Sensor ICs Revenue million Forecast, by Region 2019 & 2032
- Table 8: Global Magnetic Position Sensor ICs Volume K Forecast, by Region 2019 & 2032
- Table 9: Global Magnetic Position Sensor ICs Revenue million Forecast, by Application 2019 & 2032
- Table 10: Global Magnetic Position Sensor ICs Volume K Forecast, by Application 2019 & 2032
- Table 11: Global Magnetic Position Sensor ICs Revenue million Forecast, by Types 2019 & 2032
- Table 12: Global Magnetic Position Sensor ICs Volume K Forecast, by Types 2019 & 2032
- Table 13: Global Magnetic Position Sensor ICs Revenue million Forecast, by Country 2019 & 2032
- Table 14: Global Magnetic Position Sensor ICs Volume K Forecast, by Country 2019 & 2032
- Table 15: United States Magnetic Position Sensor ICs Revenue (million) Forecast, by Application 2019 & 2032
- Table 16: United States Magnetic Position Sensor ICs Volume (K) Forecast, by Application 2019 & 2032
- Table 17: Canada Magnetic Position Sensor ICs Revenue (million) Forecast, by Application 2019 & 2032
- Table 18: Canada Magnetic Position Sensor ICs Volume (K) Forecast, by Application 2019 & 2032
- Table 19: Mexico Magnetic Position Sensor ICs Revenue (million) Forecast, by Application 2019 & 2032
- Table 20: Mexico Magnetic Position Sensor ICs Volume (K) Forecast, by Application 2019 & 2032
- Table 21: Global Magnetic Position Sensor ICs Revenue million Forecast, by Application 2019 & 2032
- Table 22: Global Magnetic Position Sensor ICs Volume K Forecast, by Application 2019 & 2032
- Table 23: Global Magnetic Position Sensor ICs Revenue million Forecast, by Types 2019 & 2032
- Table 24: Global Magnetic Position Sensor ICs Volume K Forecast, by Types 2019 & 2032
- Table 25: Global Magnetic Position Sensor ICs Revenue million Forecast, by Country 2019 & 2032
- Table 26: Global Magnetic Position Sensor ICs Volume K Forecast, by Country 2019 & 2032
- Table 27: Brazil Magnetic Position Sensor ICs Revenue (million) Forecast, by Application 2019 & 2032
- Table 28: Brazil Magnetic Position Sensor ICs Volume (K) Forecast, by Application 2019 & 2032
- Table 29: Argentina Magnetic Position Sensor ICs Revenue (million) Forecast, by Application 2019 & 2032
- Table 30: Argentina Magnetic Position Sensor ICs Volume (K) Forecast, by Application 2019 & 2032
- Table 31: Rest of South America Magnetic Position Sensor ICs Revenue (million) Forecast, by Application 2019 & 2032
- Table 32: Rest of South America Magnetic Position Sensor ICs Volume (K) Forecast, by Application 2019 & 2032
- Table 33: Global Magnetic Position Sensor ICs Revenue million Forecast, by Application 2019 & 2032
- Table 34: Global Magnetic Position Sensor ICs Volume K Forecast, by Application 2019 & 2032
- Table 35: Global Magnetic Position Sensor ICs Revenue million Forecast, by Types 2019 & 2032
- Table 36: Global Magnetic Position Sensor ICs Volume K Forecast, by Types 2019 & 2032
- Table 37: Global Magnetic Position Sensor ICs Revenue million Forecast, by Country 2019 & 2032
- Table 38: Global Magnetic Position Sensor ICs Volume K Forecast, by Country 2019 & 2032
- Table 39: United Kingdom Magnetic Position Sensor ICs Revenue (million) Forecast, by Application 2019 & 2032
- Table 40: United Kingdom Magnetic Position Sensor ICs Volume (K) Forecast, by Application 2019 & 2032
- Table 41: Germany Magnetic Position Sensor ICs Revenue (million) Forecast, by Application 2019 & 2032
- Table 42: Germany Magnetic Position Sensor ICs Volume (K) Forecast, by Application 2019 & 2032
- Table 43: France Magnetic Position Sensor ICs Revenue (million) Forecast, by Application 2019 & 2032
- Table 44: France Magnetic Position Sensor ICs Volume (K) Forecast, by Application 2019 & 2032
- Table 45: Italy Magnetic Position Sensor ICs Revenue (million) Forecast, by Application 2019 & 2032
- Table 46: Italy Magnetic Position Sensor ICs Volume (K) Forecast, by Application 2019 & 2032
- Table 47: Spain Magnetic Position Sensor ICs Revenue (million) Forecast, by Application 2019 & 2032
- Table 48: Spain Magnetic Position Sensor ICs Volume (K) Forecast, by Application 2019 & 2032
- Table 49: Russia Magnetic Position Sensor ICs Revenue (million) Forecast, by Application 2019 & 2032
- Table 50: Russia Magnetic Position Sensor ICs Volume (K) Forecast, by Application 2019 & 2032
- Table 51: Benelux Magnetic Position Sensor ICs Revenue (million) Forecast, by Application 2019 & 2032
- Table 52: Benelux Magnetic Position Sensor ICs Volume (K) Forecast, by Application 2019 & 2032
- Table 53: Nordics Magnetic Position Sensor ICs Revenue (million) Forecast, by Application 2019 & 2032
- Table 54: Nordics Magnetic Position Sensor ICs Volume (K) Forecast, by Application 2019 & 2032
- Table 55: Rest of Europe Magnetic Position Sensor ICs Revenue (million) Forecast, by Application 2019 & 2032
- Table 56: Rest of Europe Magnetic Position Sensor ICs Volume (K) Forecast, by Application 2019 & 2032
- Table 57: Global Magnetic Position Sensor ICs Revenue million Forecast, by Application 2019 & 2032
- Table 58: Global Magnetic Position Sensor ICs Volume K Forecast, by Application 2019 & 2032
- Table 59: Global Magnetic Position Sensor ICs Revenue million Forecast, by Types 2019 & 2032
- Table 60: Global Magnetic Position Sensor ICs Volume K Forecast, by Types 2019 & 2032
- Table 61: Global Magnetic Position Sensor ICs Revenue million Forecast, by Country 2019 & 2032
- Table 62: Global Magnetic Position Sensor ICs Volume K Forecast, by Country 2019 & 2032
- Table 63: Turkey Magnetic Position Sensor ICs Revenue (million) Forecast, by Application 2019 & 2032
- Table 64: Turkey Magnetic Position Sensor ICs Volume (K) Forecast, by Application 2019 & 2032
- Table 65: Israel Magnetic Position Sensor ICs Revenue (million) Forecast, by Application 2019 & 2032
- Table 66: Israel Magnetic Position Sensor ICs Volume (K) Forecast, by Application 2019 & 2032
- Table 67: GCC Magnetic Position Sensor ICs Revenue (million) Forecast, by Application 2019 & 2032
- Table 68: GCC Magnetic Position Sensor ICs Volume (K) Forecast, by Application 2019 & 2032
- Table 69: North Africa Magnetic Position Sensor ICs Revenue (million) Forecast, by Application 2019 & 2032
- Table 70: North Africa Magnetic Position Sensor ICs Volume (K) Forecast, by Application 2019 & 2032
- Table 71: South Africa Magnetic Position Sensor ICs Revenue (million) Forecast, by Application 2019 & 2032
- Table 72: South Africa Magnetic Position Sensor ICs Volume (K) Forecast, by Application 2019 & 2032
- Table 73: Rest of Middle East & Africa Magnetic Position Sensor ICs Revenue (million) Forecast, by Application 2019 & 2032
- Table 74: Rest of Middle East & Africa Magnetic Position Sensor ICs Volume (K) Forecast, by Application 2019 & 2032
- Table 75: Global Magnetic Position Sensor ICs Revenue million Forecast, by Application 2019 & 2032
- Table 76: Global Magnetic Position Sensor ICs Volume K Forecast, by Application 2019 & 2032
- Table 77: Global Magnetic Position Sensor ICs Revenue million Forecast, by Types 2019 & 2032
- Table 78: Global Magnetic Position Sensor ICs Volume K Forecast, by Types 2019 & 2032
- Table 79: Global Magnetic Position Sensor ICs Revenue million Forecast, by Country 2019 & 2032
- Table 80: Global Magnetic Position Sensor ICs Volume K Forecast, by Country 2019 & 2032
- Table 81: China Magnetic Position Sensor ICs Revenue (million) Forecast, by Application 2019 & 2032
- Table 82: China Magnetic Position Sensor ICs Volume (K) Forecast, by Application 2019 & 2032
- Table 83: India Magnetic Position Sensor ICs Revenue (million) Forecast, by Application 2019 & 2032
- Table 84: India Magnetic Position Sensor ICs Volume (K) Forecast, by Application 2019 & 2032
- Table 85: Japan Magnetic Position Sensor ICs Revenue (million) Forecast, by Application 2019 & 2032
- Table 86: Japan Magnetic Position Sensor ICs Volume (K) Forecast, by Application 2019 & 2032
- Table 87: South Korea Magnetic Position Sensor ICs Revenue (million) Forecast, by Application 2019 & 2032
- Table 88: South Korea Magnetic Position Sensor ICs Volume (K) Forecast, by Application 2019 & 2032
- Table 89: ASEAN Magnetic Position Sensor ICs Revenue (million) Forecast, by Application 2019 & 2032
- Table 90: ASEAN Magnetic Position Sensor ICs Volume (K) Forecast, by Application 2019 & 2032
- Table 91: Oceania Magnetic Position Sensor ICs Revenue (million) Forecast, by Application 2019 & 2032
- Table 92: Oceania Magnetic Position Sensor ICs Volume (K) Forecast, by Application 2019 & 2032
- Table 93: Rest of Asia Pacific Magnetic Position Sensor ICs Revenue (million) Forecast, by Application 2019 & 2032
- Table 94: Rest of Asia Pacific Magnetic Position Sensor ICs Volume (K) Forecast, by Application 2019 & 2032
Frequently Asked Questions
1. What is the projected Compound Annual Growth Rate (CAGR) of the Magnetic Position Sensor ICs?
The projected CAGR is approximately XX%.
2. Which companies are prominent players in the Magnetic Position Sensor ICs?
Key companies in the market include TI, ADI, ams AG, Allegro MicroSystems (Sanken Electric), Infineon, Monolithic Power Systems, Melexis, ABLIC (MinebeaMitsumi), Renesas, Honeywell, QST, Magntek Microelectronics, Alfa Electronics.
3. What are the main segments of the Magnetic Position Sensor ICs?
The market segments include Application, Types.
4. Can you provide details about the market size?
The market size is estimated to be USD XXX million as of 2022.
5. What are some drivers contributing to market growth?
N/A
6. What are the notable trends driving market growth?
N/A
7. Are there any restraints impacting market growth?
N/A
8. Can you provide examples of recent developments in the market?
N/A
9. What pricing options are available for accessing the report?
Pricing options include single-user, multi-user, and enterprise licenses priced at USD 4350.00, USD 6525.00, and USD 8700.00 respectively.
10. Is the market size provided in terms of value or volume?
The market size is provided in terms of value, measured in million and volume, measured in K.
11. Are there any specific market keywords associated with the report?
Yes, the market keyword associated with the report is "Magnetic Position Sensor ICs," which aids in identifying and referencing the specific market segment covered.
12. How do I determine which pricing option suits my needs best?
The pricing options vary based on user requirements and access needs. Individual users may opt for single-user licenses, while businesses requiring broader access may choose multi-user or enterprise licenses for cost-effective access to the report.
13. Are there any additional resources or data provided in the Magnetic Position Sensor ICs report?
While the report offers comprehensive insights, it's advisable to review the specific contents or supplementary materials provided to ascertain if additional resources or data are available.
14. How can I stay updated on further developments or reports in the Magnetic Position Sensor ICs?
To stay informed about further developments, trends, and reports in the Magnetic Position Sensor ICs, consider subscribing to industry newsletters, following relevant companies and organizations, or regularly checking reputable industry news sources and publications.
Methodology
Step 1 - Identification of Relevant Samples Size from Population Database


Step 2 - Approaches for Defining Global Market Size (Value, Volume* & Price*)

Note*: In applicable scenarios
Step 3 - Data Sources
Primary Research
- Web Analytics
- Survey Reports
- Research Institute
- Latest Research Reports
- Opinion Leaders
Secondary Research
- Annual Reports
- White Paper
- Latest Press Release
- Industry Association
- Paid Database
- Investor Presentations

Step 4 - Data Triangulation
Involves using different sources of information in order to increase the validity of a study
These sources are likely to be stakeholders in a program - participants, other researchers, program staff, other community members, and so on.
Then we put all data in single framework & apply various statistical tools to find out the dynamic on the market.
During the analysis stage, feedback from the stakeholder groups would be compared to determine areas of agreement as well as areas of divergence


