

Key Insights
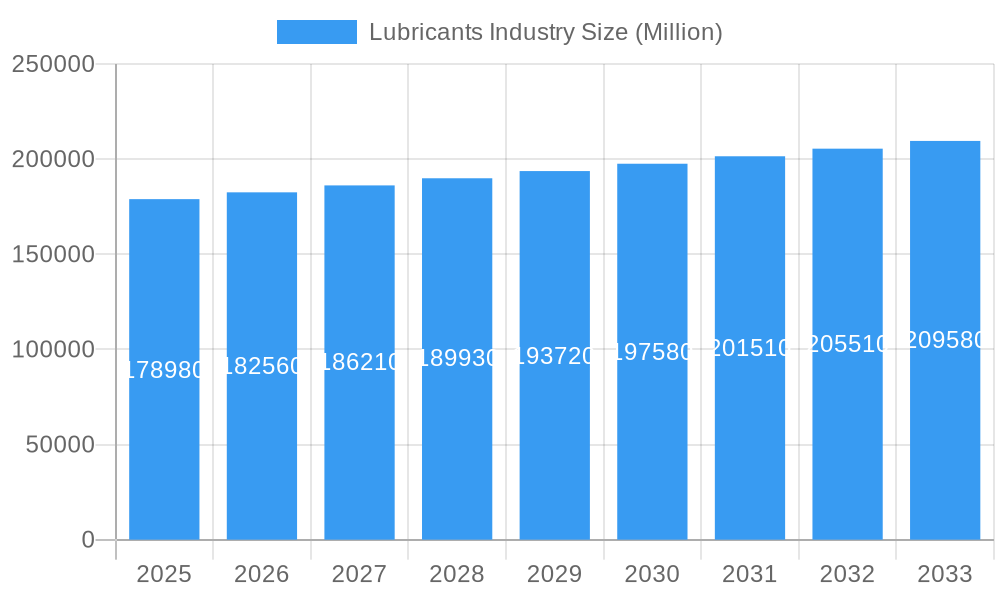
The global lubricants market is poised for steady growth, projected to reach approximately $178.98 billion in 2025 and expand at a Compound Annual Growth Rate (CAGR) of around 2% through 2033. This consistent expansion is underpinned by robust demand from key end-user industries, including automotive, heavy equipment, and metallurgy & metalworking. The automotive sector, driven by increasing vehicle production and the ongoing demand for higher-performance lubricants that enhance fuel efficiency and extend engine life, remains a primary growth engine. Similarly, the burgeoning infrastructure development and mining activities worldwide are fueling the demand for heavy-duty lubricants crucial for the operation of complex machinery. Furthermore, advancements in lubricant technology, focusing on synthetic formulations and bio-based alternatives, are catering to evolving environmental regulations and performance expectations, thereby contributing to market resilience.
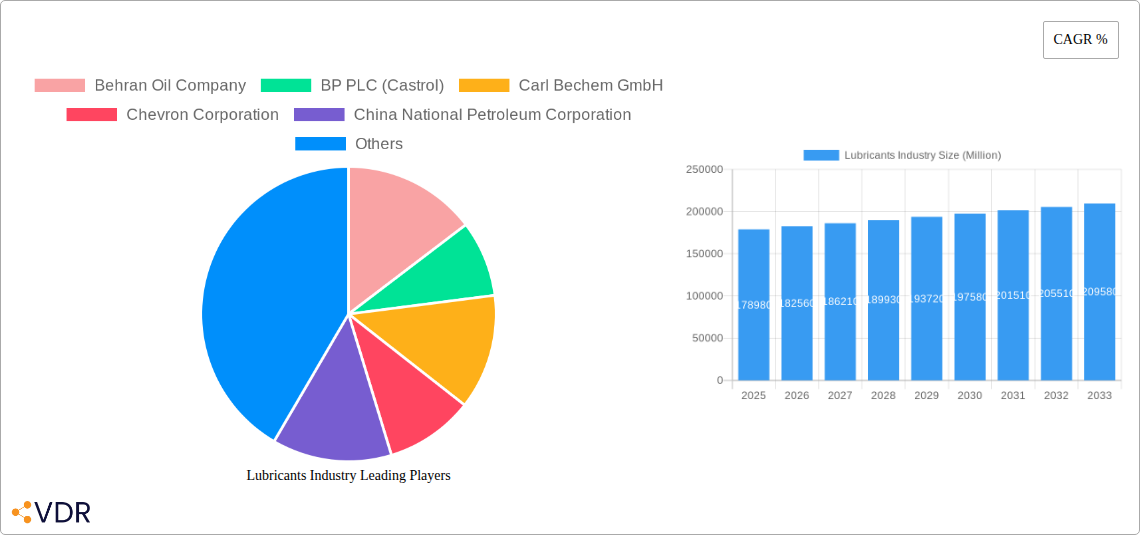
Lubricants Industry Market Size (In Billion)
While the market demonstrates consistent expansion, it faces certain headwinds. The increasing adoption of electric vehicles (EVs) presents a long-term shift away from traditional internal combustion engine lubricants, although the lubricant needs of EVs, particularly for thermal management and drivetrain components, are creating new market opportunities. Moreover, fluctuating raw material prices, primarily derived from crude oil, can impact profit margins for manufacturers. However, the growing emphasis on industrial automation, the need for enhanced machinery lifespan, and the increasing focus on maintenance and operational efficiency across various sectors are expected to outweigh these challenges. The Asia Pacific region is anticipated to remain a dominant force, driven by its large manufacturing base and expanding automotive and industrial sectors, while North America and Europe will continue to be significant markets with a focus on high-performance and sustainable lubricant solutions.
Lubricants Industry Company Market Share
Unlock unparalleled insights into the global lubricants market with this comprehensive, SEO-optimized report. Dive deep into the intricate dynamics, growth trajectories, and future potential of the lubricants industry, crucial for automotive, heavy equipment, metallurgy, power generation, and other vital sectors. This report provides actionable intelligence on parent and child market segments, enabling strategic decision-making for industry professionals.
Lubricants Industry Market Dynamics & Structure
The global lubricants market, valued at $145.6 billion in 2023, is characterized by a moderate to high market concentration, with a few key players dominating global market share. Technological innovation serves as a primary driver, with continuous advancements in synthetic lubricants, bio-based alternatives, and high-performance formulations catering to evolving end-user demands for efficiency, durability, and environmental compliance. Regulatory frameworks, particularly concerning emissions and environmental impact, significantly shape product development and market access. Competitive product substitutes, such as advanced materials and improved machine designs that reduce friction, present a constant challenge. End-user demographics are shifting, with a growing demand for specialized lubricants in emerging economies and for advanced machinery. Mergers and acquisitions (M&A) remain a significant trend, facilitating market consolidation, geographic expansion, and technology acquisition. For instance, M&A activity in the lubricants sector has seen a steady increase, with an estimated 35-40 significant deals annually in recent years, often involving established players acquiring smaller, specialized lubricant manufacturers.
- Market Concentration: Dominated by a few major multinational corporations, alongside a growing number of regional and specialized players.
- Technological Innovation Drivers: Focus on synthetic base oils, additive technology, bio-lubricants, and extended drain intervals.
- Regulatory Frameworks: Stringent environmental regulations (e.g., emissions standards, biodegradability requirements) influence product formulations.
- Competitive Product Substitutes: Advancements in material science and engineering that reduce the need for traditional lubrication.
- End-User Demographics: Increasing demand for high-performance lubricants in evolving industrial and automotive sectors.
- M&A Trends: Strategic acquisitions for market share expansion, technology access, and product portfolio diversification.
Lubricants Industry Growth Trends & Insights
The lubricants industry is poised for significant growth, projected to reach an estimated $175.3 billion by 2033, exhibiting a Compound Annual Growth Rate (CAGR) of 4.2% from 2025 to 2033. This expansion is fueled by escalating demand from the automotive sector, driven by a growing global vehicle parc, and the burgeoning heavy equipment industry, particularly in infrastructure development and mining. Adoption rates for high-performance synthetic lubricants are steadily increasing as end-users recognize their superior longevity, fuel efficiency, and reduced emissions benefits, contributing to a shift from mineral-based to synthetic formulations. Technological disruptions, such as the development of self-healing lubricants and advanced nano-lubricants, are emerging, promising enhanced performance and operational efficiency. Consumer behavior shifts are also evident, with a growing preference for lubricants that offer extended service intervals and contribute to overall equipment lifespan, aligning with sustainability goals. The base year of 2025 estimates the market size at $155.8 billion.
- Market Size Evolution: Projected to grow from $155.8 billion in 2025 to $175.3 billion by 2033.
- CAGR: 4.2% for the forecast period 2025–2033.
- Adoption Rates: Increasing adoption of synthetic and semi-synthetic lubricants across various end-user segments.
- Technological Disruptions: Innovations in bio-lubricants, nanomaterials, and smart lubricants for predictive maintenance.
- Consumer Behavior Shifts: Demand for longer drain intervals, improved energy efficiency, and environmentally friendly lubricant options.
Dominant Regions, Countries, or Segments in Lubricants Industry
The Automotive segment, as an end-user industry, is a dominant force in the global lubricants market, consistently accounting for the largest share, estimated at 35% of the total market value in 2025. This dominance is driven by the sheer volume of vehicles globally, including passenger cars, commercial vehicles, and motorcycles, all requiring regular oil changes and specialized drivetrain fluids. Key drivers for this segment's sustained growth include an expanding global vehicle parc, particularly in emerging economies, and the increasing adoption of advanced engine technologies that necessitate high-performance lubricants. The Product Type segment of Engine Oils is intrinsically linked to this dominance, representing a substantial portion of the automotive lubricant demand. Geographically, Asia Pacific is the leading region, driven by rapid industrialization, a large manufacturing base, and a growing automotive market in countries like China and India. Economic policies supporting manufacturing and infrastructure development in these nations further bolster the demand for industrial lubricants used in Heavy Equipment and Metallurgy & Metalworking. The growth potential in these regions remains exceptionally high, fueled by ongoing urbanization and infrastructure projects.
- Dominant End-User Segment: Automotive, representing a significant market share due to the vast global vehicle population.
- Key Product Type: Engine Oils, directly correlated with automotive lubricant demand.
- Leading Region: Asia Pacific, propelled by robust industrial growth and a booming automotive sector.
- Drivers in Asia Pacific: Economic policies favoring manufacturing, infrastructure development, and a growing middle class with increased vehicle ownership.
- Market Share (Automotive): Estimated at 35% of the total market in 2025.
- Growth Potential: High in emerging economies due to ongoing industrialization and infrastructure expansion.
Lubricants Industry Product Landscape
The lubricants product landscape is evolving rapidly with innovations focused on enhancing performance, extending equipment life, and meeting stringent environmental standards. Synthetic lubricants, including PAOs and esters, are gaining prominence for their superior thermal stability, oxidative resistance, and low-temperature performance, finding applications in high-stress automotive engines and industrial machinery. The development of biodegradable and bio-based lubricants, derived from renewable resources, is a significant trend, addressing environmental concerns and appealing to sustainability-conscious consumers. Advanced additive packages continue to be a key area of innovation, providing enhanced anti-wear, anti-corrosion, and detergency properties. Specialized lubricants for electric vehicles (EVs) are also emerging, designed to manage thermal challenges and ensure the longevity of electric powertrains.
Key Drivers, Barriers & Challenges in Lubricants Industry
Key Drivers:
- Growing Automotive Sector: Increasing global vehicle production and the aftermarket demand for engine oils and transmission fluids.
- Industrialization and Infrastructure Development: Escalating need for hydraulic fluids, greases, and metalworking fluids in manufacturing, construction, and mining.
- Technological Advancements: Development of high-performance synthetic and bio-based lubricants offering superior efficiency and sustainability.
- Stringent Environmental Regulations: Driving innovation towards eco-friendly and low-emission lubricant solutions.
Barriers & Challenges:
- Raw Material Price Volatility: Fluctuations in crude oil prices impact the cost of base oils, a primary component of lubricants.
- Intense Competition: A fragmented market with numerous players, leading to price pressures and limited margins.
- Counterfeit Products: The proliferation of fake lubricants erodes market trust and impacts legitimate manufacturers.
- Supply Chain Disruptions: Geopolitical events and logistics challenges can impact the availability and distribution of raw materials and finished products. The impact of supply chain issues can lead to delays of 10-20% in product delivery.
Emerging Opportunities in Lubricants Industry
Emerging opportunities lie in the development of specialized lubricants for niche applications, such as high-performance lubricants for renewable energy systems (wind turbines, solar panels) and advanced lubricants for the rapidly growing electric vehicle (EV) market. The demand for sustainable and biodegradable lubricants is expanding, creating opportunities for companies focusing on bio-based formulations and environmentally friendly production processes. The trend towards predictive maintenance and the Industrial Internet of Things (IIoT) presents an opportunity for "smart" lubricants with embedded sensors or properties that can provide real-time performance data and alert users to potential issues. Furthermore, untapped markets in developing regions with increasing industrialization offer significant growth potential.
Growth Accelerators in the Lubricants Industry Industry
Technological breakthroughs in lubricant formulation, particularly in synthetic base oils and advanced additive packages, are key growth accelerators. Strategic partnerships and collaborations between lubricant manufacturers and original equipment manufacturers (OEMs) are crucial for developing and certifying lubricants that meet the specific requirements of new machinery and vehicles. Market expansion strategies, including direct entry into high-growth emerging economies and the acquisition of local players, also play a vital role in accelerating growth. The increasing focus on digitalization and data analytics within the industry is enabling more efficient product development, supply chain management, and customer engagement, further stimulating growth.
Key Players Shaping the Lubricants Industry Market
- Behran Oil Company
- BP PLC (Castrol)
- Carl Bechem GmbH
- Chevron Corporation
- China National Petroleum Corporation
- China Petroleum & Chemical Corporation
- Coperative Soceite des petroleum
- ENEOS Corporation
- Eni SpA
- ExxonMobil Corporation
- FUCHS
- Gazprom
- GS Caltex
- Gulf Oil International
- Hindustan Petroleum Corporation Limited
- Idemitsu Kosan Co Ltd
- Indian Oil Corporation Limited
- Lukoil
- Motul
- Petromin Corporation
- Petronas Lubricants International
- Phillips 66 Lubricants
- PT Pertamina
- PTT Lubricants
- Rosneft
- Royal Dutch Shell PLC
- Terpel
- TotalEnergies
- Valvoline Inc
- YP
Notable Milestones in Lubricants Industry Sector
- May 2022: TotalEnergies and NEXUS Automotive extended their strategic partnership for five years, with TotalEnergies Lubricants expanding its presence in the N! community, which saw sales surge from EUR 7.2 billion in 2015 to nearly EUR 35 billion by the end of 2021.
- April 2022: FUCHS introduced AGRI FARM lubricants, specifically designed for high-end agricultural machines, enhancing operational efficiency and longevity.
- April 2022: FUCHS Lubricants South Africa launched new food-grade Renolin SJL Heavy and Renolin SJL Winter lubricants for the sugar processing industry, offering benefits such as extended equipment life and improved food safety.
In-Depth Lubricants Industry Market Outlook
The lubricants industry outlook is exceptionally positive, with sustained growth driven by ongoing technological advancements and evolving market demands. The projected growth of 4.2% CAGR from 2025 to 2033, reaching an estimated $175.3 billion, highlights significant future potential. Strategic opportunities abound in the development of lubricants for emerging technologies, such as electric vehicles and renewable energy, as well as in catering to the increasing global demand for sustainable and biodegradable products. Key players will likely continue to leverage mergers, acquisitions, and strategic partnerships to expand their market reach, technological capabilities, and product portfolios. The industry's resilience and adaptability to new challenges, coupled with a strong emphasis on innovation, will pave the way for continued expansion and profitability in the coming years.
Lubricants Industry Segmentation
-
1. End User
- 1.1. Automotive
- 1.2. Heavy Equipment
- 1.3. Metallurgy & Metalworking
- 1.4. Power Generation
- 1.5. Other End-user Industries
-
2. Product Type
- 2.1. Engine Oils
- 2.2. Greases
- 2.3. Hydraulic Fluids
- 2.4. Metalworking Fluids
- 2.5. Transmission & Gear Oils
- 2.6. Other Product Types
Lubricants Industry Segmentation By Geography
-
1. North America
- 1.1. United States
- 1.2. Canada
- 1.3. Mexico
-
2. South America
- 2.1. Brazil
- 2.2. Argentina
- 2.3. Rest of South America
-
3. Europe
- 3.1. United Kingdom
- 3.2. Germany
- 3.3. France
- 3.4. Italy
- 3.5. Spain
- 3.6. Russia
- 3.7. Benelux
- 3.8. Nordics
- 3.9. Rest of Europe
-
4. Middle East & Africa
- 4.1. Turkey
- 4.2. Israel
- 4.3. GCC
- 4.4. North Africa
- 4.5. South Africa
- 4.6. Rest of Middle East & Africa
-
5. Asia Pacific
- 5.1. China
- 5.2. India
- 5.3. Japan
- 5.4. South Korea
- 5.5. ASEAN
- 5.6. Oceania
- 5.7. Rest of Asia Pacific
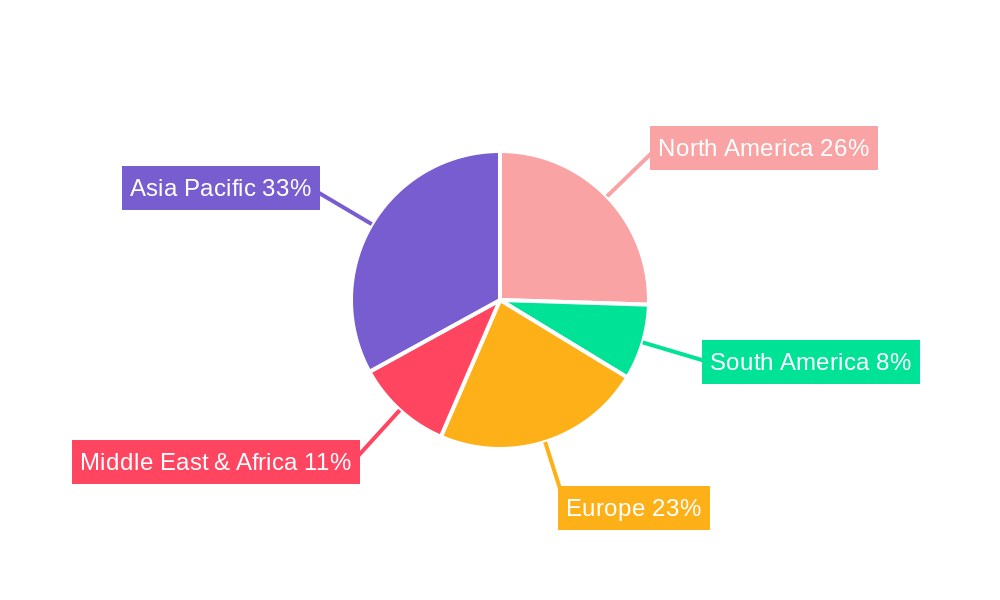
Lubricants Industry Regional Market Share
Geographic Coverage of Lubricants Industry
Lubricants Industry REPORT HIGHLIGHTS
| Aspects | Details |
|---|---|
| Study Period | 2020-2034 |
| Base Year | 2025 |
| Estimated Year | 2026 |
| Forecast Period | 2026-2034 |
| Historical Period | 2020-2025 |
| Growth Rate | CAGR of 2% from 2020-2034 |
| Segmentation |
|
Table of Contents
- 1. Introduction
- 1.1. Research Scope
- 1.2. Market Segmentation
- 1.3. Research Objective
- 1.4. Definitions and Assumptions
- 2. Executive Summary
- 2.1. Market Snapshot
- 3. Market Dynamics
- 3.1. Market Drivers
- 3.2. Market Restrains
- 3.3. Market Trends
- 3.4. Market Opportunities
- 4. Market Factor Analysis
- 4.1. Porters Five Forces
- 4.1.1. Bargaining Power of Suppliers
- 4.1.2. Bargaining Power of Buyers
- 4.1.3. Threat of New Entrants
- 4.1.4. Threat of Substitutes
- 4.1.5. Competitive Rivalry
- 4.2. PESTEL analysis
- 4.3. BCG Analysis
- 4.3.1. Stars (High Growth, High Market Share)
- 4.3.2. Cash Cows (Low Growth, High Market Share)
- 4.3.3. Question Mark (High Growth, Low Market Share)
- 4.3.4. Dogs (Low Growth, Low Market Share)
- 4.4. Ansoff Matrix Analysis
- 4.5. Supply Chain Analysis
- 4.6. Regulatory Landscape
- 4.7. Current Market Potential and Opportunity Assessment (TAM–SAM–SOM Framework)
- 4.8. VDR Analyst Note
- 4.1. Porters Five Forces
- 5. Market Analysis, Insights and Forecast 2021-2033
- 5.1. Market Analysis, Insights and Forecast - by End User
- 5.1.1. Automotive
- 5.1.2. Heavy Equipment
- 5.1.3. Metallurgy & Metalworking
- 5.1.4. Power Generation
- 5.1.5. Other End-user Industries
- 5.2. Market Analysis, Insights and Forecast - by Product Type
- 5.2.1. Engine Oils
- 5.2.2. Greases
- 5.2.3. Hydraulic Fluids
- 5.2.4. Metalworking Fluids
- 5.2.5. Transmission & Gear Oils
- 5.2.6. Other Product Types
- 5.3. Market Analysis, Insights and Forecast - by Region
- 5.3.1. North America
- 5.3.2. South America
- 5.3.3. Europe
- 5.3.4. Middle East & Africa
- 5.3.5. Asia Pacific
- 5.1. Market Analysis, Insights and Forecast - by End User
- 6. Global Lubricants Industry Analysis, Insights and Forecast, 2021-2033
- 6.1. Market Analysis, Insights and Forecast - by End User
- 6.1.1. Automotive
- 6.1.2. Heavy Equipment
- 6.1.3. Metallurgy & Metalworking
- 6.1.4. Power Generation
- 6.1.5. Other End-user Industries
- 6.2. Market Analysis, Insights and Forecast - by Product Type
- 6.2.1. Engine Oils
- 6.2.2. Greases
- 6.2.3. Hydraulic Fluids
- 6.2.4. Metalworking Fluids
- 6.2.5. Transmission & Gear Oils
- 6.2.6. Other Product Types
- 6.1. Market Analysis, Insights and Forecast - by End User
- 7. North America Lubricants Industry Analysis, Insights and Forecast, 2021-2033
- 7.1. Market Analysis, Insights and Forecast - by End User
- 7.1.1. Automotive
- 7.1.2. Heavy Equipment
- 7.1.3. Metallurgy & Metalworking
- 7.1.4. Power Generation
- 7.1.5. Other End-user Industries
- 7.2. Market Analysis, Insights and Forecast - by Product Type
- 7.2.1. Engine Oils
- 7.2.2. Greases
- 7.2.3. Hydraulic Fluids
- 7.2.4. Metalworking Fluids
- 7.2.5. Transmission & Gear Oils
- 7.2.6. Other Product Types
- 7.1. Market Analysis, Insights and Forecast - by End User
- 8. South America Lubricants Industry Analysis, Insights and Forecast, 2021-2033
- 8.1. Market Analysis, Insights and Forecast - by End User
- 8.1.1. Automotive
- 8.1.2. Heavy Equipment
- 8.1.3. Metallurgy & Metalworking
- 8.1.4. Power Generation
- 8.1.5. Other End-user Industries
- 8.2. Market Analysis, Insights and Forecast - by Product Type
- 8.2.1. Engine Oils
- 8.2.2. Greases
- 8.2.3. Hydraulic Fluids
- 8.2.4. Metalworking Fluids
- 8.2.5. Transmission & Gear Oils
- 8.2.6. Other Product Types
- 8.1. Market Analysis, Insights and Forecast - by End User
- 9. Europe Lubricants Industry Analysis, Insights and Forecast, 2021-2033
- 9.1. Market Analysis, Insights and Forecast - by End User
- 9.1.1. Automotive
- 9.1.2. Heavy Equipment
- 9.1.3. Metallurgy & Metalworking
- 9.1.4. Power Generation
- 9.1.5. Other End-user Industries
- 9.2. Market Analysis, Insights and Forecast - by Product Type
- 9.2.1. Engine Oils
- 9.2.2. Greases
- 9.2.3. Hydraulic Fluids
- 9.2.4. Metalworking Fluids
- 9.2.5. Transmission & Gear Oils
- 9.2.6. Other Product Types
- 9.1. Market Analysis, Insights and Forecast - by End User
- 10. Middle East & Africa Lubricants Industry Analysis, Insights and Forecast, 2021-2033
- 10.1. Market Analysis, Insights and Forecast - by End User
- 10.1.1. Automotive
- 10.1.2. Heavy Equipment
- 10.1.3. Metallurgy & Metalworking
- 10.1.4. Power Generation
- 10.1.5. Other End-user Industries
- 10.2. Market Analysis, Insights and Forecast - by Product Type
- 10.2.1. Engine Oils
- 10.2.2. Greases
- 10.2.3. Hydraulic Fluids
- 10.2.4. Metalworking Fluids
- 10.2.5. Transmission & Gear Oils
- 10.2.6. Other Product Types
- 10.1. Market Analysis, Insights and Forecast - by End User
- 11. Asia Pacific Lubricants Industry Analysis, Insights and Forecast, 2021-2033
- 11.1. Market Analysis, Insights and Forecast - by End User
- 11.1.1. Automotive
- 11.1.2. Heavy Equipment
- 11.1.3. Metallurgy & Metalworking
- 11.1.4. Power Generation
- 11.1.5. Other End-user Industries
- 11.2. Market Analysis, Insights and Forecast - by Product Type
- 11.2.1. Engine Oils
- 11.2.2. Greases
- 11.2.3. Hydraulic Fluids
- 11.2.4. Metalworking Fluids
- 11.2.5. Transmission & Gear Oils
- 11.2.6. Other Product Types
- 11.1. Market Analysis, Insights and Forecast - by End User
- 12. Competitive Analysis
- 12.1. Company Profiles
- 12.1.1 Behran Oil Company
- 12.1.1.1. Company Overview
- 12.1.1.2. Products
- 12.1.1.3. Company Financials
- 12.1.1.4. SWOT Analysis
- 12.1.2 BP PLC (Castrol)
- 12.1.2.1. Company Overview
- 12.1.2.2. Products
- 12.1.2.3. Company Financials
- 12.1.2.4. SWOT Analysis
- 12.1.3 Carl Bechem GmbH
- 12.1.3.1. Company Overview
- 12.1.3.2. Products
- 12.1.3.3. Company Financials
- 12.1.3.4. SWOT Analysis
- 12.1.4 Chevron Corporation
- 12.1.4.1. Company Overview
- 12.1.4.2. Products
- 12.1.4.3. Company Financials
- 12.1.4.4. SWOT Analysis
- 12.1.5 China National Petroleum Corporation
- 12.1.5.1. Company Overview
- 12.1.5.2. Products
- 12.1.5.3. Company Financials
- 12.1.5.4. SWOT Analysis
- 12.1.6 China Petroleum & Chemical Corporation
- 12.1.6.1. Company Overview
- 12.1.6.2. Products
- 12.1.6.3. Company Financials
- 12.1.6.4. SWOT Analysis
- 12.1.7 Coperative Soceite des petroleum
- 12.1.7.1. Company Overview
- 12.1.7.2. Products
- 12.1.7.3. Company Financials
- 12.1.7.4. SWOT Analysis
- 12.1.8 ENEOS Corporation
- 12.1.8.1. Company Overview
- 12.1.8.2. Products
- 12.1.8.3. Company Financials
- 12.1.8.4. SWOT Analysis
- 12.1.9 Eni SpA
- 12.1.9.1. Company Overview
- 12.1.9.2. Products
- 12.1.9.3. Company Financials
- 12.1.9.4. SWOT Analysis
- 12.1.10 ExxonMobil Corporation
- 12.1.10.1. Company Overview
- 12.1.10.2. Products
- 12.1.10.3. Company Financials
- 12.1.10.4. SWOT Analysis
- 12.1.11 FUCHS
- 12.1.11.1. Company Overview
- 12.1.11.2. Products
- 12.1.11.3. Company Financials
- 12.1.11.4. SWOT Analysis
- 12.1.12 Gazprom
- 12.1.12.1. Company Overview
- 12.1.12.2. Products
- 12.1.12.3. Company Financials
- 12.1.12.4. SWOT Analysis
- 12.1.13 GS Caltex
- 12.1.13.1. Company Overview
- 12.1.13.2. Products
- 12.1.13.3. Company Financials
- 12.1.13.4. SWOT Analysis
- 12.1.14 Gulf Oil International
- 12.1.14.1. Company Overview
- 12.1.14.2. Products
- 12.1.14.3. Company Financials
- 12.1.14.4. SWOT Analysis
- 12.1.15 Hindustan Petroleum Corporation Limited
- 12.1.15.1. Company Overview
- 12.1.15.2. Products
- 12.1.15.3. Company Financials
- 12.1.15.4. SWOT Analysis
- 12.1.16 Idemitsu Kosan Co Ltd
- 12.1.16.1. Company Overview
- 12.1.16.2. Products
- 12.1.16.3. Company Financials
- 12.1.16.4. SWOT Analysis
- 12.1.17 Indian Oil Corporation Limited
- 12.1.17.1. Company Overview
- 12.1.17.2. Products
- 12.1.17.3. Company Financials
- 12.1.17.4. SWOT Analysis
- 12.1.18 Lukoil
- 12.1.18.1. Company Overview
- 12.1.18.2. Products
- 12.1.18.3. Company Financials
- 12.1.18.4. SWOT Analysis
- 12.1.19 Motul
- 12.1.19.1. Company Overview
- 12.1.19.2. Products
- 12.1.19.3. Company Financials
- 12.1.19.4. SWOT Analysis
- 12.1.20 Petromin Corporation
- 12.1.20.1. Company Overview
- 12.1.20.2. Products
- 12.1.20.3. Company Financials
- 12.1.20.4. SWOT Analysis
- 12.1.21 Petronas Lubricants International
- 12.1.21.1. Company Overview
- 12.1.21.2. Products
- 12.1.21.3. Company Financials
- 12.1.21.4. SWOT Analysis
- 12.1.22 Phillips 66 Lubricants
- 12.1.22.1. Company Overview
- 12.1.22.2. Products
- 12.1.22.3. Company Financials
- 12.1.22.4. SWOT Analysis
- 12.1.23 PT Pertamina
- 12.1.23.1. Company Overview
- 12.1.23.2. Products
- 12.1.23.3. Company Financials
- 12.1.23.4. SWOT Analysis
- 12.1.24 PTT Lubricants
- 12.1.24.1. Company Overview
- 12.1.24.2. Products
- 12.1.24.3. Company Financials
- 12.1.24.4. SWOT Analysis
- 12.1.25 Rosneft
- 12.1.25.1. Company Overview
- 12.1.25.2. Products
- 12.1.25.3. Company Financials
- 12.1.25.4. SWOT Analysis
- 12.1.26 Royal Dutch Shell PLC
- 12.1.26.1. Company Overview
- 12.1.26.2. Products
- 12.1.26.3. Company Financials
- 12.1.26.4. SWOT Analysis
- 12.1.27 Terpel
- 12.1.27.1. Company Overview
- 12.1.27.2. Products
- 12.1.27.3. Company Financials
- 12.1.27.4. SWOT Analysis
- 12.1.28 TotalEnergies
- 12.1.28.1. Company Overview
- 12.1.28.2. Products
- 12.1.28.3. Company Financials
- 12.1.28.4. SWOT Analysis
- 12.1.29 Valvoline Inc
- 12.1.29.1. Company Overview
- 12.1.29.2. Products
- 12.1.29.3. Company Financials
- 12.1.29.4. SWOT Analysis
- 12.1.30 YP
- 12.1.30.1. Company Overview
- 12.1.30.2. Products
- 12.1.30.3. Company Financials
- 12.1.30.4. SWOT Analysis
- 12.1.1 Behran Oil Company
- 12.2. Market Entropy
- 12.2.1 Company's Key Areas Served
- 12.2.2 Recent Developments
- 12.3. Company Market Share Analysis 2025
- 12.3.1 Top 5 Companies Market Share Analysis
- 12.3.2 Top 3 Companies Market Share Analysis
- 12.4. List of Potential Customers
- 13. Research Methodology
List of Figures
- Figure 1: Global Lubricants Industry Revenue Breakdown (billion, %) by Region 2025 & 2033
- Figure 2: North America Lubricants Industry Revenue (billion), by End User 2025 & 2033
- Figure 3: North America Lubricants Industry Revenue Share (%), by End User 2025 & 2033
- Figure 4: North America Lubricants Industry Revenue (billion), by Product Type 2025 & 2033
- Figure 5: North America Lubricants Industry Revenue Share (%), by Product Type 2025 & 2033
- Figure 6: North America Lubricants Industry Revenue (billion), by Country 2025 & 2033
- Figure 7: North America Lubricants Industry Revenue Share (%), by Country 2025 & 2033
- Figure 8: South America Lubricants Industry Revenue (billion), by End User 2025 & 2033
- Figure 9: South America Lubricants Industry Revenue Share (%), by End User 2025 & 2033
- Figure 10: South America Lubricants Industry Revenue (billion), by Product Type 2025 & 2033
- Figure 11: South America Lubricants Industry Revenue Share (%), by Product Type 2025 & 2033
- Figure 12: South America Lubricants Industry Revenue (billion), by Country 2025 & 2033
- Figure 13: South America Lubricants Industry Revenue Share (%), by Country 2025 & 2033
- Figure 14: Europe Lubricants Industry Revenue (billion), by End User 2025 & 2033
- Figure 15: Europe Lubricants Industry Revenue Share (%), by End User 2025 & 2033
- Figure 16: Europe Lubricants Industry Revenue (billion), by Product Type 2025 & 2033
- Figure 17: Europe Lubricants Industry Revenue Share (%), by Product Type 2025 & 2033
- Figure 18: Europe Lubricants Industry Revenue (billion), by Country 2025 & 2033
- Figure 19: Europe Lubricants Industry Revenue Share (%), by Country 2025 & 2033
- Figure 20: Middle East & Africa Lubricants Industry Revenue (billion), by End User 2025 & 2033
- Figure 21: Middle East & Africa Lubricants Industry Revenue Share (%), by End User 2025 & 2033
- Figure 22: Middle East & Africa Lubricants Industry Revenue (billion), by Product Type 2025 & 2033
- Figure 23: Middle East & Africa Lubricants Industry Revenue Share (%), by Product Type 2025 & 2033
- Figure 24: Middle East & Africa Lubricants Industry Revenue (billion), by Country 2025 & 2033
- Figure 25: Middle East & Africa Lubricants Industry Revenue Share (%), by Country 2025 & 2033
- Figure 26: Asia Pacific Lubricants Industry Revenue (billion), by End User 2025 & 2033
- Figure 27: Asia Pacific Lubricants Industry Revenue Share (%), by End User 2025 & 2033
- Figure 28: Asia Pacific Lubricants Industry Revenue (billion), by Product Type 2025 & 2033
- Figure 29: Asia Pacific Lubricants Industry Revenue Share (%), by Product Type 2025 & 2033
- Figure 30: Asia Pacific Lubricants Industry Revenue (billion), by Country 2025 & 2033
- Figure 31: Asia Pacific Lubricants Industry Revenue Share (%), by Country 2025 & 2033
List of Tables
- Table 1: Global Lubricants Industry Revenue billion Forecast, by End User 2020 & 2033
- Table 2: Global Lubricants Industry Revenue billion Forecast, by Product Type 2020 & 2033
- Table 3: Global Lubricants Industry Revenue billion Forecast, by Region 2020 & 2033
- Table 4: Global Lubricants Industry Revenue billion Forecast, by End User 2020 & 2033
- Table 5: Global Lubricants Industry Revenue billion Forecast, by Product Type 2020 & 2033
- Table 6: Global Lubricants Industry Revenue billion Forecast, by Country 2020 & 2033
- Table 7: United States Lubricants Industry Revenue (billion) Forecast, by Application 2020 & 2033
- Table 8: Canada Lubricants Industry Revenue (billion) Forecast, by Application 2020 & 2033
- Table 9: Mexico Lubricants Industry Revenue (billion) Forecast, by Application 2020 & 2033
- Table 10: Global Lubricants Industry Revenue billion Forecast, by End User 2020 & 2033
- Table 11: Global Lubricants Industry Revenue billion Forecast, by Product Type 2020 & 2033
- Table 12: Global Lubricants Industry Revenue billion Forecast, by Country 2020 & 2033
- Table 13: Brazil Lubricants Industry Revenue (billion) Forecast, by Application 2020 & 2033
- Table 14: Argentina Lubricants Industry Revenue (billion) Forecast, by Application 2020 & 2033
- Table 15: Rest of South America Lubricants Industry Revenue (billion) Forecast, by Application 2020 & 2033
- Table 16: Global Lubricants Industry Revenue billion Forecast, by End User 2020 & 2033
- Table 17: Global Lubricants Industry Revenue billion Forecast, by Product Type 2020 & 2033
- Table 18: Global Lubricants Industry Revenue billion Forecast, by Country 2020 & 2033
- Table 19: United Kingdom Lubricants Industry Revenue (billion) Forecast, by Application 2020 & 2033
- Table 20: Germany Lubricants Industry Revenue (billion) Forecast, by Application 2020 & 2033
- Table 21: France Lubricants Industry Revenue (billion) Forecast, by Application 2020 & 2033
- Table 22: Italy Lubricants Industry Revenue (billion) Forecast, by Application 2020 & 2033
- Table 23: Spain Lubricants Industry Revenue (billion) Forecast, by Application 2020 & 2033
- Table 24: Russia Lubricants Industry Revenue (billion) Forecast, by Application 2020 & 2033
- Table 25: Benelux Lubricants Industry Revenue (billion) Forecast, by Application 2020 & 2033
- Table 26: Nordics Lubricants Industry Revenue (billion) Forecast, by Application 2020 & 2033
- Table 27: Rest of Europe Lubricants Industry Revenue (billion) Forecast, by Application 2020 & 2033
- Table 28: Global Lubricants Industry Revenue billion Forecast, by End User 2020 & 2033
- Table 29: Global Lubricants Industry Revenue billion Forecast, by Product Type 2020 & 2033
- Table 30: Global Lubricants Industry Revenue billion Forecast, by Country 2020 & 2033
- Table 31: Turkey Lubricants Industry Revenue (billion) Forecast, by Application 2020 & 2033
- Table 32: Israel Lubricants Industry Revenue (billion) Forecast, by Application 2020 & 2033
- Table 33: GCC Lubricants Industry Revenue (billion) Forecast, by Application 2020 & 2033
- Table 34: North Africa Lubricants Industry Revenue (billion) Forecast, by Application 2020 & 2033
- Table 35: South Africa Lubricants Industry Revenue (billion) Forecast, by Application 2020 & 2033
- Table 36: Rest of Middle East & Africa Lubricants Industry Revenue (billion) Forecast, by Application 2020 & 2033
- Table 37: Global Lubricants Industry Revenue billion Forecast, by End User 2020 & 2033
- Table 38: Global Lubricants Industry Revenue billion Forecast, by Product Type 2020 & 2033
- Table 39: Global Lubricants Industry Revenue billion Forecast, by Country 2020 & 2033
- Table 40: China Lubricants Industry Revenue (billion) Forecast, by Application 2020 & 2033
- Table 41: India Lubricants Industry Revenue (billion) Forecast, by Application 2020 & 2033
- Table 42: Japan Lubricants Industry Revenue (billion) Forecast, by Application 2020 & 2033
- Table 43: South Korea Lubricants Industry Revenue (billion) Forecast, by Application 2020 & 2033
- Table 44: ASEAN Lubricants Industry Revenue (billion) Forecast, by Application 2020 & 2033
- Table 45: Oceania Lubricants Industry Revenue (billion) Forecast, by Application 2020 & 2033
- Table 46: Rest of Asia Pacific Lubricants Industry Revenue (billion) Forecast, by Application 2020 & 2033
Frequently Asked Questions
1. What is the projected Compound Annual Growth Rate (CAGR) of the Lubricants Industry?
The projected CAGR is approximately 2%.
2. Which companies are prominent players in the Lubricants Industry?
Key companies in the market include Behran Oil Company, BP PLC (Castrol), Carl Bechem GmbH, Chevron Corporation, China National Petroleum Corporation, China Petroleum & Chemical Corporation, Coperative Soceite des petroleum, ENEOS Corporation, Eni SpA, ExxonMobil Corporation, FUCHS, Gazprom, GS Caltex, Gulf Oil International, Hindustan Petroleum Corporation Limited, Idemitsu Kosan Co Ltd, Indian Oil Corporation Limited, Lukoil, Motul, Petromin Corporation, Petronas Lubricants International, Phillips 66 Lubricants, PT Pertamina, PTT Lubricants, Rosneft, Royal Dutch Shell PLC, Terpel, TotalEnergies, Valvoline Inc, YP.
3. What are the main segments of the Lubricants Industry?
The market segments include End User, Product Type.
4. Can you provide details about the market size?
The market size is estimated to be USD 178.98 billion as of 2022.
5. What are some drivers contributing to market growth?
N/A
6. What are the notable trends driving market growth?
Largest Segment By End User : Automotive.
7. Are there any restraints impacting market growth?
N/A
8. Can you provide examples of recent developments in the market?
May 2022: TotalEnergies, NEXUS Automotive Extend Strategic Partnership for a period of five years. As part of this partnership, TotalEnergies Lubricants will be expanding its presence in the burgeoning N! community, which has seen rapid growth in sales from EUR 7.2 billion in 2015 to nearly EUR 35 billion by the end of 2021.April 2022: FUCHS company introduced AGRI FARM lubricants which are especially suited for high-end agricultural machines.April 2022: FUCHS Lubricants South Africa has introduced new food-grade Renolin SJL Heavy and Renolin SJL Winter lubricants for the sugar processing industry.The new lubricant offers benefits such as equipment longevity and food safety.
9. What pricing options are available for accessing the report?
Pricing options include single-user, multi-user, and enterprise licenses priced at USD 3800, USD 4500, and USD 5800 respectively.
10. Is the market size provided in terms of value or volume?
The market size is provided in terms of value, measured in billion.
11. Are there any specific market keywords associated with the report?
Yes, the market keyword associated with the report is "Lubricants Industry," which aids in identifying and referencing the specific market segment covered.
12. How do I determine which pricing option suits my needs best?
The pricing options vary based on user requirements and access needs. Individual users may opt for single-user licenses, while businesses requiring broader access may choose multi-user or enterprise licenses for cost-effective access to the report.
13. Are there any additional resources or data provided in the Lubricants Industry report?
While the report offers comprehensive insights, it's advisable to review the specific contents or supplementary materials provided to ascertain if additional resources or data are available.
14. How can I stay updated on further developments or reports in the Lubricants Industry?
To stay informed about further developments, trends, and reports in the Lubricants Industry, consider subscribing to industry newsletters, following relevant companies and organizations, or regularly checking reputable industry news sources and publications.
Methodology
Step 1 - Identification of Relevant Samples Size from Population Database


Step 2 - Approaches for Defining Global Market Size (Value, Volume* & Price*)

Note*: In applicable scenarios
Step 3 - Data Sources
Primary Research
- Web Analytics
- Survey Reports
- Research Institute
- Latest Research Reports
- Opinion Leaders
Secondary Research
- Annual Reports
- White Paper
- Latest Press Release
- Industry Association
- Paid Database
- Investor Presentations

Step 4 - Data Triangulation
Involves using different sources of information in order to increase the validity of a study
These sources are likely to be stakeholders in a program - participants, other researchers, program staff, other community members, and so on.
Then we put all data in single framework & apply various statistical tools to find out the dynamic on the market.
During the analysis stage, feedback from the stakeholder groups would be compared to determine areas of agreement as well as areas of divergence