

Key Insights
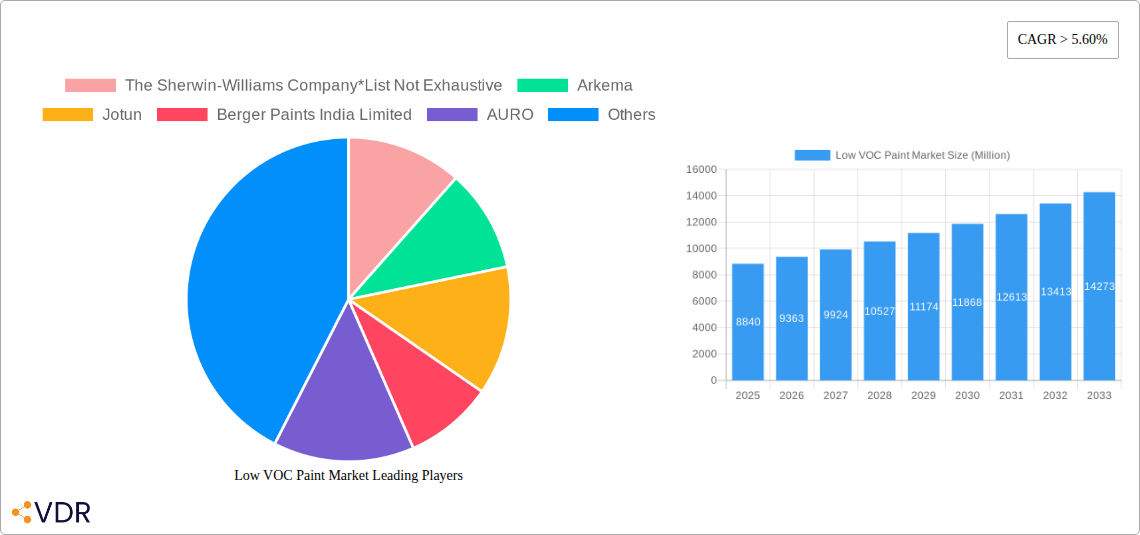
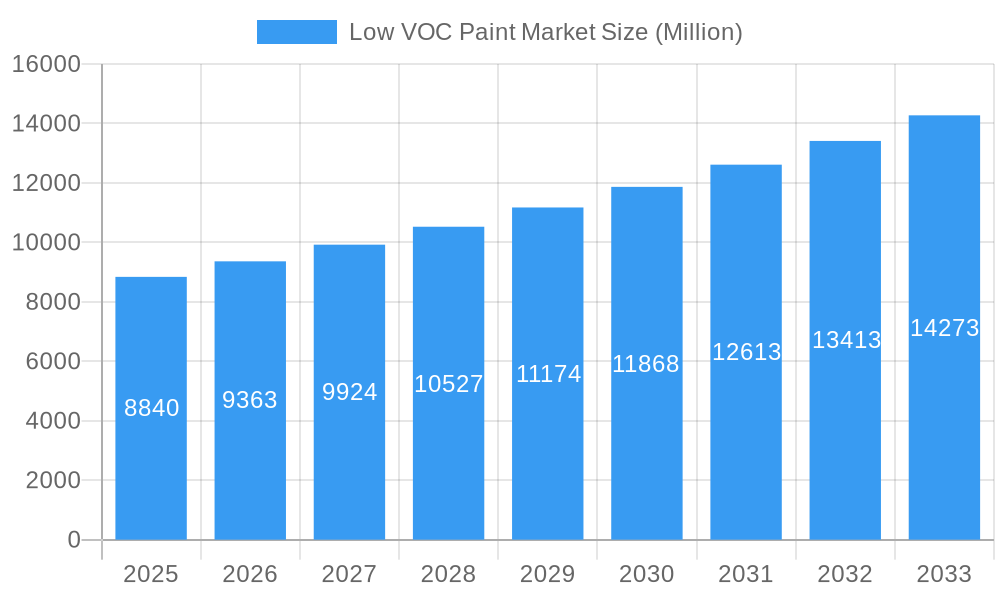
The low VOC paint market, valued at $8.84 billion in 2025, is experiencing robust growth, projected to expand at a CAGR exceeding 5.60% from 2025 to 2033. This surge is driven by increasing environmental regulations aimed at reducing volatile organic compound (VOC) emissions, growing consumer awareness of indoor air quality, and the rising demand for sustainable and eco-friendly building materials across diverse sectors. Key application areas like architectural and decorative coatings, automotive refinishing, and consumer durables are significant contributors to market expansion. The preference for water-borne formulations over solvent-borne options is further fueling market growth, as water-borne paints generally have lower VOC content and offer superior performance characteristics. The market is segmented by type (low-VOC, no/zero-VOC, natural) and formulation (water-borne, solvent-borne, powder), with water-borne formulations currently dominating due to their environmental benefits and cost-effectiveness. Competition is fierce, with major players such as Sherwin-Williams, PPG Industries, Akzo Nobel, and Asian Paints vying for market share through innovation in product development and expansion into new geographical regions.
Low VOC Paint Market Market Size (In Billion)
The Asia-Pacific region, particularly China and India, is expected to witness the most significant growth owing to rapid urbanization, infrastructural development, and increasing disposable incomes. North America and Europe, while mature markets, continue to contribute substantially to the overall market value, driven by stringent environmental regulations and the rising adoption of sustainable practices. The market faces certain restraints, including the higher initial cost of low-VOC paints compared to conventional alternatives and potential limitations in performance for certain applications. However, ongoing technological advancements are addressing these challenges, leading to the development of high-performance low-VOC paints that offer comparable durability and aesthetics to conventional options. This, coupled with continued governmental support for sustainable practices, will ensure the sustained growth of the low-VOC paint market in the coming years.
Low VOC Paint Market Company Market Share
Low VOC Paint Market: A Comprehensive Report (2019-2033)
This comprehensive report provides an in-depth analysis of the Low VOC Paint market, encompassing market dynamics, growth trends, regional dominance, product landscape, and key players. The study covers the period from 2019 to 2033, with 2025 as the base and estimated year. This report is vital for industry professionals, investors, and stakeholders seeking a detailed understanding of this rapidly evolving market. The parent market is the overall paints and coatings market, while the child market segments focus on various low-VOC paint types, formulations, and applications. The total market size in 2025 is estimated at XX Million units.
Low VOC Paint Market Market Dynamics & Structure
The Low VOC paint market is characterized by moderate concentration, with several key players holding significant market share. The market is driven by stringent environmental regulations aimed at reducing volatile organic compound (VOC) emissions and growing consumer awareness of health and environmental concerns. Technological innovation, particularly in water-borne and powder coatings, is another key driver. Mergers and acquisitions (M&A) activity is moderate, reflecting consolidation within the industry. Competitive substitutes include traditional high-VOC paints, but the shift towards eco-friendly options is accelerating. End-user demographics are diverse, encompassing residential, commercial, and industrial sectors.
- Market Concentration: Moderately concentrated, with the top 5 players holding approximately xx% market share in 2025.
- Technological Innovation: Significant advancements in water-borne and powder coating technologies are driving market growth. Innovation barriers include high R&D costs and the need for specialized equipment.
- Regulatory Framework: Stringent environmental regulations in various regions are pushing the adoption of low-VOC paints.
- Competitive Product Substitutes: High-VOC paints remain a substitute, but their market share is declining due to environmental concerns.
- M&A Trends: Moderate M&A activity, primarily focused on expanding product portfolios and geographic reach. Approximately xx M&A deals were recorded between 2019 and 2024.
- End-User Demographics: Diverse, including residential, commercial, industrial, and automotive sectors.
Low VOC Paint Market Growth Trends & Insights
The Low VOC paint market is experiencing robust growth, driven by increasing environmental awareness, stricter regulations, and a growing preference for sustainable products. The market size expanded from XX Million units in 2019 to an estimated XX Million units in 2025, exhibiting a CAGR of xx% during the historical period. This growth trajectory is expected to continue, with a projected CAGR of xx% during the forecast period (2025-2033), reaching an estimated XX Million units by 2033. Market penetration is increasing across various segments, particularly in the architecture and decorative sector. Technological advancements, such as the development of high-performance water-borne coatings, are contributing to improved adoption rates. Consumer behavior shifts toward eco-friendly products are also fueling market expansion.
Dominant Regions, Countries, or Segments in Low VOC Paint Market
North America and Europe are currently the dominant regions for Low VOC paints, driven by stringent environmental regulations and high consumer awareness. Within these regions, specific countries like the U.S., Germany, and the UK are leading the market. However, the Asia-Pacific region is projected to experience the fastest growth during the forecast period, fueled by increasing industrialization and urbanization.
- Dominant Segments: Water-borne formulation type holds the largest market share, followed by the architecture and decorative application segment. Low-VOC type paints comprise the largest segment by type.
- Key Drivers: Stringent environmental regulations, growing consumer awareness, increasing demand from construction and automotive industries. Government initiatives promoting sustainable building practices and infrastructure development are also key drivers.
- Dominance Factors: North America and Europe benefit from established regulatory frameworks and high consumer awareness. The Asia-Pacific region's rapid growth stems from rising disposable income and increased construction activities.
Low VOC Paint Market Product Landscape
The Low VOC paint market offers a diverse range of products, including water-borne, solvent-borne, and powder coatings. Innovation is focused on improving performance characteristics, such as durability, color retention, and ease of application, while maintaining low VOC content. Unique selling propositions often highlight enhanced sustainability, health benefits, and superior performance compared to traditional high-VOC paints. Technological advancements include the use of nanotechnology and bio-based materials to create more eco-friendly and efficient coatings.
Key Drivers, Barriers & Challenges in Low VOC Paint Market
Key Drivers: Stringent environmental regulations, growing consumer demand for eco-friendly products, technological advancements in water-borne and powder coatings, and increasing construction activity in developing economies.
Key Barriers and Challenges: High initial investment costs for manufacturers, limited availability of raw materials, potential performance limitations compared to some high-VOC alternatives, and complexities in meeting diverse regional regulatory requirements. Supply chain disruptions can also significantly impact production and pricing. The competitive landscape includes both large established players and new entrants, which increases market pressure.
Emerging Opportunities in Low VOC Paint Market
Emerging opportunities lie in untapped markets in developing regions, particularly in Asia and Latin America. The increasing demand for sustainable and eco-friendly products across various industries presents opportunities for new product development and innovation. Customized solutions for specific applications, such as antimicrobial coatings and self-cleaning surfaces, also present significant opportunities for growth. Moreover, the development of bio-based and recycled content paints provides new avenues for environmentally conscious manufacturers.
Growth Accelerators in the Low VOC Paint Market Industry
Technological breakthroughs in formulation and application techniques are accelerating market growth, enabling the development of high-performance low-VOC paints that meet stringent regulatory requirements and diverse consumer needs. Strategic partnerships and collaborations between paint manufacturers and raw material suppliers facilitate access to cutting-edge technologies and sustainable resources. Aggressive market expansion strategies into developing regions with high growth potential are further enhancing market reach and driving sales.
Key Players Shaping the Low VOC Paint Market Market
- The Sherwin-Williams Company
- Arkema
- Jotun
- Berger Paints India Limited
- AURO
- American Formulating & Manufacturing
- PPG Industries Inc
- Benjamin Moore & Co
- Nippon Paint Holdings Co Ltd
- BASF SE
- Cloverdale Paint Inc
- Kalekim
- Akzo Nobel N V
- BioShield Paint Company
- Crown Trade
- Axalta Coating Systems LLC
- Asian Paints
- Kansai Paint Co Ltd
- Fine Paints of Europe
Notable Milestones in Low VOC Paint Market Sector
- 2020: Several major paint manufacturers launched new lines of low-VOC paints with improved performance characteristics.
- 2021: Increased regulatory scrutiny on VOC emissions in several key markets.
- 2022: Significant investments in R&D for water-borne and powder coating technologies.
- 2023: Several mergers and acquisitions among smaller paint companies aiming for scale and market share.
- 2024: Introduction of innovative bio-based and recycled content low-VOC paints.
In-Depth Low VOC Paint Market Market Outlook
The Low VOC paint market is poised for continued strong growth driven by sustainability initiatives, evolving consumer preferences, and technological advancements. Future market potential is significant, particularly in developing regions and emerging applications. Strategic opportunities exist for companies that can innovate with sustainable raw materials, develop high-performance low-VOC coatings, and effectively address diverse regional regulatory landscapes. The market's long-term growth will be driven by the expanding awareness of the environmental and health impact of traditional paint and the strong regulatory push for sustainability in building and manufacturing processes.
Low VOC Paint Market Segmentation
-
1. Type
- 1.1. Low-VOC
- 1.2. No or Zero VOC
- 1.3. Natural
-
2. Formulation Type
- 2.1. Water-borne
- 2.2. Solvent-borne
- 2.3. Powder
-
3. Application
- 3.1. Architecture and Decorative
- 3.2. General Industrial
- 3.3. Automotive OEM
- 3.4. Automotive Refinish
- 3.5. Marine
- 3.6. Consumer Durables
- 3.7. Other Ap
Low VOC Paint Market Segmentation By Geography
-
1. Asia Pacific
- 1.1. China
- 1.2. India
- 1.3. Japan
- 1.4. South Korea
- 1.5. Rest of Asia Pacific
-
2. North America
- 2.1. United States
- 2.2. Canada
- 2.3. Mexico
-
3. Europe
- 3.1. Germany
- 3.2. United Kingdom
- 3.3. France
- 3.4. Italy
- 3.5. Rest of Europe
-
4. South America
- 4.1. Brazil
- 4.2. Argentina
- 4.3. Rest of South America
-
5. Middle East and Africa
- 5.1. Saudi Arabia
- 5.2. South Africa
- 5.3. Rest of Middle East and Africa
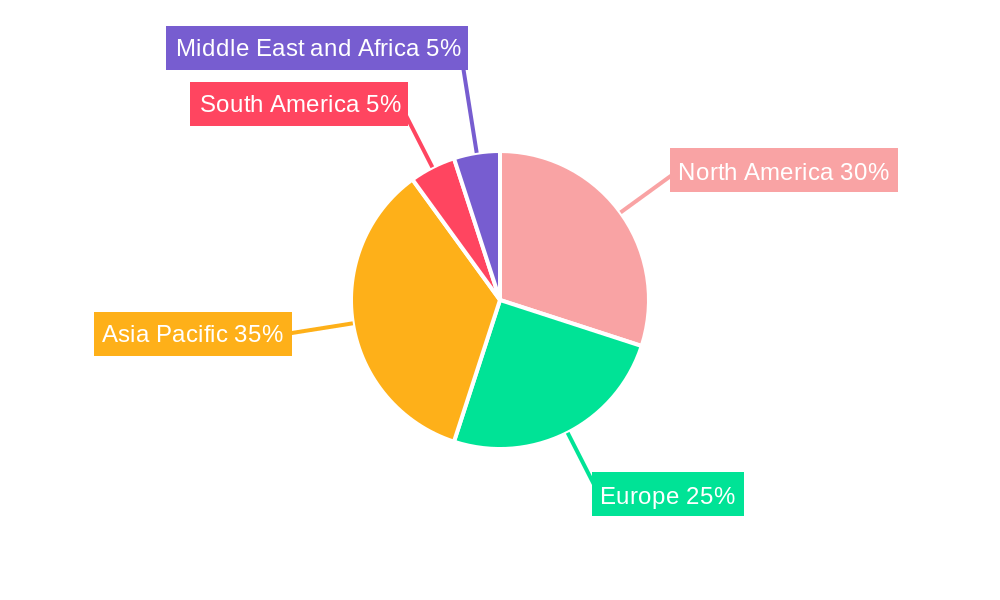
Low VOC Paint Market Regional Market Share
Geographic Coverage of Low VOC Paint Market
Low VOC Paint Market REPORT HIGHLIGHTS
| Aspects | Details |
|---|---|
| Study Period | 2020-2034 |
| Base Year | 2025 |
| Estimated Year | 2026 |
| Forecast Period | 2026-2034 |
| Historical Period | 2020-2025 |
| Growth Rate | CAGR of > 5.60% from 2020-2034 |
| Segmentation |
|
Table of Contents
- 1. Introduction
- 1.1. Research Scope
- 1.2. Market Segmentation
- 1.3. Research Objective
- 1.4. Definitions and Assumptions
- 2. Executive Summary
- 2.1. Market Snapshot
- 3. Market Dynamics
- 3.1. Market Drivers
- 3.2. Market Restrains
- 3.3. Market Trends
- 3.4. Market Opportunities
- 4. Market Factor Analysis
- 4.1. Porters Five Forces
- 4.1.1. Bargaining Power of Suppliers
- 4.1.2. Bargaining Power of Buyers
- 4.1.3. Threat of New Entrants
- 4.1.4. Threat of Substitutes
- 4.1.5. Competitive Rivalry
- 4.2. PESTEL analysis
- 4.3. BCG Analysis
- 4.3.1. Stars (High Growth, High Market Share)
- 4.3.2. Cash Cows (Low Growth, High Market Share)
- 4.3.3. Question Mark (High Growth, Low Market Share)
- 4.3.4. Dogs (Low Growth, Low Market Share)
- 4.4. Ansoff Matrix Analysis
- 4.5. Supply Chain Analysis
- 4.6. Regulatory Landscape
- 4.7. Current Market Potential and Opportunity Assessment (TAM–SAM–SOM Framework)
- 4.8. VDR Analyst Note
- 4.1. Porters Five Forces
- 5. Market Analysis, Insights and Forecast 2021-2033
- 5.1. Market Analysis, Insights and Forecast - by Type
- 5.1.1. Low-VOC
- 5.1.2. No or Zero VOC
- 5.1.3. Natural
- 5.2. Market Analysis, Insights and Forecast - by Formulation Type
- 5.2.1. Water-borne
- 5.2.2. Solvent-borne
- 5.2.3. Powder
- 5.3. Market Analysis, Insights and Forecast - by Application
- 5.3.1. Architecture and Decorative
- 5.3.2. General Industrial
- 5.3.3. Automotive OEM
- 5.3.4. Automotive Refinish
- 5.3.5. Marine
- 5.3.6. Consumer Durables
- 5.3.7. Other Ap
- 5.4. Market Analysis, Insights and Forecast - by Region
- 5.4.1. Asia Pacific
- 5.4.2. North America
- 5.4.3. Europe
- 5.4.4. South America
- 5.4.5. Middle East and Africa
- 5.1. Market Analysis, Insights and Forecast - by Type
- 6. Global Low VOC Paint Market Analysis, Insights and Forecast, 2021-2033
- 6.1. Market Analysis, Insights and Forecast - by Type
- 6.1.1. Low-VOC
- 6.1.2. No or Zero VOC
- 6.1.3. Natural
- 6.2. Market Analysis, Insights and Forecast - by Formulation Type
- 6.2.1. Water-borne
- 6.2.2. Solvent-borne
- 6.2.3. Powder
- 6.3. Market Analysis, Insights and Forecast - by Application
- 6.3.1. Architecture and Decorative
- 6.3.2. General Industrial
- 6.3.3. Automotive OEM
- 6.3.4. Automotive Refinish
- 6.3.5. Marine
- 6.3.6. Consumer Durables
- 6.3.7. Other Ap
- 6.1. Market Analysis, Insights and Forecast - by Type
- 7. Asia Pacific Low VOC Paint Market Analysis, Insights and Forecast, 2021-2033
- 7.1. Market Analysis, Insights and Forecast - by Type
- 7.1.1. Low-VOC
- 7.1.2. No or Zero VOC
- 7.1.3. Natural
- 7.2. Market Analysis, Insights and Forecast - by Formulation Type
- 7.2.1. Water-borne
- 7.2.2. Solvent-borne
- 7.2.3. Powder
- 7.3. Market Analysis, Insights and Forecast - by Application
- 7.3.1. Architecture and Decorative
- 7.3.2. General Industrial
- 7.3.3. Automotive OEM
- 7.3.4. Automotive Refinish
- 7.3.5. Marine
- 7.3.6. Consumer Durables
- 7.3.7. Other Ap
- 7.1. Market Analysis, Insights and Forecast - by Type
- 8. North America Low VOC Paint Market Analysis, Insights and Forecast, 2021-2033
- 8.1. Market Analysis, Insights and Forecast - by Type
- 8.1.1. Low-VOC
- 8.1.2. No or Zero VOC
- 8.1.3. Natural
- 8.2. Market Analysis, Insights and Forecast - by Formulation Type
- 8.2.1. Water-borne
- 8.2.2. Solvent-borne
- 8.2.3. Powder
- 8.3. Market Analysis, Insights and Forecast - by Application
- 8.3.1. Architecture and Decorative
- 8.3.2. General Industrial
- 8.3.3. Automotive OEM
- 8.3.4. Automotive Refinish
- 8.3.5. Marine
- 8.3.6. Consumer Durables
- 8.3.7. Other Ap
- 8.1. Market Analysis, Insights and Forecast - by Type
- 9. Europe Low VOC Paint Market Analysis, Insights and Forecast, 2021-2033
- 9.1. Market Analysis, Insights and Forecast - by Type
- 9.1.1. Low-VOC
- 9.1.2. No or Zero VOC
- 9.1.3. Natural
- 9.2. Market Analysis, Insights and Forecast - by Formulation Type
- 9.2.1. Water-borne
- 9.2.2. Solvent-borne
- 9.2.3. Powder
- 9.3. Market Analysis, Insights and Forecast - by Application
- 9.3.1. Architecture and Decorative
- 9.3.2. General Industrial
- 9.3.3. Automotive OEM
- 9.3.4. Automotive Refinish
- 9.3.5. Marine
- 9.3.6. Consumer Durables
- 9.3.7. Other Ap
- 9.1. Market Analysis, Insights and Forecast - by Type
- 10. South America Low VOC Paint Market Analysis, Insights and Forecast, 2021-2033
- 10.1. Market Analysis, Insights and Forecast - by Type
- 10.1.1. Low-VOC
- 10.1.2. No or Zero VOC
- 10.1.3. Natural
- 10.2. Market Analysis, Insights and Forecast - by Formulation Type
- 10.2.1. Water-borne
- 10.2.2. Solvent-borne
- 10.2.3. Powder
- 10.3. Market Analysis, Insights and Forecast - by Application
- 10.3.1. Architecture and Decorative
- 10.3.2. General Industrial
- 10.3.3. Automotive OEM
- 10.3.4. Automotive Refinish
- 10.3.5. Marine
- 10.3.6. Consumer Durables
- 10.3.7. Other Ap
- 10.1. Market Analysis, Insights and Forecast - by Type
- 11. Middle East and Africa Low VOC Paint Market Analysis, Insights and Forecast, 2021-2033
- 11.1. Market Analysis, Insights and Forecast - by Type
- 11.1.1. Low-VOC
- 11.1.2. No or Zero VOC
- 11.1.3. Natural
- 11.2. Market Analysis, Insights and Forecast - by Formulation Type
- 11.2.1. Water-borne
- 11.2.2. Solvent-borne
- 11.2.3. Powder
- 11.3. Market Analysis, Insights and Forecast - by Application
- 11.3.1. Architecture and Decorative
- 11.3.2. General Industrial
- 11.3.3. Automotive OEM
- 11.3.4. Automotive Refinish
- 11.3.5. Marine
- 11.3.6. Consumer Durables
- 11.3.7. Other Ap
- 11.1. Market Analysis, Insights and Forecast - by Type
- 12. Competitive Analysis
- 12.1. Company Profiles
- 12.1.1 The Sherwin-Williams Company*List Not Exhaustive
- 12.1.1.1. Company Overview
- 12.1.1.2. Products
- 12.1.1.3. Company Financials
- 12.1.1.4. SWOT Analysis
- 12.1.2 Arkema
- 12.1.2.1. Company Overview
- 12.1.2.2. Products
- 12.1.2.3. Company Financials
- 12.1.2.4. SWOT Analysis
- 12.1.3 Jotun
- 12.1.3.1. Company Overview
- 12.1.3.2. Products
- 12.1.3.3. Company Financials
- 12.1.3.4. SWOT Analysis
- 12.1.4 Berger Paints India Limited
- 12.1.4.1. Company Overview
- 12.1.4.2. Products
- 12.1.4.3. Company Financials
- 12.1.4.4. SWOT Analysis
- 12.1.5 AURO
- 12.1.5.1. Company Overview
- 12.1.5.2. Products
- 12.1.5.3. Company Financials
- 12.1.5.4. SWOT Analysis
- 12.1.6 American Formulating & Manufacturing
- 12.1.6.1. Company Overview
- 12.1.6.2. Products
- 12.1.6.3. Company Financials
- 12.1.6.4. SWOT Analysis
- 12.1.7 PPG Industries Inc
- 12.1.7.1. Company Overview
- 12.1.7.2. Products
- 12.1.7.3. Company Financials
- 12.1.7.4. SWOT Analysis
- 12.1.8 Benjamin Moore & Co
- 12.1.8.1. Company Overview
- 12.1.8.2. Products
- 12.1.8.3. Company Financials
- 12.1.8.4. SWOT Analysis
- 12.1.9 Nippon Paint Holdings Co Ltd
- 12.1.9.1. Company Overview
- 12.1.9.2. Products
- 12.1.9.3. Company Financials
- 12.1.9.4. SWOT Analysis
- 12.1.10 BASF SE
- 12.1.10.1. Company Overview
- 12.1.10.2. Products
- 12.1.10.3. Company Financials
- 12.1.10.4. SWOT Analysis
- 12.1.11 Cloverdale Paint Inc
- 12.1.11.1. Company Overview
- 12.1.11.2. Products
- 12.1.11.3. Company Financials
- 12.1.11.4. SWOT Analysis
- 12.1.12 Kalekim
- 12.1.12.1. Company Overview
- 12.1.12.2. Products
- 12.1.12.3. Company Financials
- 12.1.12.4. SWOT Analysis
- 12.1.13 Akzo Nobel N V
- 12.1.13.1. Company Overview
- 12.1.13.2. Products
- 12.1.13.3. Company Financials
- 12.1.13.4. SWOT Analysis
- 12.1.14 BioShield Paint Company
- 12.1.14.1. Company Overview
- 12.1.14.2. Products
- 12.1.14.3. Company Financials
- 12.1.14.4. SWOT Analysis
- 12.1.15 Crown Trade
- 12.1.15.1. Company Overview
- 12.1.15.2. Products
- 12.1.15.3. Company Financials
- 12.1.15.4. SWOT Analysis
- 12.1.16 Axalta Coating Systems LLC
- 12.1.16.1. Company Overview
- 12.1.16.2. Products
- 12.1.16.3. Company Financials
- 12.1.16.4. SWOT Analysis
- 12.1.17 Asian Paints
- 12.1.17.1. Company Overview
- 12.1.17.2. Products
- 12.1.17.3. Company Financials
- 12.1.17.4. SWOT Analysis
- 12.1.18 Kansai Paint Co Ltd
- 12.1.18.1. Company Overview
- 12.1.18.2. Products
- 12.1.18.3. Company Financials
- 12.1.18.4. SWOT Analysis
- 12.1.19 Fine Paints of Europe
- 12.1.19.1. Company Overview
- 12.1.19.2. Products
- 12.1.19.3. Company Financials
- 12.1.19.4. SWOT Analysis
- 12.1.1 The Sherwin-Williams Company*List Not Exhaustive
- 12.2. Market Entropy
- 12.2.1 Company's Key Areas Served
- 12.2.2 Recent Developments
- 12.3. Company Market Share Analysis 2025
- 12.3.1 Top 5 Companies Market Share Analysis
- 12.3.2 Top 3 Companies Market Share Analysis
- 12.4. List of Potential Customers
- 13. Research Methodology
List of Figures
- Figure 1: Global Low VOC Paint Market Revenue Breakdown (Million, %) by Region 2025 & 2033
- Figure 2: Global Low VOC Paint Market Volume Breakdown (K Tons, %) by Region 2025 & 2033
- Figure 3: Asia Pacific Low VOC Paint Market Revenue (Million), by Type 2025 & 2033
- Figure 4: Asia Pacific Low VOC Paint Market Volume (K Tons), by Type 2025 & 2033
- Figure 5: Asia Pacific Low VOC Paint Market Revenue Share (%), by Type 2025 & 2033
- Figure 6: Asia Pacific Low VOC Paint Market Volume Share (%), by Type 2025 & 2033
- Figure 7: Asia Pacific Low VOC Paint Market Revenue (Million), by Formulation Type 2025 & 2033
- Figure 8: Asia Pacific Low VOC Paint Market Volume (K Tons), by Formulation Type 2025 & 2033
- Figure 9: Asia Pacific Low VOC Paint Market Revenue Share (%), by Formulation Type 2025 & 2033
- Figure 10: Asia Pacific Low VOC Paint Market Volume Share (%), by Formulation Type 2025 & 2033
- Figure 11: Asia Pacific Low VOC Paint Market Revenue (Million), by Application 2025 & 2033
- Figure 12: Asia Pacific Low VOC Paint Market Volume (K Tons), by Application 2025 & 2033
- Figure 13: Asia Pacific Low VOC Paint Market Revenue Share (%), by Application 2025 & 2033
- Figure 14: Asia Pacific Low VOC Paint Market Volume Share (%), by Application 2025 & 2033
- Figure 15: Asia Pacific Low VOC Paint Market Revenue (Million), by Country 2025 & 2033
- Figure 16: Asia Pacific Low VOC Paint Market Volume (K Tons), by Country 2025 & 2033
- Figure 17: Asia Pacific Low VOC Paint Market Revenue Share (%), by Country 2025 & 2033
- Figure 18: Asia Pacific Low VOC Paint Market Volume Share (%), by Country 2025 & 2033
- Figure 19: North America Low VOC Paint Market Revenue (Million), by Type 2025 & 2033
- Figure 20: North America Low VOC Paint Market Volume (K Tons), by Type 2025 & 2033
- Figure 21: North America Low VOC Paint Market Revenue Share (%), by Type 2025 & 2033
- Figure 22: North America Low VOC Paint Market Volume Share (%), by Type 2025 & 2033
- Figure 23: North America Low VOC Paint Market Revenue (Million), by Formulation Type 2025 & 2033
- Figure 24: North America Low VOC Paint Market Volume (K Tons), by Formulation Type 2025 & 2033
- Figure 25: North America Low VOC Paint Market Revenue Share (%), by Formulation Type 2025 & 2033
- Figure 26: North America Low VOC Paint Market Volume Share (%), by Formulation Type 2025 & 2033
- Figure 27: North America Low VOC Paint Market Revenue (Million), by Application 2025 & 2033
- Figure 28: North America Low VOC Paint Market Volume (K Tons), by Application 2025 & 2033
- Figure 29: North America Low VOC Paint Market Revenue Share (%), by Application 2025 & 2033
- Figure 30: North America Low VOC Paint Market Volume Share (%), by Application 2025 & 2033
- Figure 31: North America Low VOC Paint Market Revenue (Million), by Country 2025 & 2033
- Figure 32: North America Low VOC Paint Market Volume (K Tons), by Country 2025 & 2033
- Figure 33: North America Low VOC Paint Market Revenue Share (%), by Country 2025 & 2033
- Figure 34: North America Low VOC Paint Market Volume Share (%), by Country 2025 & 2033
- Figure 35: Europe Low VOC Paint Market Revenue (Million), by Type 2025 & 2033
- Figure 36: Europe Low VOC Paint Market Volume (K Tons), by Type 2025 & 2033
- Figure 37: Europe Low VOC Paint Market Revenue Share (%), by Type 2025 & 2033
- Figure 38: Europe Low VOC Paint Market Volume Share (%), by Type 2025 & 2033
- Figure 39: Europe Low VOC Paint Market Revenue (Million), by Formulation Type 2025 & 2033
- Figure 40: Europe Low VOC Paint Market Volume (K Tons), by Formulation Type 2025 & 2033
- Figure 41: Europe Low VOC Paint Market Revenue Share (%), by Formulation Type 2025 & 2033
- Figure 42: Europe Low VOC Paint Market Volume Share (%), by Formulation Type 2025 & 2033
- Figure 43: Europe Low VOC Paint Market Revenue (Million), by Application 2025 & 2033
- Figure 44: Europe Low VOC Paint Market Volume (K Tons), by Application 2025 & 2033
- Figure 45: Europe Low VOC Paint Market Revenue Share (%), by Application 2025 & 2033
- Figure 46: Europe Low VOC Paint Market Volume Share (%), by Application 2025 & 2033
- Figure 47: Europe Low VOC Paint Market Revenue (Million), by Country 2025 & 2033
- Figure 48: Europe Low VOC Paint Market Volume (K Tons), by Country 2025 & 2033
- Figure 49: Europe Low VOC Paint Market Revenue Share (%), by Country 2025 & 2033
- Figure 50: Europe Low VOC Paint Market Volume Share (%), by Country 2025 & 2033
- Figure 51: South America Low VOC Paint Market Revenue (Million), by Type 2025 & 2033
- Figure 52: South America Low VOC Paint Market Volume (K Tons), by Type 2025 & 2033
- Figure 53: South America Low VOC Paint Market Revenue Share (%), by Type 2025 & 2033
- Figure 54: South America Low VOC Paint Market Volume Share (%), by Type 2025 & 2033
- Figure 55: South America Low VOC Paint Market Revenue (Million), by Formulation Type 2025 & 2033
- Figure 56: South America Low VOC Paint Market Volume (K Tons), by Formulation Type 2025 & 2033
- Figure 57: South America Low VOC Paint Market Revenue Share (%), by Formulation Type 2025 & 2033
- Figure 58: South America Low VOC Paint Market Volume Share (%), by Formulation Type 2025 & 2033
- Figure 59: South America Low VOC Paint Market Revenue (Million), by Application 2025 & 2033
- Figure 60: South America Low VOC Paint Market Volume (K Tons), by Application 2025 & 2033
- Figure 61: South America Low VOC Paint Market Revenue Share (%), by Application 2025 & 2033
- Figure 62: South America Low VOC Paint Market Volume Share (%), by Application 2025 & 2033
- Figure 63: South America Low VOC Paint Market Revenue (Million), by Country 2025 & 2033
- Figure 64: South America Low VOC Paint Market Volume (K Tons), by Country 2025 & 2033
- Figure 65: South America Low VOC Paint Market Revenue Share (%), by Country 2025 & 2033
- Figure 66: South America Low VOC Paint Market Volume Share (%), by Country 2025 & 2033
- Figure 67: Middle East and Africa Low VOC Paint Market Revenue (Million), by Type 2025 & 2033
- Figure 68: Middle East and Africa Low VOC Paint Market Volume (K Tons), by Type 2025 & 2033
- Figure 69: Middle East and Africa Low VOC Paint Market Revenue Share (%), by Type 2025 & 2033
- Figure 70: Middle East and Africa Low VOC Paint Market Volume Share (%), by Type 2025 & 2033
- Figure 71: Middle East and Africa Low VOC Paint Market Revenue (Million), by Formulation Type 2025 & 2033
- Figure 72: Middle East and Africa Low VOC Paint Market Volume (K Tons), by Formulation Type 2025 & 2033
- Figure 73: Middle East and Africa Low VOC Paint Market Revenue Share (%), by Formulation Type 2025 & 2033
- Figure 74: Middle East and Africa Low VOC Paint Market Volume Share (%), by Formulation Type 2025 & 2033
- Figure 75: Middle East and Africa Low VOC Paint Market Revenue (Million), by Application 2025 & 2033
- Figure 76: Middle East and Africa Low VOC Paint Market Volume (K Tons), by Application 2025 & 2033
- Figure 77: Middle East and Africa Low VOC Paint Market Revenue Share (%), by Application 2025 & 2033
- Figure 78: Middle East and Africa Low VOC Paint Market Volume Share (%), by Application 2025 & 2033
- Figure 79: Middle East and Africa Low VOC Paint Market Revenue (Million), by Country 2025 & 2033
- Figure 80: Middle East and Africa Low VOC Paint Market Volume (K Tons), by Country 2025 & 2033
- Figure 81: Middle East and Africa Low VOC Paint Market Revenue Share (%), by Country 2025 & 2033
- Figure 82: Middle East and Africa Low VOC Paint Market Volume Share (%), by Country 2025 & 2033
List of Tables
- Table 1: Global Low VOC Paint Market Revenue Million Forecast, by Type 2020 & 2033
- Table 2: Global Low VOC Paint Market Volume K Tons Forecast, by Type 2020 & 2033
- Table 3: Global Low VOC Paint Market Revenue Million Forecast, by Formulation Type 2020 & 2033
- Table 4: Global Low VOC Paint Market Volume K Tons Forecast, by Formulation Type 2020 & 2033
- Table 5: Global Low VOC Paint Market Revenue Million Forecast, by Application 2020 & 2033
- Table 6: Global Low VOC Paint Market Volume K Tons Forecast, by Application 2020 & 2033
- Table 7: Global Low VOC Paint Market Revenue Million Forecast, by Region 2020 & 2033
- Table 8: Global Low VOC Paint Market Volume K Tons Forecast, by Region 2020 & 2033
- Table 9: Global Low VOC Paint Market Revenue Million Forecast, by Type 2020 & 2033
- Table 10: Global Low VOC Paint Market Volume K Tons Forecast, by Type 2020 & 2033
- Table 11: Global Low VOC Paint Market Revenue Million Forecast, by Formulation Type 2020 & 2033
- Table 12: Global Low VOC Paint Market Volume K Tons Forecast, by Formulation Type 2020 & 2033
- Table 13: Global Low VOC Paint Market Revenue Million Forecast, by Application 2020 & 2033
- Table 14: Global Low VOC Paint Market Volume K Tons Forecast, by Application 2020 & 2033
- Table 15: Global Low VOC Paint Market Revenue Million Forecast, by Country 2020 & 2033
- Table 16: Global Low VOC Paint Market Volume K Tons Forecast, by Country 2020 & 2033
- Table 17: China Low VOC Paint Market Revenue (Million) Forecast, by Application 2020 & 2033
- Table 18: China Low VOC Paint Market Volume (K Tons) Forecast, by Application 2020 & 2033
- Table 19: India Low VOC Paint Market Revenue (Million) Forecast, by Application 2020 & 2033
- Table 20: India Low VOC Paint Market Volume (K Tons) Forecast, by Application 2020 & 2033
- Table 21: Japan Low VOC Paint Market Revenue (Million) Forecast, by Application 2020 & 2033
- Table 22: Japan Low VOC Paint Market Volume (K Tons) Forecast, by Application 2020 & 2033
- Table 23: South Korea Low VOC Paint Market Revenue (Million) Forecast, by Application 2020 & 2033
- Table 24: South Korea Low VOC Paint Market Volume (K Tons) Forecast, by Application 2020 & 2033
- Table 25: Rest of Asia Pacific Low VOC Paint Market Revenue (Million) Forecast, by Application 2020 & 2033
- Table 26: Rest of Asia Pacific Low VOC Paint Market Volume (K Tons) Forecast, by Application 2020 & 2033
- Table 27: Global Low VOC Paint Market Revenue Million Forecast, by Type 2020 & 2033
- Table 28: Global Low VOC Paint Market Volume K Tons Forecast, by Type 2020 & 2033
- Table 29: Global Low VOC Paint Market Revenue Million Forecast, by Formulation Type 2020 & 2033
- Table 30: Global Low VOC Paint Market Volume K Tons Forecast, by Formulation Type 2020 & 2033
- Table 31: Global Low VOC Paint Market Revenue Million Forecast, by Application 2020 & 2033
- Table 32: Global Low VOC Paint Market Volume K Tons Forecast, by Application 2020 & 2033
- Table 33: Global Low VOC Paint Market Revenue Million Forecast, by Country 2020 & 2033
- Table 34: Global Low VOC Paint Market Volume K Tons Forecast, by Country 2020 & 2033
- Table 35: United States Low VOC Paint Market Revenue (Million) Forecast, by Application 2020 & 2033
- Table 36: United States Low VOC Paint Market Volume (K Tons) Forecast, by Application 2020 & 2033
- Table 37: Canada Low VOC Paint Market Revenue (Million) Forecast, by Application 2020 & 2033
- Table 38: Canada Low VOC Paint Market Volume (K Tons) Forecast, by Application 2020 & 2033
- Table 39: Mexico Low VOC Paint Market Revenue (Million) Forecast, by Application 2020 & 2033
- Table 40: Mexico Low VOC Paint Market Volume (K Tons) Forecast, by Application 2020 & 2033
- Table 41: Global Low VOC Paint Market Revenue Million Forecast, by Type 2020 & 2033
- Table 42: Global Low VOC Paint Market Volume K Tons Forecast, by Type 2020 & 2033
- Table 43: Global Low VOC Paint Market Revenue Million Forecast, by Formulation Type 2020 & 2033
- Table 44: Global Low VOC Paint Market Volume K Tons Forecast, by Formulation Type 2020 & 2033
- Table 45: Global Low VOC Paint Market Revenue Million Forecast, by Application 2020 & 2033
- Table 46: Global Low VOC Paint Market Volume K Tons Forecast, by Application 2020 & 2033
- Table 47: Global Low VOC Paint Market Revenue Million Forecast, by Country 2020 & 2033
- Table 48: Global Low VOC Paint Market Volume K Tons Forecast, by Country 2020 & 2033
- Table 49: Germany Low VOC Paint Market Revenue (Million) Forecast, by Application 2020 & 2033
- Table 50: Germany Low VOC Paint Market Volume (K Tons) Forecast, by Application 2020 & 2033
- Table 51: United Kingdom Low VOC Paint Market Revenue (Million) Forecast, by Application 2020 & 2033
- Table 52: United Kingdom Low VOC Paint Market Volume (K Tons) Forecast, by Application 2020 & 2033
- Table 53: France Low VOC Paint Market Revenue (Million) Forecast, by Application 2020 & 2033
- Table 54: France Low VOC Paint Market Volume (K Tons) Forecast, by Application 2020 & 2033
- Table 55: Italy Low VOC Paint Market Revenue (Million) Forecast, by Application 2020 & 2033
- Table 56: Italy Low VOC Paint Market Volume (K Tons) Forecast, by Application 2020 & 2033
- Table 57: Rest of Europe Low VOC Paint Market Revenue (Million) Forecast, by Application 2020 & 2033
- Table 58: Rest of Europe Low VOC Paint Market Volume (K Tons) Forecast, by Application 2020 & 2033
- Table 59: Global Low VOC Paint Market Revenue Million Forecast, by Type 2020 & 2033
- Table 60: Global Low VOC Paint Market Volume K Tons Forecast, by Type 2020 & 2033
- Table 61: Global Low VOC Paint Market Revenue Million Forecast, by Formulation Type 2020 & 2033
- Table 62: Global Low VOC Paint Market Volume K Tons Forecast, by Formulation Type 2020 & 2033
- Table 63: Global Low VOC Paint Market Revenue Million Forecast, by Application 2020 & 2033
- Table 64: Global Low VOC Paint Market Volume K Tons Forecast, by Application 2020 & 2033
- Table 65: Global Low VOC Paint Market Revenue Million Forecast, by Country 2020 & 2033
- Table 66: Global Low VOC Paint Market Volume K Tons Forecast, by Country 2020 & 2033
- Table 67: Brazil Low VOC Paint Market Revenue (Million) Forecast, by Application 2020 & 2033
- Table 68: Brazil Low VOC Paint Market Volume (K Tons) Forecast, by Application 2020 & 2033
- Table 69: Argentina Low VOC Paint Market Revenue (Million) Forecast, by Application 2020 & 2033
- Table 70: Argentina Low VOC Paint Market Volume (K Tons) Forecast, by Application 2020 & 2033
- Table 71: Rest of South America Low VOC Paint Market Revenue (Million) Forecast, by Application 2020 & 2033
- Table 72: Rest of South America Low VOC Paint Market Volume (K Tons) Forecast, by Application 2020 & 2033
- Table 73: Global Low VOC Paint Market Revenue Million Forecast, by Type 2020 & 2033
- Table 74: Global Low VOC Paint Market Volume K Tons Forecast, by Type 2020 & 2033
- Table 75: Global Low VOC Paint Market Revenue Million Forecast, by Formulation Type 2020 & 2033
- Table 76: Global Low VOC Paint Market Volume K Tons Forecast, by Formulation Type 2020 & 2033
- Table 77: Global Low VOC Paint Market Revenue Million Forecast, by Application 2020 & 2033
- Table 78: Global Low VOC Paint Market Volume K Tons Forecast, by Application 2020 & 2033
- Table 79: Global Low VOC Paint Market Revenue Million Forecast, by Country 2020 & 2033
- Table 80: Global Low VOC Paint Market Volume K Tons Forecast, by Country 2020 & 2033
- Table 81: Saudi Arabia Low VOC Paint Market Revenue (Million) Forecast, by Application 2020 & 2033
- Table 82: Saudi Arabia Low VOC Paint Market Volume (K Tons) Forecast, by Application 2020 & 2033
- Table 83: South Africa Low VOC Paint Market Revenue (Million) Forecast, by Application 2020 & 2033
- Table 84: South Africa Low VOC Paint Market Volume (K Tons) Forecast, by Application 2020 & 2033
- Table 85: Rest of Middle East and Africa Low VOC Paint Market Revenue (Million) Forecast, by Application 2020 & 2033
- Table 86: Rest of Middle East and Africa Low VOC Paint Market Volume (K Tons) Forecast, by Application 2020 & 2033
Frequently Asked Questions
1. What is the projected Compound Annual Growth Rate (CAGR) of the Low VOC Paint Market?
The projected CAGR is approximately > 5.60%.
2. Which companies are prominent players in the Low VOC Paint Market?
Key companies in the market include The Sherwin-Williams Company*List Not Exhaustive, Arkema, Jotun, Berger Paints India Limited, AURO, American Formulating & Manufacturing, PPG Industries Inc, Benjamin Moore & Co, Nippon Paint Holdings Co Ltd, BASF SE, Cloverdale Paint Inc, Kalekim, Akzo Nobel N V, BioShield Paint Company, Crown Trade, Axalta Coating Systems LLC, Asian Paints, Kansai Paint Co Ltd, Fine Paints of Europe.
3. What are the main segments of the Low VOC Paint Market?
The market segments include Type, Formulation Type, Application.
4. Can you provide details about the market size?
The market size is estimated to be USD 8.84 Million as of 2022.
5. What are some drivers contributing to market growth?
Increasing Awareness about Harmful Effects of Conventional Paint4.1.2 increasing Demand in Architectural and Decorative Industry; Other Drivers.
6. What are the notable trends driving market growth?
Architectural and Decorative Segment to Dominate the Market.
7. Are there any restraints impacting market growth?
High Cost in Comparison to Conventional Paint; Other Restraints.
8. Can you provide examples of recent developments in the market?
N/A
9. What pricing options are available for accessing the report?
Pricing options include single-user, multi-user, and enterprise licenses priced at USD 4750, USD 5250, and USD 8750 respectively.
10. Is the market size provided in terms of value or volume?
The market size is provided in terms of value, measured in Million and volume, measured in K Tons.
11. Are there any specific market keywords associated with the report?
Yes, the market keyword associated with the report is "Low VOC Paint Market," which aids in identifying and referencing the specific market segment covered.
12. How do I determine which pricing option suits my needs best?
The pricing options vary based on user requirements and access needs. Individual users may opt for single-user licenses, while businesses requiring broader access may choose multi-user or enterprise licenses for cost-effective access to the report.
13. Are there any additional resources or data provided in the Low VOC Paint Market report?
While the report offers comprehensive insights, it's advisable to review the specific contents or supplementary materials provided to ascertain if additional resources or data are available.
14. How can I stay updated on further developments or reports in the Low VOC Paint Market?
To stay informed about further developments, trends, and reports in the Low VOC Paint Market, consider subscribing to industry newsletters, following relevant companies and organizations, or regularly checking reputable industry news sources and publications.
Methodology
Step 1 - Identification of Relevant Samples Size from Population Database


Step 2 - Approaches for Defining Global Market Size (Value, Volume* & Price*)

Note*: In applicable scenarios
Step 3 - Data Sources
Primary Research
- Web Analytics
- Survey Reports
- Research Institute
- Latest Research Reports
- Opinion Leaders
Secondary Research
- Annual Reports
- White Paper
- Latest Press Release
- Industry Association
- Paid Database
- Investor Presentations

Step 4 - Data Triangulation
Involves using different sources of information in order to increase the validity of a study
These sources are likely to be stakeholders in a program - participants, other researchers, program staff, other community members, and so on.
Then we put all data in single framework & apply various statistical tools to find out the dynamic on the market.
During the analysis stage, feedback from the stakeholder groups would be compared to determine areas of agreement as well as areas of divergence