


Key Insights
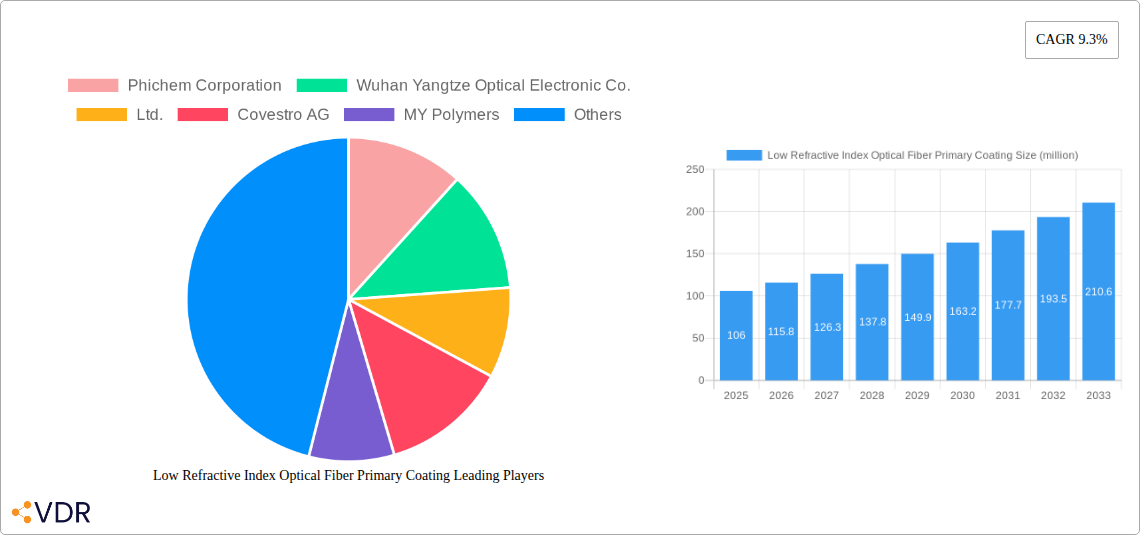
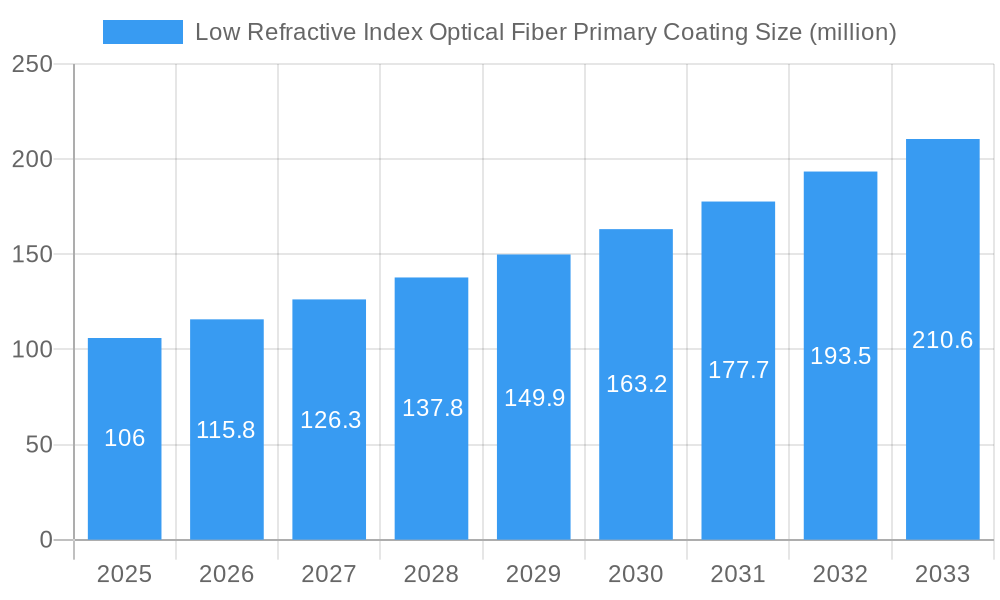
The global market for Low Refractive Index Optical Fiber Primary Coating is poised for significant expansion, projected to reach approximately $106 million in value by 2025. This robust growth is underpinned by a compelling Compound Annual Growth Rate (CAGR) of 9.3%, indicating sustained momentum throughout the forecast period of 2025-2033. The primary drivers of this surge are the escalating demand for high-performance optical fibers in telecommunications, data centers, and advanced sensing applications. As data transmission speeds and bandwidth requirements continue to climb, the need for primary coatings that offer superior optical and mechanical protection becomes paramount. These coatings are essential for maintaining signal integrity and protecting the delicate glass core from environmental stresses, ensuring the longevity and reliability of optical communication systems. The market is segmented across various applications, including Polyimide Fiber, Polyacrylate Fiber, and Silicone Fiber, each catering to specific performance needs. Furthermore, the classification by refractive index, particularly for ≤ 1.36, highlights the precision engineering involved in developing these specialized materials. The market's growth trajectory suggests a strong upward trend, reflecting increasing investments in next-generation network infrastructure and the continued digitalization of economies worldwide.
Low Refractive Index Optical Fiber Primary Coating Market Size (In Million)

The forecast period from 2019 to 2033, with a base year of 2025, reveals a dynamic market landscape characterized by technological advancements and evolving application needs. While specific restraints are not detailed, general market trends suggest that factors such as raw material price volatility, stringent regulatory compliance, and the development of alternative materials could present challenges. However, the inherent advantages of low refractive index primary coatings, including enhanced signal clarity and protection against microbending, are expected to outweigh these potential obstacles. The market's segmentation by fiber type and refractive index underscores the specialized nature of this industry, catering to niche but critical requirements. The anticipated growth rate strongly indicates that innovation in material science and manufacturing processes will be key to meeting the surging demand. Companies operating in this space are likely to focus on developing coatings with improved thermal stability, enhanced durability, and cost-effectiveness to capture a larger market share and capitalize on the expanding opportunities within the global optical fiber industry.
Low Refractive Index Optical Fiber Primary Coating Company Market Share
This comprehensive report provides an in-depth analysis of the global Low Refractive Index Optical Fiber Primary Coating market, offering crucial insights for industry stakeholders. Covering the study period from 2019 to 2033, with a base year of 2025, this report meticulously examines market dynamics, growth trends, regional landscapes, product innovations, key drivers, challenges, emerging opportunities, growth accelerators, prominent players, and notable milestones. Leveraging extensive data and expert analysis, this report aims to equip businesses with the strategic intelligence needed to navigate and capitalize on this rapidly evolving market.
Low Refractive Index Optical Fiber Primary Coating Market Dynamics & Structure
The Low Refractive Index Optical Fiber Primary Coating market exhibits a moderately concentrated structure, driven by specialized manufacturing processes and high technical expertise. Technological innovation remains a pivotal driver, with ongoing advancements focused on enhancing coating properties such as UV resistance, adhesion, and low refractive index values for improved optical signal integrity. Regulatory frameworks, particularly those concerning material safety and environmental impact in optical component manufacturing, play a significant role in shaping product development and market entry. Competitive product substitutes are limited, as specialized coatings are crucial for optical fiber performance. End-user demographics are predominantly in the telecommunications, data center, and industrial automation sectors, demanding reliable and high-performance optical solutions. Mergers and acquisitions (M&A) trends indicate strategic consolidation to gain market share and expand technological capabilities. The market witnessed xx M&A deals during the historical period, with a predicted increase in strategic alliances in the forecast period.
- Market Concentration: Moderately concentrated, with a few key players dominating the supply chain.
- Technological Innovation Drivers: Development of novel material formulations, enhanced curing technologies, and improved optical performance characteristics.
- Regulatory Frameworks: Increasing focus on environmental compliance and material safety standards for optical fiber manufacturing.
- Competitive Product Substitutes: Limited direct substitutes due to the highly specialized nature of primary coatings.
- End-User Demographics: Strong demand from telecommunications infrastructure, hyperscale data centers, and advanced industrial automation.
- M&A Trends: Strategic acquisitions to enhance R&D capabilities and broaden product portfolios, with xx planned strategic partnerships expected by 2033.
Low Refractive Index Optical Fiber Primary Coating Growth Trends & Insights
The global Low Refractive Index Optical Fiber Primary Coating market is poised for robust expansion, driven by the insatiable demand for high-speed data transmission and the proliferation of advanced optical networks. The market size, estimated at xx million USD in the base year 2025, is projected to reach xx million USD by 2033, exhibiting a Compound Annual Growth Rate (CAGR) of xx% during the forecast period. Adoption rates of low refractive index coatings are steadily increasing as network operators and equipment manufacturers recognize their critical role in minimizing signal loss and maximizing bandwidth, especially in demanding environments. Technological disruptions, such as advancements in polymer science and UV curing technologies, are continuously pushing the boundaries of coating performance, enabling thinner, more robust, and optically superior primary coatings. Consumer behavior shifts, characterized by an escalating reliance on data-intensive applications like cloud computing, AI, and 5G, are directly fueling the need for enhanced optical fiber capabilities. Market penetration of these specialized coatings is expected to grow from xx% in 2025 to xx% by 2033, reflecting their growing indispensability across various segments.
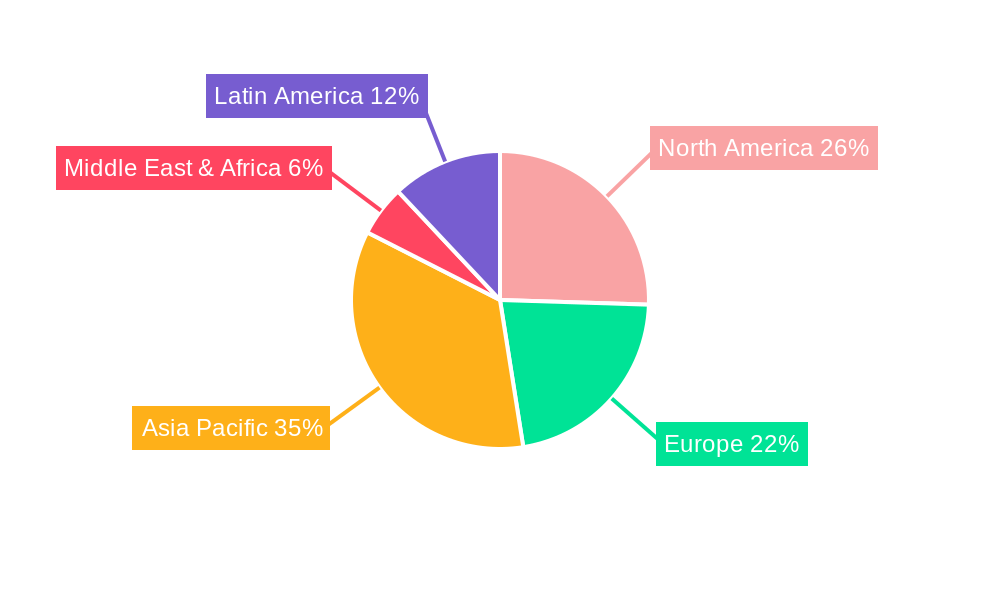
Dominant Regions, Countries, or Segments in Low Refractive Index Optical Fiber Primary Coating
The Low Refractive Index Optical Fiber Primary Coating market is dominated by the Polyacrylate Fiber application segment. Within this segment, coatings with a refractive index ≤ 1.36 are experiencing the highest demand. Geographically, Asia Pacific is the leading region, driven by its substantial manufacturing base for optical fibers and components, coupled with significant investments in telecommunications infrastructure. China, as a key player in the global optical fiber market, significantly influences regional dominance.
Low Refractive Index Optical Fiber Primary Coating Product Landscape
The product landscape for Low Refractive Index Optical Fiber Primary Coating is characterized by continuous innovation focused on achieving lower refractive indices, superior mechanical properties, and enhanced environmental resistance. These coatings are critical for protecting the delicate glass core of optical fibers from physical damage, moisture, and temperature fluctuations, thereby ensuring signal integrity. Key performance metrics include low loss tangents, excellent adhesion to the optical fiber, and optimized Young's modulus for flexibility and strength. Unique selling propositions often revolve around customized formulations catering to specific application needs, such as extreme temperature resistance or improved chemical inertness. Technological advancements are leading to the development of environmentally friendly formulations and faster curing times, further optimizing manufacturing processes.
Key Drivers, Barriers & Challenges in Low Refractive Index Optical Fiber Primary Coating
Key Drivers:
- Exponential Growth in Data Consumption: The ever-increasing demand for bandwidth in telecommunications and data centers is a primary driver.
- Expansion of 5G Networks: The deployment of 5G infrastructure necessitates advanced optical fibers with high-performance primary coatings.
- Technological Advancements in Optical Fiber Manufacturing: Innovations in fiber drawing and coating application processes enable the use of specialized low refractive index materials.
- Growing Adoption in Industrial and Automotive Sectors: Increasing use of optical fibers in smart factories, autonomous vehicles, and advanced sensing applications.
Key Barriers & Challenges:
- High R&D Costs: Developing advanced low refractive index materials requires significant investment in research and development.
- Stringent Performance Requirements: Meeting the demanding optical and mechanical specifications for high-performance optical fibers can be challenging.
- Supply Chain Volatility: Reliance on specialized raw materials can lead to supply chain disruptions and price fluctuations, with an estimated xx% impact on production costs during periods of instability.
- Competition from Alternative Technologies: While specialized, the optical fiber market faces indirect competition from other communication technologies.
- Skilled Workforce Shortage: The need for highly skilled personnel in advanced material science and manufacturing processes.
Emerging Opportunities in Low Refractive Index Optical Fiber Primary Coating
Emerging opportunities in the Low Refractive Index Optical Fiber Primary Coating market lie in the development of bio-based and sustainable coating materials, catering to growing environmental consciousness. The expansion of subsea optical cable networks and the increasing deployment of optical fibers in harsh environments (e.g., aerospace, oil and gas) present significant growth avenues. Furthermore, advancements in photonics and optical computing are creating demand for highly specialized coatings with precisely controlled optical properties. The integration of smart functionalities within primary coatings, such as self-healing properties or embedded sensors, represents a future frontier.
Growth Accelerators in the Low Refractive Index Optical Fiber Primary Coating Industry
Long-term growth in the Low Refractive Index Optical Fiber Primary Coating industry will be significantly accelerated by breakthroughs in material science, enabling coatings with even lower refractive indices and enhanced optical clarity. Strategic partnerships between coating manufacturers and optical fiber producers will streamline innovation and accelerate product adoption. Market expansion into emerging economies with rapidly developing digital infrastructure will further fuel demand. The continuous evolution of optical networking technologies, such as increased data rates and the integration of optical technologies into new domains, will necessitate ongoing advancements in primary coating performance, acting as a perpetual growth accelerator.
Key Players Shaping the Low Refractive Index Optical Fiber Primary Coating Market
- Phichem Corporation
- Wuhan Yangtze Optical Electronic Co.,Ltd.
- Covestro AG
- MY Polymers
- Luvantix ADM Co.,Ltd.
- Yangtze Optical Fibre and Cable Joint Stock Limited Company
Notable Milestones in Low Refractive Index Optical Fiber Primary Coating Sector
- 2019: Introduction of novel UV-curable acrylates with enhanced adhesion properties.
- 2020: Development of low refractive index coatings with improved resistance to extreme temperatures.
- 2021: Significant investment in R&D for sustainable and bio-based primary coating materials.
- 2022: Emergence of new players focusing on specialized niche applications.
- 2023: Advancements in manufacturing processes leading to faster curing times and reduced production costs.
- 2024: Increased focus on material compliance with evolving environmental regulations.
In-Depth Low Refractive Index Optical Fiber Primary Coating Market Outlook
The future market outlook for Low Refractive Index Optical Fiber Primary Coating is exceptionally promising, driven by an unyielding global demand for enhanced connectivity and data processing capabilities. Key growth accelerators, including breakthroughs in material science and strategic industry collaborations, are poised to propel the market to new heights. The increasing adoption of optical fibers in emerging applications beyond traditional telecommunications, such as in advanced sensing and quantum computing, will unlock significant untapped market potential. Strategic opportunities lie in developing highly customized solutions for specialized environments and in leading the charge towards sustainable material innovations, ensuring the industry's continued relevance and expansion in the decades to come.
Low Refractive Index Optical Fiber Primary Coating Segmentation
-
1. Application
- 1.1. Polyimide Fiber
- 1.2. Polyacrylate Fiber
- 1.3. Silicone Fiber
- 1.4. Others
-
2. Types
- 2.1. Refractive Index ≤ 1.36
- 2.2. 1.36 < Refractive Index ≤ 1.40
- 2.3. Others
Low Refractive Index Optical Fiber Primary Coating Segmentation By Geography
-
1. North America
- 1.1. United States
- 1.2. Canada
- 1.3. Mexico
-
2. South America
- 2.1. Brazil
- 2.2. Argentina
- 2.3. Rest of South America
-
3. Europe
- 3.1. United Kingdom
- 3.2. Germany
- 3.3. France
- 3.4. Italy
- 3.5. Spain
- 3.6. Russia
- 3.7. Benelux
- 3.8. Nordics
- 3.9. Rest of Europe
-
4. Middle East & Africa
- 4.1. Turkey
- 4.2. Israel
- 4.3. GCC
- 4.4. North Africa
- 4.5. South Africa
- 4.6. Rest of Middle East & Africa
-
5. Asia Pacific
- 5.1. China
- 5.2. India
- 5.3. Japan
- 5.4. South Korea
- 5.5. ASEAN
- 5.6. Oceania
- 5.7. Rest of Asia Pacific
Low Refractive Index Optical Fiber Primary Coating Regional Market Share
Geographic Coverage of Low Refractive Index Optical Fiber Primary Coating
Low Refractive Index Optical Fiber Primary Coating REPORT HIGHLIGHTS
| Aspects | Details |
|---|---|
| Study Period | 2020-2034 |
| Base Year | 2025 |
| Estimated Year | 2026 |
| Forecast Period | 2026-2034 |
| Historical Period | 2020-2025 |
| Growth Rate | CAGR of 9.3% from 2020-2034 |
| Segmentation |
|
Table of Contents
- 1. Introduction
- 1.1. Research Scope
- 1.2. Market Segmentation
- 1.3. Research Methodology
- 1.4. Definitions and Assumptions
- 2. Executive Summary
- 2.1. Introduction
- 3. Market Dynamics
- 3.1. Introduction
- 3.2. Market Drivers
- 3.3. Market Restrains
- 3.4. Market Trends
- 4. Market Factor Analysis
- 4.1. Porters Five Forces
- 4.2. Supply/Value Chain
- 4.3. PESTEL analysis
- 4.4. Market Entropy
- 4.5. Patent/Trademark Analysis
- 5. Global Low Refractive Index Optical Fiber Primary Coating Analysis, Insights and Forecast, 2020-2032
- 5.1. Market Analysis, Insights and Forecast - by Application
- 5.1.1. Polyimide Fiber
- 5.1.2. Polyacrylate Fiber
- 5.1.3. Silicone Fiber
- 5.1.4. Others
- 5.2. Market Analysis, Insights and Forecast - by Types
- 5.2.1. Refractive Index ≤ 1.36
- 5.2.2. 1.36 < Refractive Index ≤ 1.40
- 5.2.3. Others
- 5.3. Market Analysis, Insights and Forecast - by Region
- 5.3.1. North America
- 5.3.2. South America
- 5.3.3. Europe
- 5.3.4. Middle East & Africa
- 5.3.5. Asia Pacific
- 5.1. Market Analysis, Insights and Forecast - by Application
- 6. North America Low Refractive Index Optical Fiber Primary Coating Analysis, Insights and Forecast, 2020-2032
- 6.1. Market Analysis, Insights and Forecast - by Application
- 6.1.1. Polyimide Fiber
- 6.1.2. Polyacrylate Fiber
- 6.1.3. Silicone Fiber
- 6.1.4. Others
- 6.2. Market Analysis, Insights and Forecast - by Types
- 6.2.1. Refractive Index ≤ 1.36
- 6.2.2. 1.36 < Refractive Index ≤ 1.40
- 6.2.3. Others
- 6.1. Market Analysis, Insights and Forecast - by Application
- 7. South America Low Refractive Index Optical Fiber Primary Coating Analysis, Insights and Forecast, 2020-2032
- 7.1. Market Analysis, Insights and Forecast - by Application
- 7.1.1. Polyimide Fiber
- 7.1.2. Polyacrylate Fiber
- 7.1.3. Silicone Fiber
- 7.1.4. Others
- 7.2. Market Analysis, Insights and Forecast - by Types
- 7.2.1. Refractive Index ≤ 1.36
- 7.2.2. 1.36 < Refractive Index ≤ 1.40
- 7.2.3. Others
- 7.1. Market Analysis, Insights and Forecast - by Application
- 8. Europe Low Refractive Index Optical Fiber Primary Coating Analysis, Insights and Forecast, 2020-2032
- 8.1. Market Analysis, Insights and Forecast - by Application
- 8.1.1. Polyimide Fiber
- 8.1.2. Polyacrylate Fiber
- 8.1.3. Silicone Fiber
- 8.1.4. Others
- 8.2. Market Analysis, Insights and Forecast - by Types
- 8.2.1. Refractive Index ≤ 1.36
- 8.2.2. 1.36 < Refractive Index ≤ 1.40
- 8.2.3. Others
- 8.1. Market Analysis, Insights and Forecast - by Application
- 9. Middle East & Africa Low Refractive Index Optical Fiber Primary Coating Analysis, Insights and Forecast, 2020-2032
- 9.1. Market Analysis, Insights and Forecast - by Application
- 9.1.1. Polyimide Fiber
- 9.1.2. Polyacrylate Fiber
- 9.1.3. Silicone Fiber
- 9.1.4. Others
- 9.2. Market Analysis, Insights and Forecast - by Types
- 9.2.1. Refractive Index ≤ 1.36
- 9.2.2. 1.36 < Refractive Index ≤ 1.40
- 9.2.3. Others
- 9.1. Market Analysis, Insights and Forecast - by Application
- 10. Asia Pacific Low Refractive Index Optical Fiber Primary Coating Analysis, Insights and Forecast, 2020-2032
- 10.1. Market Analysis, Insights and Forecast - by Application
- 10.1.1. Polyimide Fiber
- 10.1.2. Polyacrylate Fiber
- 10.1.3. Silicone Fiber
- 10.1.4. Others
- 10.2. Market Analysis, Insights and Forecast - by Types
- 10.2.1. Refractive Index ≤ 1.36
- 10.2.2. 1.36 < Refractive Index ≤ 1.40
- 10.2.3. Others
- 10.1. Market Analysis, Insights and Forecast - by Application
- 11. Competitive Analysis
- 11.1. Global Market Share Analysis 2025
- 11.2. Company Profiles
- 11.2.1 Phichem Corporation
- 11.2.1.1. Overview
- 11.2.1.2. Products
- 11.2.1.3. SWOT Analysis
- 11.2.1.4. Recent Developments
- 11.2.1.5. Financials (Based on Availability)
- 11.2.2 Wuhan Yangtze Optical Electronic Co.
- 11.2.2.1. Overview
- 11.2.2.2. Products
- 11.2.2.3. SWOT Analysis
- 11.2.2.4. Recent Developments
- 11.2.2.5. Financials (Based on Availability)
- 11.2.3 Ltd.
- 11.2.3.1. Overview
- 11.2.3.2. Products
- 11.2.3.3. SWOT Analysis
- 11.2.3.4. Recent Developments
- 11.2.3.5. Financials (Based on Availability)
- 11.2.4 Covestro AG
- 11.2.4.1. Overview
- 11.2.4.2. Products
- 11.2.4.3. SWOT Analysis
- 11.2.4.4. Recent Developments
- 11.2.4.5. Financials (Based on Availability)
- 11.2.5 MY Polymers
- 11.2.5.1. Overview
- 11.2.5.2. Products
- 11.2.5.3. SWOT Analysis
- 11.2.5.4. Recent Developments
- 11.2.5.5. Financials (Based on Availability)
- 11.2.6 Luvantix ADM Co.
- 11.2.6.1. Overview
- 11.2.6.2. Products
- 11.2.6.3. SWOT Analysis
- 11.2.6.4. Recent Developments
- 11.2.6.5. Financials (Based on Availability)
- 11.2.7 Ltd.
- 11.2.7.1. Overview
- 11.2.7.2. Products
- 11.2.7.3. SWOT Analysis
- 11.2.7.4. Recent Developments
- 11.2.7.5. Financials (Based on Availability)
- 11.2.8 Yangtze Optical Fibre and Cable Joint Stock Limited Company
- 11.2.8.1. Overview
- 11.2.8.2. Products
- 11.2.8.3. SWOT Analysis
- 11.2.8.4. Recent Developments
- 11.2.8.5. Financials (Based on Availability)
- 11.2.1 Phichem Corporation
List of Figures
- Figure 1: Global Low Refractive Index Optical Fiber Primary Coating Revenue Breakdown (million, %) by Region 2025 & 2033
- Figure 2: North America Low Refractive Index Optical Fiber Primary Coating Revenue (million), by Application 2025 & 2033
- Figure 3: North America Low Refractive Index Optical Fiber Primary Coating Revenue Share (%), by Application 2025 & 2033
- Figure 4: North America Low Refractive Index Optical Fiber Primary Coating Revenue (million), by Types 2025 & 2033
- Figure 5: North America Low Refractive Index Optical Fiber Primary Coating Revenue Share (%), by Types 2025 & 2033
- Figure 6: North America Low Refractive Index Optical Fiber Primary Coating Revenue (million), by Country 2025 & 2033
- Figure 7: North America Low Refractive Index Optical Fiber Primary Coating Revenue Share (%), by Country 2025 & 2033
- Figure 8: South America Low Refractive Index Optical Fiber Primary Coating Revenue (million), by Application 2025 & 2033
- Figure 9: South America Low Refractive Index Optical Fiber Primary Coating Revenue Share (%), by Application 2025 & 2033
- Figure 10: South America Low Refractive Index Optical Fiber Primary Coating Revenue (million), by Types 2025 & 2033
- Figure 11: South America Low Refractive Index Optical Fiber Primary Coating Revenue Share (%), by Types 2025 & 2033
- Figure 12: South America Low Refractive Index Optical Fiber Primary Coating Revenue (million), by Country 2025 & 2033
- Figure 13: South America Low Refractive Index Optical Fiber Primary Coating Revenue Share (%), by Country 2025 & 2033
- Figure 14: Europe Low Refractive Index Optical Fiber Primary Coating Revenue (million), by Application 2025 & 2033
- Figure 15: Europe Low Refractive Index Optical Fiber Primary Coating Revenue Share (%), by Application 2025 & 2033
- Figure 16: Europe Low Refractive Index Optical Fiber Primary Coating Revenue (million), by Types 2025 & 2033
- Figure 17: Europe Low Refractive Index Optical Fiber Primary Coating Revenue Share (%), by Types 2025 & 2033
- Figure 18: Europe Low Refractive Index Optical Fiber Primary Coating Revenue (million), by Country 2025 & 2033
- Figure 19: Europe Low Refractive Index Optical Fiber Primary Coating Revenue Share (%), by Country 2025 & 2033
- Figure 20: Middle East & Africa Low Refractive Index Optical Fiber Primary Coating Revenue (million), by Application 2025 & 2033
- Figure 21: Middle East & Africa Low Refractive Index Optical Fiber Primary Coating Revenue Share (%), by Application 2025 & 2033
- Figure 22: Middle East & Africa Low Refractive Index Optical Fiber Primary Coating Revenue (million), by Types 2025 & 2033
- Figure 23: Middle East & Africa Low Refractive Index Optical Fiber Primary Coating Revenue Share (%), by Types 2025 & 2033
- Figure 24: Middle East & Africa Low Refractive Index Optical Fiber Primary Coating Revenue (million), by Country 2025 & 2033
- Figure 25: Middle East & Africa Low Refractive Index Optical Fiber Primary Coating Revenue Share (%), by Country 2025 & 2033
- Figure 26: Asia Pacific Low Refractive Index Optical Fiber Primary Coating Revenue (million), by Application 2025 & 2033
- Figure 27: Asia Pacific Low Refractive Index Optical Fiber Primary Coating Revenue Share (%), by Application 2025 & 2033
- Figure 28: Asia Pacific Low Refractive Index Optical Fiber Primary Coating Revenue (million), by Types 2025 & 2033
- Figure 29: Asia Pacific Low Refractive Index Optical Fiber Primary Coating Revenue Share (%), by Types 2025 & 2033
- Figure 30: Asia Pacific Low Refractive Index Optical Fiber Primary Coating Revenue (million), by Country 2025 & 2033
- Figure 31: Asia Pacific Low Refractive Index Optical Fiber Primary Coating Revenue Share (%), by Country 2025 & 2033
List of Tables
- Table 1: Global Low Refractive Index Optical Fiber Primary Coating Revenue million Forecast, by Application 2020 & 2033
- Table 2: Global Low Refractive Index Optical Fiber Primary Coating Revenue million Forecast, by Types 2020 & 2033
- Table 3: Global Low Refractive Index Optical Fiber Primary Coating Revenue million Forecast, by Region 2020 & 2033
- Table 4: Global Low Refractive Index Optical Fiber Primary Coating Revenue million Forecast, by Application 2020 & 2033
- Table 5: Global Low Refractive Index Optical Fiber Primary Coating Revenue million Forecast, by Types 2020 & 2033
- Table 6: Global Low Refractive Index Optical Fiber Primary Coating Revenue million Forecast, by Country 2020 & 2033
- Table 7: United States Low Refractive Index Optical Fiber Primary Coating Revenue (million) Forecast, by Application 2020 & 2033
- Table 8: Canada Low Refractive Index Optical Fiber Primary Coating Revenue (million) Forecast, by Application 2020 & 2033
- Table 9: Mexico Low Refractive Index Optical Fiber Primary Coating Revenue (million) Forecast, by Application 2020 & 2033
- Table 10: Global Low Refractive Index Optical Fiber Primary Coating Revenue million Forecast, by Application 2020 & 2033
- Table 11: Global Low Refractive Index Optical Fiber Primary Coating Revenue million Forecast, by Types 2020 & 2033
- Table 12: Global Low Refractive Index Optical Fiber Primary Coating Revenue million Forecast, by Country 2020 & 2033
- Table 13: Brazil Low Refractive Index Optical Fiber Primary Coating Revenue (million) Forecast, by Application 2020 & 2033
- Table 14: Argentina Low Refractive Index Optical Fiber Primary Coating Revenue (million) Forecast, by Application 2020 & 2033
- Table 15: Rest of South America Low Refractive Index Optical Fiber Primary Coating Revenue (million) Forecast, by Application 2020 & 2033
- Table 16: Global Low Refractive Index Optical Fiber Primary Coating Revenue million Forecast, by Application 2020 & 2033
- Table 17: Global Low Refractive Index Optical Fiber Primary Coating Revenue million Forecast, by Types 2020 & 2033
- Table 18: Global Low Refractive Index Optical Fiber Primary Coating Revenue million Forecast, by Country 2020 & 2033
- Table 19: United Kingdom Low Refractive Index Optical Fiber Primary Coating Revenue (million) Forecast, by Application 2020 & 2033
- Table 20: Germany Low Refractive Index Optical Fiber Primary Coating Revenue (million) Forecast, by Application 2020 & 2033
- Table 21: France Low Refractive Index Optical Fiber Primary Coating Revenue (million) Forecast, by Application 2020 & 2033
- Table 22: Italy Low Refractive Index Optical Fiber Primary Coating Revenue (million) Forecast, by Application 2020 & 2033
- Table 23: Spain Low Refractive Index Optical Fiber Primary Coating Revenue (million) Forecast, by Application 2020 & 2033
- Table 24: Russia Low Refractive Index Optical Fiber Primary Coating Revenue (million) Forecast, by Application 2020 & 2033
- Table 25: Benelux Low Refractive Index Optical Fiber Primary Coating Revenue (million) Forecast, by Application 2020 & 2033
- Table 26: Nordics Low Refractive Index Optical Fiber Primary Coating Revenue (million) Forecast, by Application 2020 & 2033
- Table 27: Rest of Europe Low Refractive Index Optical Fiber Primary Coating Revenue (million) Forecast, by Application 2020 & 2033
- Table 28: Global Low Refractive Index Optical Fiber Primary Coating Revenue million Forecast, by Application 2020 & 2033
- Table 29: Global Low Refractive Index Optical Fiber Primary Coating Revenue million Forecast, by Types 2020 & 2033
- Table 30: Global Low Refractive Index Optical Fiber Primary Coating Revenue million Forecast, by Country 2020 & 2033
- Table 31: Turkey Low Refractive Index Optical Fiber Primary Coating Revenue (million) Forecast, by Application 2020 & 2033
- Table 32: Israel Low Refractive Index Optical Fiber Primary Coating Revenue (million) Forecast, by Application 2020 & 2033
- Table 33: GCC Low Refractive Index Optical Fiber Primary Coating Revenue (million) Forecast, by Application 2020 & 2033
- Table 34: North Africa Low Refractive Index Optical Fiber Primary Coating Revenue (million) Forecast, by Application 2020 & 2033
- Table 35: South Africa Low Refractive Index Optical Fiber Primary Coating Revenue (million) Forecast, by Application 2020 & 2033
- Table 36: Rest of Middle East & Africa Low Refractive Index Optical Fiber Primary Coating Revenue (million) Forecast, by Application 2020 & 2033
- Table 37: Global Low Refractive Index Optical Fiber Primary Coating Revenue million Forecast, by Application 2020 & 2033
- Table 38: Global Low Refractive Index Optical Fiber Primary Coating Revenue million Forecast, by Types 2020 & 2033
- Table 39: Global Low Refractive Index Optical Fiber Primary Coating Revenue million Forecast, by Country 2020 & 2033
- Table 40: China Low Refractive Index Optical Fiber Primary Coating Revenue (million) Forecast, by Application 2020 & 2033
- Table 41: India Low Refractive Index Optical Fiber Primary Coating Revenue (million) Forecast, by Application 2020 & 2033
- Table 42: Japan Low Refractive Index Optical Fiber Primary Coating Revenue (million) Forecast, by Application 2020 & 2033
- Table 43: South Korea Low Refractive Index Optical Fiber Primary Coating Revenue (million) Forecast, by Application 2020 & 2033
- Table 44: ASEAN Low Refractive Index Optical Fiber Primary Coating Revenue (million) Forecast, by Application 2020 & 2033
- Table 45: Oceania Low Refractive Index Optical Fiber Primary Coating Revenue (million) Forecast, by Application 2020 & 2033
- Table 46: Rest of Asia Pacific Low Refractive Index Optical Fiber Primary Coating Revenue (million) Forecast, by Application 2020 & 2033
Frequently Asked Questions
1. What is the projected Compound Annual Growth Rate (CAGR) of the Low Refractive Index Optical Fiber Primary Coating?
The projected CAGR is approximately 9.3%.
2. Which companies are prominent players in the Low Refractive Index Optical Fiber Primary Coating?
Key companies in the market include Phichem Corporation, Wuhan Yangtze Optical Electronic Co., Ltd., Covestro AG, MY Polymers, Luvantix ADM Co., Ltd., Yangtze Optical Fibre and Cable Joint Stock Limited Company.
3. What are the main segments of the Low Refractive Index Optical Fiber Primary Coating?
The market segments include Application, Types.
4. Can you provide details about the market size?
The market size is estimated to be USD 106 million as of 2022.
5. What are some drivers contributing to market growth?
N/A
6. What are the notable trends driving market growth?
N/A
7. Are there any restraints impacting market growth?
N/A
8. Can you provide examples of recent developments in the market?
N/A
9. What pricing options are available for accessing the report?
Pricing options include single-user, multi-user, and enterprise licenses priced at USD 4900.00, USD 7350.00, and USD 9800.00 respectively.
10. Is the market size provided in terms of value or volume?
The market size is provided in terms of value, measured in million.
11. Are there any specific market keywords associated with the report?
Yes, the market keyword associated with the report is "Low Refractive Index Optical Fiber Primary Coating," which aids in identifying and referencing the specific market segment covered.
12. How do I determine which pricing option suits my needs best?
The pricing options vary based on user requirements and access needs. Individual users may opt for single-user licenses, while businesses requiring broader access may choose multi-user or enterprise licenses for cost-effective access to the report.
13. Are there any additional resources or data provided in the Low Refractive Index Optical Fiber Primary Coating report?
While the report offers comprehensive insights, it's advisable to review the specific contents or supplementary materials provided to ascertain if additional resources or data are available.
14. How can I stay updated on further developments or reports in the Low Refractive Index Optical Fiber Primary Coating?
To stay informed about further developments, trends, and reports in the Low Refractive Index Optical Fiber Primary Coating, consider subscribing to industry newsletters, following relevant companies and organizations, or regularly checking reputable industry news sources and publications.
Methodology
Step 1 - Identification of Relevant Samples Size from Population Database


Step 2 - Approaches for Defining Global Market Size (Value, Volume* & Price*)

Note*: In applicable scenarios
Step 3 - Data Sources
Primary Research
- Web Analytics
- Survey Reports
- Research Institute
- Latest Research Reports
- Opinion Leaders
Secondary Research
- Annual Reports
- White Paper
- Latest Press Release
- Industry Association
- Paid Database
- Investor Presentations

Step 4 - Data Triangulation
Involves using different sources of information in order to increase the validity of a study
These sources are likely to be stakeholders in a program - participants, other researchers, program staff, other community members, and so on.
Then we put all data in single framework & apply various statistical tools to find out the dynamic on the market.
During the analysis stage, feedback from the stakeholder groups would be compared to determine areas of agreement as well as areas of divergence