
Key Insights
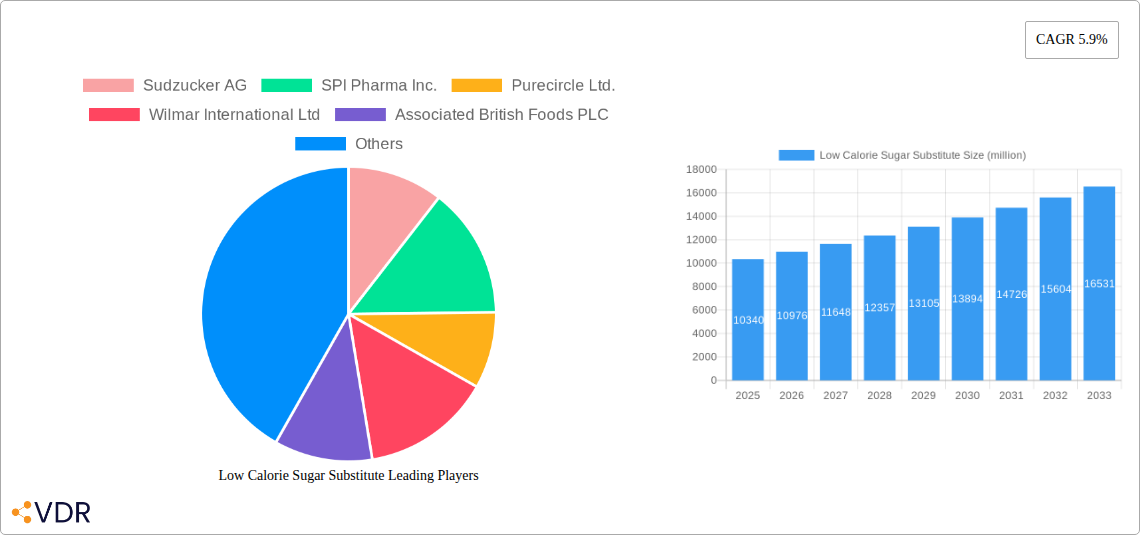
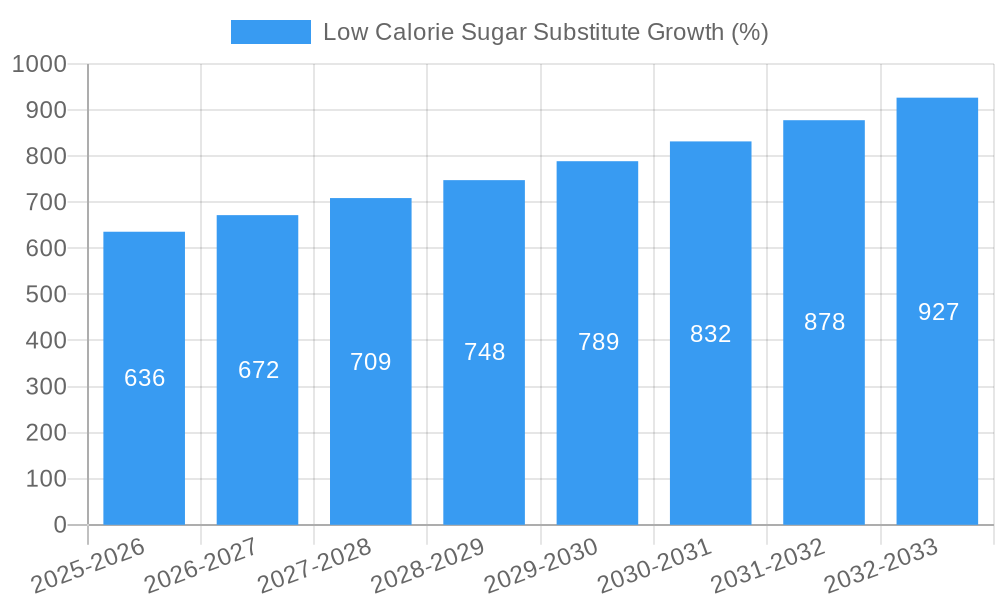
The global low-calorie sugar substitute market, valued at approximately $10.34 billion in 2025, is projected to experience robust growth, driven by increasing health consciousness and the rising prevalence of diabetes and obesity. The market's Compound Annual Growth Rate (CAGR) of 5.9% from 2019 to 2024 suggests a sustained demand for healthier alternatives to traditional sugar. This growth is fueled by several key factors, including the proliferation of diet-conscious consumers seeking to reduce their sugar intake, the increasing availability of low-calorie sweeteners in various food and beverage products, and the growing awareness of the negative health consequences associated with high sugar consumption. Furthermore, the innovative development of new sweeteners with improved taste profiles and reduced aftertaste is contributing to market expansion. Major players like Sudzucker AG, SPI Pharma Inc., and others are strategically investing in research and development, expanding their product portfolios, and focusing on strategic partnerships to cater to this burgeoning demand. The market is segmented by product type (e.g., stevia, aspartame, sucralose), application (food and beverages, pharmaceuticals), and region, offering diversified growth opportunities. The competitive landscape is characterized by both large multinational corporations and smaller specialized firms, leading to ongoing innovation and market consolidation.
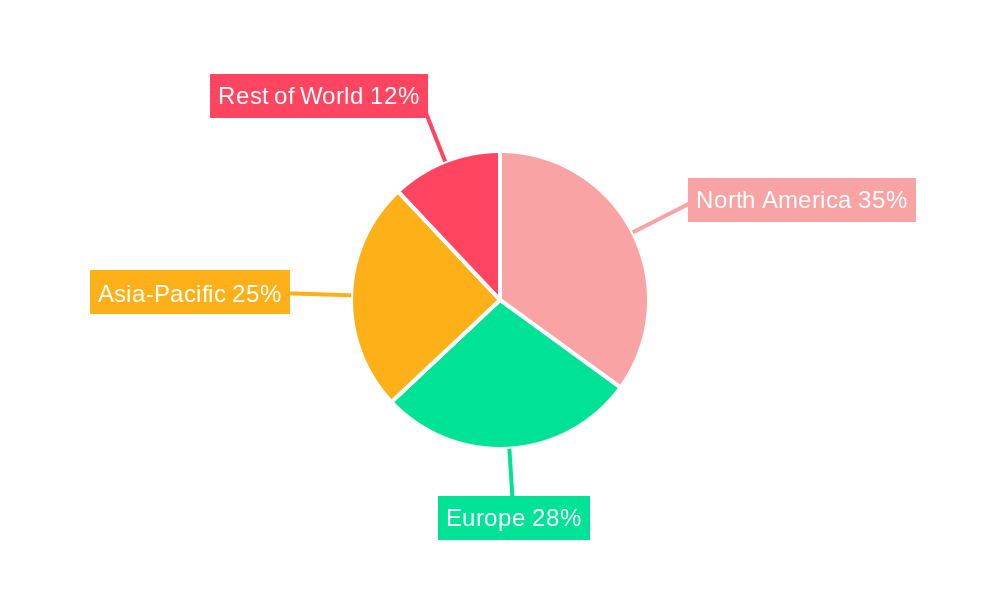
The forecast period from 2025 to 2033 anticipates a continuation of this positive trajectory, with the market likely exceeding $16 billion by 2033. However, challenges remain, including concerns about the potential long-term health effects of certain artificial sweeteners and fluctuating raw material prices. Nevertheless, the increasing consumer preference for healthier lifestyles and the ongoing efforts of manufacturers to develop and market improved low-calorie sugar substitutes are expected to outweigh these challenges, ensuring continued market expansion throughout the forecast period. Regional variations in consumer preferences and regulatory frameworks will also play a significant role in shaping future market dynamics, with North America and Europe anticipated to maintain substantial market shares.
Low Calorie Sugar Substitute Market Report: 2019-2033
This comprehensive report provides a detailed analysis of the low calorie sugar substitute market, encompassing market dynamics, growth trends, regional dominance, product landscape, challenges, opportunities, and key players. The study period covers 2019-2033, with a base year of 2025 and a forecast period of 2025-2033. The report is designed for industry professionals, investors, and strategic decision-makers seeking in-depth insights into this rapidly evolving market. This report analyzes both the parent market (sweeteners/sugar alternatives) and child market (low calorie sugar substitutes) for a more complete understanding. The global market is predicted to be worth xx million units by 2033.
Low Calorie Sugar Substitute Market Dynamics & Structure
This section analyzes the market's competitive landscape, technological advancements, regulatory environment, and market trends. We delve into the interplay of factors shaping market structure, including market concentration, mergers and acquisitions (M&A), and the impact of substitute products.
- Market Concentration: The market is characterized by a [Describe concentration level e.g., moderately concentrated] structure with the top five players holding an estimated [xx]% market share in 2024.
- Technological Innovation: Continuous innovation in sweetener technologies, including the development of [mention specific technologies e.g., novel stevia extracts and improved production methods], is driving market growth. However, [mention barriers e.g., high R&D costs and regulatory hurdles] pose significant challenges.
- Regulatory Frameworks: Government regulations concerning labeling, safety, and health claims significantly impact market dynamics. Variations in regulations across different regions create complexities for global players.
- Competitive Product Substitutes: The market faces competition from other low-calorie sweeteners such as [mention examples e.g., artificial sweeteners like aspartame and saccharin]. This competition necessitates continuous product innovation and differentiation.
- End-User Demographics: The increasing prevalence of [mention factors e.g., diabetes and obesity] coupled with rising health consciousness among consumers are key drivers of market expansion. The target demographic is shifting towards [mention e.g., health-conscious millennials and Gen Z].
- M&A Trends: The industry has witnessed [xx] M&A deals in the historical period (2019-2024), primarily focused on [mention motives e.g., expanding product portfolios and accessing new markets]. Future M&A activity is expected to remain [mention prediction e.g., robust], driven by [mention reasons e.g., the need for scale and technological capabilities].
Low Calorie Sugar Substitute Growth Trends & Insights
This section presents a comprehensive analysis of market size evolution, adoption rates, technological disruptions, and evolving consumer preferences. Utilizing [mention data source e.g., internal data, market research reports], we project significant growth in the low calorie sugar substitute market.
[Insert 600-word analysis focusing on market size (in million units) evolution (historical and projected), CAGR, market penetration rates across different segments, technological advancements impacting growth (e.g., improved taste and texture of substitutes), and shifting consumer preferences (e.g., demand for natural and organic options).]
Dominant Regions, Countries, or Segments in Low Calorie Sugar Substitute
This section pinpoints the leading regions and segments driving market growth. We analyze dominance factors such as market share, growth potential, and key regional drivers.
[Insert 600-word analysis identifying the leading region(s)/country(ies)/segment(s). Use bullet points to highlight key regional drivers (e.g., supportive government policies, strong consumer demand, economic growth). Discuss market share and growth potential in detail for the leading regions/countries/segments. ]
Low Calorie Sugar Substitute Product Landscape
This section details the range of products available in the market. We describe various product types, their applications, and key performance indicators (KPIs).
[Insert 100-150 word paragraph highlighting product innovations, applications (e.g., food & beverage, pharmaceuticals), and performance metrics (e.g., sweetness intensity, stability). Mention specific examples of products with unique selling propositions and technological advancements.]
Key Drivers, Barriers & Challenges in Low Calorie Sugar Substitute
This section explores the factors driving market expansion and the challenges hindering growth.
Key Drivers:
[Insert 150 words in paragraph or bullet points, highlighting key drivers such as increasing prevalence of obesity and diabetes, growing health consciousness, government regulations promoting healthier food options, and technological advancements improving the taste and functionality of low-calorie sweeteners.]
Key Challenges and Restraints:
[Insert 150 words in paragraph or lists, addressing supply chain issues (e.g., sourcing of raw materials), regulatory hurdles (e.g., approval processes), and competitive pressures (e.g., price wars, entry of new players). Quantify the impact of these challenges where possible (e.g., estimated percentage impact on production costs).]
Emerging Opportunities in Low Calorie Sugar Substitute
This section identifies untapped market segments and innovative applications driving future growth.
[Insert 150 words in paragraph or list format, focusing on emerging opportunities, such as untapped markets (e.g., developing economies), innovative applications (e.g., functional foods and beverages), and evolving consumer preferences (e.g., demand for plant-based and sustainable options).]
Growth Accelerators in the Low Calorie Sugar Substitute Industry
This section discusses the catalysts that will fuel long-term market expansion.
[Insert 150-word paragraph emphasizing technological breakthroughs (e.g., next-generation sweeteners), strategic partnerships (e.g., collaborations between sweetener manufacturers and food companies), and market expansion strategies (e.g., entry into new geographical regions).]
Key Players Shaping the Low Calorie Sugar Substitute Market
- Sudzucker AG
- SPI Pharma Inc.
- Purecircle Ltd.
- Wilmar International Ltd
- Associated British Foods PLC
- Nestlé S.A.
- Symrise AG
- Instantina Ges.m.b.H
- Ajinomoto Co.,Inc.
- Mitsui Sugars Co.,Ltd
Notable Milestones in Low Calorie Sugar Substitute Sector
[Insert bullet points detailing key milestones, including product launches, mergers and acquisitions, regulatory approvals, and technological advancements, with specific dates (year/month) and a brief description of their impact on market dynamics.]
In-Depth Low Calorie Sugar Substitute Market Outlook
[Insert 150-word paragraph summarizing the growth accelerators discussed earlier and highlighting the future market potential and strategic opportunities. Emphasize the long-term outlook and potential for innovation and expansion.]
Low Calorie Sugar Substitute Segmentation
-
1. Application
- 1.1. Drinks
- 1.2. Candy
- 1.3. Baked Goods
- 1.4. Others
-
2. Type
- 2.1. Natural
- 2.2. Artificial
Low Calorie Sugar Substitute Segmentation By Geography
-
1. North America
- 1.1. United States
- 1.2. Canada
- 1.3. Mexico
-
2. South America
- 2.1. Brazil
- 2.2. Argentina
- 2.3. Rest of South America
-
3. Europe
- 3.1. United Kingdom
- 3.2. Germany
- 3.3. France
- 3.4. Italy
- 3.5. Spain
- 3.6. Russia
- 3.7. Benelux
- 3.8. Nordics
- 3.9. Rest of Europe
-
4. Middle East & Africa
- 4.1. Turkey
- 4.2. Israel
- 4.3. GCC
- 4.4. North Africa
- 4.5. South Africa
- 4.6. Rest of Middle East & Africa
-
5. Asia Pacific
- 5.1. China
- 5.2. India
- 5.3. Japan
- 5.4. South Korea
- 5.5. ASEAN
- 5.6. Oceania
- 5.7. Rest of Asia Pacific
Low Calorie Sugar Substitute REPORT HIGHLIGHTS
| Aspects | Details |
|---|---|
| Study Period | 2019-2033 |
| Base Year | 2024 |
| Estimated Year | 2025 |
| Forecast Period | 2025-2033 |
| Historical Period | 2019-2024 |
| Growth Rate | CAGR of 5.9% from 2019-2033 |
| Segmentation |
|
Table of Contents
- 1. Introduction
- 1.1. Research Scope
- 1.2. Market Segmentation
- 1.3. Research Methodology
- 1.4. Definitions and Assumptions
- 2. Executive Summary
- 2.1. Introduction
- 3. Market Dynamics
- 3.1. Introduction
- 3.2. Market Drivers
- 3.3. Market Restrains
- 3.4. Market Trends
- 4. Market Factor Analysis
- 4.1. Porters Five Forces
- 4.2. Supply/Value Chain
- 4.3. PESTEL analysis
- 4.4. Market Entropy
- 4.5. Patent/Trademark Analysis
- 5. Global Low Calorie Sugar Substitute Analysis, Insights and Forecast, 2019-2031
- 5.1. Market Analysis, Insights and Forecast - by Application
- 5.1.1. Drinks
- 5.1.2. Candy
- 5.1.3. Baked Goods
- 5.1.4. Others
- 5.2. Market Analysis, Insights and Forecast - by Type
- 5.2.1. Natural
- 5.2.2. Artificial
- 5.3. Market Analysis, Insights and Forecast - by Region
- 5.3.1. North America
- 5.3.2. South America
- 5.3.3. Europe
- 5.3.4. Middle East & Africa
- 5.3.5. Asia Pacific
- 5.1. Market Analysis, Insights and Forecast - by Application
- 6. North America Low Calorie Sugar Substitute Analysis, Insights and Forecast, 2019-2031
- 6.1. Market Analysis, Insights and Forecast - by Application
- 6.1.1. Drinks
- 6.1.2. Candy
- 6.1.3. Baked Goods
- 6.1.4. Others
- 6.2. Market Analysis, Insights and Forecast - by Type
- 6.2.1. Natural
- 6.2.2. Artificial
- 6.1. Market Analysis, Insights and Forecast - by Application
- 7. South America Low Calorie Sugar Substitute Analysis, Insights and Forecast, 2019-2031
- 7.1. Market Analysis, Insights and Forecast - by Application
- 7.1.1. Drinks
- 7.1.2. Candy
- 7.1.3. Baked Goods
- 7.1.4. Others
- 7.2. Market Analysis, Insights and Forecast - by Type
- 7.2.1. Natural
- 7.2.2. Artificial
- 7.1. Market Analysis, Insights and Forecast - by Application
- 8. Europe Low Calorie Sugar Substitute Analysis, Insights and Forecast, 2019-2031
- 8.1. Market Analysis, Insights and Forecast - by Application
- 8.1.1. Drinks
- 8.1.2. Candy
- 8.1.3. Baked Goods
- 8.1.4. Others
- 8.2. Market Analysis, Insights and Forecast - by Type
- 8.2.1. Natural
- 8.2.2. Artificial
- 8.1. Market Analysis, Insights and Forecast - by Application
- 9. Middle East & Africa Low Calorie Sugar Substitute Analysis, Insights and Forecast, 2019-2031
- 9.1. Market Analysis, Insights and Forecast - by Application
- 9.1.1. Drinks
- 9.1.2. Candy
- 9.1.3. Baked Goods
- 9.1.4. Others
- 9.2. Market Analysis, Insights and Forecast - by Type
- 9.2.1. Natural
- 9.2.2. Artificial
- 9.1. Market Analysis, Insights and Forecast - by Application
- 10. Asia Pacific Low Calorie Sugar Substitute Analysis, Insights and Forecast, 2019-2031
- 10.1. Market Analysis, Insights and Forecast - by Application
- 10.1.1. Drinks
- 10.1.2. Candy
- 10.1.3. Baked Goods
- 10.1.4. Others
- 10.2. Market Analysis, Insights and Forecast - by Type
- 10.2.1. Natural
- 10.2.2. Artificial
- 10.1. Market Analysis, Insights and Forecast - by Application
- 11. Competitive Analysis
- 11.1. Global Market Share Analysis 2024
- 11.2. Company Profiles
- 11.2.1 Sudzucker AG
- 11.2.1.1. Overview
- 11.2.1.2. Products
- 11.2.1.3. SWOT Analysis
- 11.2.1.4. Recent Developments
- 11.2.1.5. Financials (Based on Availability)
- 11.2.2 SPI Pharma Inc.
- 11.2.2.1. Overview
- 11.2.2.2. Products
- 11.2.2.3. SWOT Analysis
- 11.2.2.4. Recent Developments
- 11.2.2.5. Financials (Based on Availability)
- 11.2.3 Purecircle Ltd.
- 11.2.3.1. Overview
- 11.2.3.2. Products
- 11.2.3.3. SWOT Analysis
- 11.2.3.4. Recent Developments
- 11.2.3.5. Financials (Based on Availability)
- 11.2.4 Wilmar International Ltd
- 11.2.4.1. Overview
- 11.2.4.2. Products
- 11.2.4.3. SWOT Analysis
- 11.2.4.4. Recent Developments
- 11.2.4.5. Financials (Based on Availability)
- 11.2.5 Associated British Foods PLC
- 11.2.5.1. Overview
- 11.2.5.2. Products
- 11.2.5.3. SWOT Analysis
- 11.2.5.4. Recent Developments
- 11.2.5.5. Financials (Based on Availability)
- 11.2.6 Nestl S.A.
- 11.2.6.1. Overview
- 11.2.6.2. Products
- 11.2.6.3. SWOT Analysis
- 11.2.6.4. Recent Developments
- 11.2.6.5. Financials (Based on Availability)
- 11.2.7 Symrise AG
- 11.2.7.1. Overview
- 11.2.7.2. Products
- 11.2.7.3. SWOT Analysis
- 11.2.7.4. Recent Developments
- 11.2.7.5. Financials (Based on Availability)
- 11.2.8 Instantina Ges.m.b.H
- 11.2.8.1. Overview
- 11.2.8.2. Products
- 11.2.8.3. SWOT Analysis
- 11.2.8.4. Recent Developments
- 11.2.8.5. Financials (Based on Availability)
- 11.2.9 Ajinomoto Co.
- 11.2.9.1. Overview
- 11.2.9.2. Products
- 11.2.9.3. SWOT Analysis
- 11.2.9.4. Recent Developments
- 11.2.9.5. Financials (Based on Availability)
- 11.2.10 Inc.
- 11.2.10.1. Overview
- 11.2.10.2. Products
- 11.2.10.3. SWOT Analysis
- 11.2.10.4. Recent Developments
- 11.2.10.5. Financials (Based on Availability)
- 11.2.11 Mitsui Sugars Co.
- 11.2.11.1. Overview
- 11.2.11.2. Products
- 11.2.11.3. SWOT Analysis
- 11.2.11.4. Recent Developments
- 11.2.11.5. Financials (Based on Availability)
- 11.2.12 Ltd
- 11.2.12.1. Overview
- 11.2.12.2. Products
- 11.2.12.3. SWOT Analysis
- 11.2.12.4. Recent Developments
- 11.2.12.5. Financials (Based on Availability)
- 11.2.1 Sudzucker AG
List of Figures
- Figure 1: Global Low Calorie Sugar Substitute Revenue Breakdown (million, %) by Region 2024 & 2032
- Figure 2: Global Low Calorie Sugar Substitute Volume Breakdown (K, %) by Region 2024 & 2032
- Figure 3: North America Low Calorie Sugar Substitute Revenue (million), by Application 2024 & 2032
- Figure 4: North America Low Calorie Sugar Substitute Volume (K), by Application 2024 & 2032
- Figure 5: North America Low Calorie Sugar Substitute Revenue Share (%), by Application 2024 & 2032
- Figure 6: North America Low Calorie Sugar Substitute Volume Share (%), by Application 2024 & 2032
- Figure 7: North America Low Calorie Sugar Substitute Revenue (million), by Type 2024 & 2032
- Figure 8: North America Low Calorie Sugar Substitute Volume (K), by Type 2024 & 2032
- Figure 9: North America Low Calorie Sugar Substitute Revenue Share (%), by Type 2024 & 2032
- Figure 10: North America Low Calorie Sugar Substitute Volume Share (%), by Type 2024 & 2032
- Figure 11: North America Low Calorie Sugar Substitute Revenue (million), by Country 2024 & 2032
- Figure 12: North America Low Calorie Sugar Substitute Volume (K), by Country 2024 & 2032
- Figure 13: North America Low Calorie Sugar Substitute Revenue Share (%), by Country 2024 & 2032
- Figure 14: North America Low Calorie Sugar Substitute Volume Share (%), by Country 2024 & 2032
- Figure 15: South America Low Calorie Sugar Substitute Revenue (million), by Application 2024 & 2032
- Figure 16: South America Low Calorie Sugar Substitute Volume (K), by Application 2024 & 2032
- Figure 17: South America Low Calorie Sugar Substitute Revenue Share (%), by Application 2024 & 2032
- Figure 18: South America Low Calorie Sugar Substitute Volume Share (%), by Application 2024 & 2032
- Figure 19: South America Low Calorie Sugar Substitute Revenue (million), by Type 2024 & 2032
- Figure 20: South America Low Calorie Sugar Substitute Volume (K), by Type 2024 & 2032
- Figure 21: South America Low Calorie Sugar Substitute Revenue Share (%), by Type 2024 & 2032
- Figure 22: South America Low Calorie Sugar Substitute Volume Share (%), by Type 2024 & 2032
- Figure 23: South America Low Calorie Sugar Substitute Revenue (million), by Country 2024 & 2032
- Figure 24: South America Low Calorie Sugar Substitute Volume (K), by Country 2024 & 2032
- Figure 25: South America Low Calorie Sugar Substitute Revenue Share (%), by Country 2024 & 2032
- Figure 26: South America Low Calorie Sugar Substitute Volume Share (%), by Country 2024 & 2032
- Figure 27: Europe Low Calorie Sugar Substitute Revenue (million), by Application 2024 & 2032
- Figure 28: Europe Low Calorie Sugar Substitute Volume (K), by Application 2024 & 2032
- Figure 29: Europe Low Calorie Sugar Substitute Revenue Share (%), by Application 2024 & 2032
- Figure 30: Europe Low Calorie Sugar Substitute Volume Share (%), by Application 2024 & 2032
- Figure 31: Europe Low Calorie Sugar Substitute Revenue (million), by Type 2024 & 2032
- Figure 32: Europe Low Calorie Sugar Substitute Volume (K), by Type 2024 & 2032
- Figure 33: Europe Low Calorie Sugar Substitute Revenue Share (%), by Type 2024 & 2032
- Figure 34: Europe Low Calorie Sugar Substitute Volume Share (%), by Type 2024 & 2032
- Figure 35: Europe Low Calorie Sugar Substitute Revenue (million), by Country 2024 & 2032
- Figure 36: Europe Low Calorie Sugar Substitute Volume (K), by Country 2024 & 2032
- Figure 37: Europe Low Calorie Sugar Substitute Revenue Share (%), by Country 2024 & 2032
- Figure 38: Europe Low Calorie Sugar Substitute Volume Share (%), by Country 2024 & 2032
- Figure 39: Middle East & Africa Low Calorie Sugar Substitute Revenue (million), by Application 2024 & 2032
- Figure 40: Middle East & Africa Low Calorie Sugar Substitute Volume (K), by Application 2024 & 2032
- Figure 41: Middle East & Africa Low Calorie Sugar Substitute Revenue Share (%), by Application 2024 & 2032
- Figure 42: Middle East & Africa Low Calorie Sugar Substitute Volume Share (%), by Application 2024 & 2032
- Figure 43: Middle East & Africa Low Calorie Sugar Substitute Revenue (million), by Type 2024 & 2032
- Figure 44: Middle East & Africa Low Calorie Sugar Substitute Volume (K), by Type 2024 & 2032
- Figure 45: Middle East & Africa Low Calorie Sugar Substitute Revenue Share (%), by Type 2024 & 2032
- Figure 46: Middle East & Africa Low Calorie Sugar Substitute Volume Share (%), by Type 2024 & 2032
- Figure 47: Middle East & Africa Low Calorie Sugar Substitute Revenue (million), by Country 2024 & 2032
- Figure 48: Middle East & Africa Low Calorie Sugar Substitute Volume (K), by Country 2024 & 2032
- Figure 49: Middle East & Africa Low Calorie Sugar Substitute Revenue Share (%), by Country 2024 & 2032
- Figure 50: Middle East & Africa Low Calorie Sugar Substitute Volume Share (%), by Country 2024 & 2032
- Figure 51: Asia Pacific Low Calorie Sugar Substitute Revenue (million), by Application 2024 & 2032
- Figure 52: Asia Pacific Low Calorie Sugar Substitute Volume (K), by Application 2024 & 2032
- Figure 53: Asia Pacific Low Calorie Sugar Substitute Revenue Share (%), by Application 2024 & 2032
- Figure 54: Asia Pacific Low Calorie Sugar Substitute Volume Share (%), by Application 2024 & 2032
- Figure 55: Asia Pacific Low Calorie Sugar Substitute Revenue (million), by Type 2024 & 2032
- Figure 56: Asia Pacific Low Calorie Sugar Substitute Volume (K), by Type 2024 & 2032
- Figure 57: Asia Pacific Low Calorie Sugar Substitute Revenue Share (%), by Type 2024 & 2032
- Figure 58: Asia Pacific Low Calorie Sugar Substitute Volume Share (%), by Type 2024 & 2032
- Figure 59: Asia Pacific Low Calorie Sugar Substitute Revenue (million), by Country 2024 & 2032
- Figure 60: Asia Pacific Low Calorie Sugar Substitute Volume (K), by Country 2024 & 2032
- Figure 61: Asia Pacific Low Calorie Sugar Substitute Revenue Share (%), by Country 2024 & 2032
- Figure 62: Asia Pacific Low Calorie Sugar Substitute Volume Share (%), by Country 2024 & 2032
List of Tables
- Table 1: Global Low Calorie Sugar Substitute Revenue million Forecast, by Region 2019 & 2032
- Table 2: Global Low Calorie Sugar Substitute Volume K Forecast, by Region 2019 & 2032
- Table 3: Global Low Calorie Sugar Substitute Revenue million Forecast, by Application 2019 & 2032
- Table 4: Global Low Calorie Sugar Substitute Volume K Forecast, by Application 2019 & 2032
- Table 5: Global Low Calorie Sugar Substitute Revenue million Forecast, by Type 2019 & 2032
- Table 6: Global Low Calorie Sugar Substitute Volume K Forecast, by Type 2019 & 2032
- Table 7: Global Low Calorie Sugar Substitute Revenue million Forecast, by Region 2019 & 2032
- Table 8: Global Low Calorie Sugar Substitute Volume K Forecast, by Region 2019 & 2032
- Table 9: Global Low Calorie Sugar Substitute Revenue million Forecast, by Application 2019 & 2032
- Table 10: Global Low Calorie Sugar Substitute Volume K Forecast, by Application 2019 & 2032
- Table 11: Global Low Calorie Sugar Substitute Revenue million Forecast, by Type 2019 & 2032
- Table 12: Global Low Calorie Sugar Substitute Volume K Forecast, by Type 2019 & 2032
- Table 13: Global Low Calorie Sugar Substitute Revenue million Forecast, by Country 2019 & 2032
- Table 14: Global Low Calorie Sugar Substitute Volume K Forecast, by Country 2019 & 2032
- Table 15: United States Low Calorie Sugar Substitute Revenue (million) Forecast, by Application 2019 & 2032
- Table 16: United States Low Calorie Sugar Substitute Volume (K) Forecast, by Application 2019 & 2032
- Table 17: Canada Low Calorie Sugar Substitute Revenue (million) Forecast, by Application 2019 & 2032
- Table 18: Canada Low Calorie Sugar Substitute Volume (K) Forecast, by Application 2019 & 2032
- Table 19: Mexico Low Calorie Sugar Substitute Revenue (million) Forecast, by Application 2019 & 2032
- Table 20: Mexico Low Calorie Sugar Substitute Volume (K) Forecast, by Application 2019 & 2032
- Table 21: Global Low Calorie Sugar Substitute Revenue million Forecast, by Application 2019 & 2032
- Table 22: Global Low Calorie Sugar Substitute Volume K Forecast, by Application 2019 & 2032
- Table 23: Global Low Calorie Sugar Substitute Revenue million Forecast, by Type 2019 & 2032
- Table 24: Global Low Calorie Sugar Substitute Volume K Forecast, by Type 2019 & 2032
- Table 25: Global Low Calorie Sugar Substitute Revenue million Forecast, by Country 2019 & 2032
- Table 26: Global Low Calorie Sugar Substitute Volume K Forecast, by Country 2019 & 2032
- Table 27: Brazil Low Calorie Sugar Substitute Revenue (million) Forecast, by Application 2019 & 2032
- Table 28: Brazil Low Calorie Sugar Substitute Volume (K) Forecast, by Application 2019 & 2032
- Table 29: Argentina Low Calorie Sugar Substitute Revenue (million) Forecast, by Application 2019 & 2032
- Table 30: Argentina Low Calorie Sugar Substitute Volume (K) Forecast, by Application 2019 & 2032
- Table 31: Rest of South America Low Calorie Sugar Substitute Revenue (million) Forecast, by Application 2019 & 2032
- Table 32: Rest of South America Low Calorie Sugar Substitute Volume (K) Forecast, by Application 2019 & 2032
- Table 33: Global Low Calorie Sugar Substitute Revenue million Forecast, by Application 2019 & 2032
- Table 34: Global Low Calorie Sugar Substitute Volume K Forecast, by Application 2019 & 2032
- Table 35: Global Low Calorie Sugar Substitute Revenue million Forecast, by Type 2019 & 2032
- Table 36: Global Low Calorie Sugar Substitute Volume K Forecast, by Type 2019 & 2032
- Table 37: Global Low Calorie Sugar Substitute Revenue million Forecast, by Country 2019 & 2032
- Table 38: Global Low Calorie Sugar Substitute Volume K Forecast, by Country 2019 & 2032
- Table 39: United Kingdom Low Calorie Sugar Substitute Revenue (million) Forecast, by Application 2019 & 2032
- Table 40: United Kingdom Low Calorie Sugar Substitute Volume (K) Forecast, by Application 2019 & 2032
- Table 41: Germany Low Calorie Sugar Substitute Revenue (million) Forecast, by Application 2019 & 2032
- Table 42: Germany Low Calorie Sugar Substitute Volume (K) Forecast, by Application 2019 & 2032
- Table 43: France Low Calorie Sugar Substitute Revenue (million) Forecast, by Application 2019 & 2032
- Table 44: France Low Calorie Sugar Substitute Volume (K) Forecast, by Application 2019 & 2032
- Table 45: Italy Low Calorie Sugar Substitute Revenue (million) Forecast, by Application 2019 & 2032
- Table 46: Italy Low Calorie Sugar Substitute Volume (K) Forecast, by Application 2019 & 2032
- Table 47: Spain Low Calorie Sugar Substitute Revenue (million) Forecast, by Application 2019 & 2032
- Table 48: Spain Low Calorie Sugar Substitute Volume (K) Forecast, by Application 2019 & 2032
- Table 49: Russia Low Calorie Sugar Substitute Revenue (million) Forecast, by Application 2019 & 2032
- Table 50: Russia Low Calorie Sugar Substitute Volume (K) Forecast, by Application 2019 & 2032
- Table 51: Benelux Low Calorie Sugar Substitute Revenue (million) Forecast, by Application 2019 & 2032
- Table 52: Benelux Low Calorie Sugar Substitute Volume (K) Forecast, by Application 2019 & 2032
- Table 53: Nordics Low Calorie Sugar Substitute Revenue (million) Forecast, by Application 2019 & 2032
- Table 54: Nordics Low Calorie Sugar Substitute Volume (K) Forecast, by Application 2019 & 2032
- Table 55: Rest of Europe Low Calorie Sugar Substitute Revenue (million) Forecast, by Application 2019 & 2032
- Table 56: Rest of Europe Low Calorie Sugar Substitute Volume (K) Forecast, by Application 2019 & 2032
- Table 57: Global Low Calorie Sugar Substitute Revenue million Forecast, by Application 2019 & 2032
- Table 58: Global Low Calorie Sugar Substitute Volume K Forecast, by Application 2019 & 2032
- Table 59: Global Low Calorie Sugar Substitute Revenue million Forecast, by Type 2019 & 2032
- Table 60: Global Low Calorie Sugar Substitute Volume K Forecast, by Type 2019 & 2032
- Table 61: Global Low Calorie Sugar Substitute Revenue million Forecast, by Country 2019 & 2032
- Table 62: Global Low Calorie Sugar Substitute Volume K Forecast, by Country 2019 & 2032
- Table 63: Turkey Low Calorie Sugar Substitute Revenue (million) Forecast, by Application 2019 & 2032
- Table 64: Turkey Low Calorie Sugar Substitute Volume (K) Forecast, by Application 2019 & 2032
- Table 65: Israel Low Calorie Sugar Substitute Revenue (million) Forecast, by Application 2019 & 2032
- Table 66: Israel Low Calorie Sugar Substitute Volume (K) Forecast, by Application 2019 & 2032
- Table 67: GCC Low Calorie Sugar Substitute Revenue (million) Forecast, by Application 2019 & 2032
- Table 68: GCC Low Calorie Sugar Substitute Volume (K) Forecast, by Application 2019 & 2032
- Table 69: North Africa Low Calorie Sugar Substitute Revenue (million) Forecast, by Application 2019 & 2032
- Table 70: North Africa Low Calorie Sugar Substitute Volume (K) Forecast, by Application 2019 & 2032
- Table 71: South Africa Low Calorie Sugar Substitute Revenue (million) Forecast, by Application 2019 & 2032
- Table 72: South Africa Low Calorie Sugar Substitute Volume (K) Forecast, by Application 2019 & 2032
- Table 73: Rest of Middle East & Africa Low Calorie Sugar Substitute Revenue (million) Forecast, by Application 2019 & 2032
- Table 74: Rest of Middle East & Africa Low Calorie Sugar Substitute Volume (K) Forecast, by Application 2019 & 2032
- Table 75: Global Low Calorie Sugar Substitute Revenue million Forecast, by Application 2019 & 2032
- Table 76: Global Low Calorie Sugar Substitute Volume K Forecast, by Application 2019 & 2032
- Table 77: Global Low Calorie Sugar Substitute Revenue million Forecast, by Type 2019 & 2032
- Table 78: Global Low Calorie Sugar Substitute Volume K Forecast, by Type 2019 & 2032
- Table 79: Global Low Calorie Sugar Substitute Revenue million Forecast, by Country 2019 & 2032
- Table 80: Global Low Calorie Sugar Substitute Volume K Forecast, by Country 2019 & 2032
- Table 81: China Low Calorie Sugar Substitute Revenue (million) Forecast, by Application 2019 & 2032
- Table 82: China Low Calorie Sugar Substitute Volume (K) Forecast, by Application 2019 & 2032
- Table 83: India Low Calorie Sugar Substitute Revenue (million) Forecast, by Application 2019 & 2032
- Table 84: India Low Calorie Sugar Substitute Volume (K) Forecast, by Application 2019 & 2032
- Table 85: Japan Low Calorie Sugar Substitute Revenue (million) Forecast, by Application 2019 & 2032
- Table 86: Japan Low Calorie Sugar Substitute Volume (K) Forecast, by Application 2019 & 2032
- Table 87: South Korea Low Calorie Sugar Substitute Revenue (million) Forecast, by Application 2019 & 2032
- Table 88: South Korea Low Calorie Sugar Substitute Volume (K) Forecast, by Application 2019 & 2032
- Table 89: ASEAN Low Calorie Sugar Substitute Revenue (million) Forecast, by Application 2019 & 2032
- Table 90: ASEAN Low Calorie Sugar Substitute Volume (K) Forecast, by Application 2019 & 2032
- Table 91: Oceania Low Calorie Sugar Substitute Revenue (million) Forecast, by Application 2019 & 2032
- Table 92: Oceania Low Calorie Sugar Substitute Volume (K) Forecast, by Application 2019 & 2032
- Table 93: Rest of Asia Pacific Low Calorie Sugar Substitute Revenue (million) Forecast, by Application 2019 & 2032
- Table 94: Rest of Asia Pacific Low Calorie Sugar Substitute Volume (K) Forecast, by Application 2019 & 2032
Frequently Asked Questions
1. What is the projected Compound Annual Growth Rate (CAGR) of the Low Calorie Sugar Substitute?
The projected CAGR is approximately 5.9%.
2. Which companies are prominent players in the Low Calorie Sugar Substitute?
Key companies in the market include Sudzucker AG, SPI Pharma Inc., Purecircle Ltd., Wilmar International Ltd, Associated British Foods PLC, Nestl S.A., Symrise AG, Instantina Ges.m.b.H, Ajinomoto Co., Inc., Mitsui Sugars Co., Ltd.
3. What are the main segments of the Low Calorie Sugar Substitute?
The market segments include Application, Type.
4. Can you provide details about the market size?
The market size is estimated to be USD 10340 million as of 2022.
5. What are some drivers contributing to market growth?
N/A
6. What are the notable trends driving market growth?
N/A
7. Are there any restraints impacting market growth?
N/A
8. Can you provide examples of recent developments in the market?
N/A
9. What pricing options are available for accessing the report?
Pricing options include single-user, multi-user, and enterprise licenses priced at USD 3950.00, USD 5925.00, and USD 7900.00 respectively.
10. Is the market size provided in terms of value or volume?
The market size is provided in terms of value, measured in million and volume, measured in K.
11. Are there any specific market keywords associated with the report?
Yes, the market keyword associated with the report is "Low Calorie Sugar Substitute," which aids in identifying and referencing the specific market segment covered.
12. How do I determine which pricing option suits my needs best?
The pricing options vary based on user requirements and access needs. Individual users may opt for single-user licenses, while businesses requiring broader access may choose multi-user or enterprise licenses for cost-effective access to the report.
13. Are there any additional resources or data provided in the Low Calorie Sugar Substitute report?
While the report offers comprehensive insights, it's advisable to review the specific contents or supplementary materials provided to ascertain if additional resources or data are available.
14. How can I stay updated on further developments or reports in the Low Calorie Sugar Substitute?
To stay informed about further developments, trends, and reports in the Low Calorie Sugar Substitute, consider subscribing to industry newsletters, following relevant companies and organizations, or regularly checking reputable industry news sources and publications.
Methodology
Step 1 - Identification of Relevant Samples Size from Population Database


Step 2 - Approaches for Defining Global Market Size (Value, Volume* & Price*)

Note*: In applicable scenarios
Step 3 - Data Sources
Primary Research
- Web Analytics
- Survey Reports
- Research Institute
- Latest Research Reports
- Opinion Leaders
Secondary Research
- Annual Reports
- White Paper
- Latest Press Release
- Industry Association
- Paid Database
- Investor Presentations

Step 4 - Data Triangulation
Involves using different sources of information in order to increase the validity of a study
These sources are likely to be stakeholders in a program - participants, other researchers, program staff, other community members, and so on.
Then we put all data in single framework & apply various statistical tools to find out the dynamic on the market.
During the analysis stage, feedback from the stakeholder groups would be compared to determine areas of agreement as well as areas of divergence


