

Key Insights
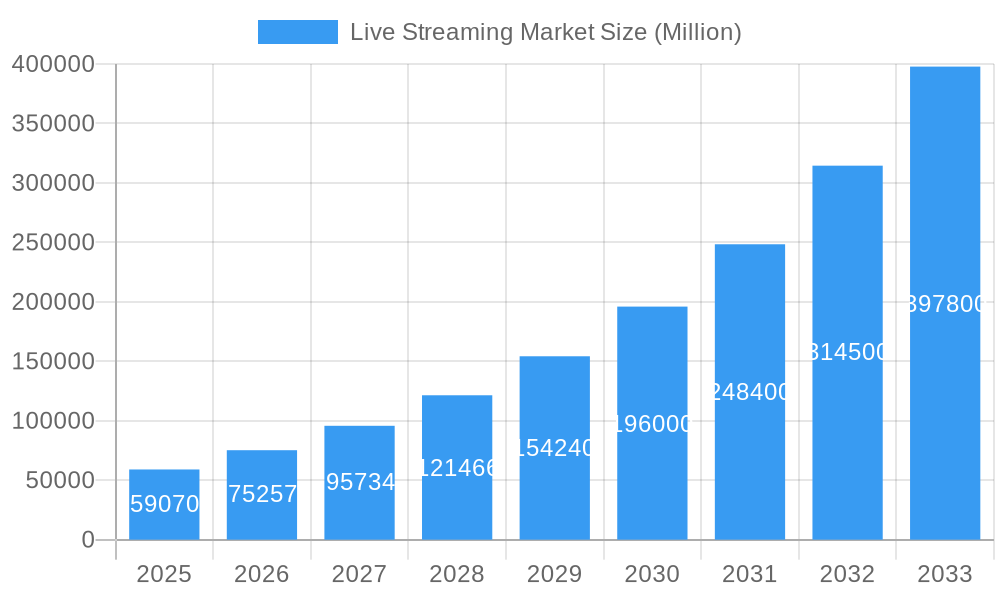
The live streaming market is experiencing explosive growth, projected to reach \$59.07 billion in 2025 and maintain a robust Compound Annual Growth Rate (CAGR) of 27.45% from 2025 to 2033. This expansion is fueled by several key drivers. The increasing adoption of high-speed internet and mobile devices provides ubiquitous access, enabling wider viewership and participation. Furthermore, the rise of social media platforms actively integrating live streaming functionalities has significantly broadened its reach, converting casual users into active participants and viewers. The growing popularity of e-sports, online gaming tournaments, and virtual concerts further fuels market expansion, creating new revenue streams and attracting diverse demographics. Finally, advancements in streaming technology, offering higher resolutions, improved interactivity, and enhanced accessibility, are key catalysts for market growth. Competition is fierce among established players like Twitch, YouTube, and Facebook, alongside emerging platforms vying for market share. This competitive landscape encourages innovation in features, user experience, and monetization strategies, benefiting consumers and driving continuous market evolution.
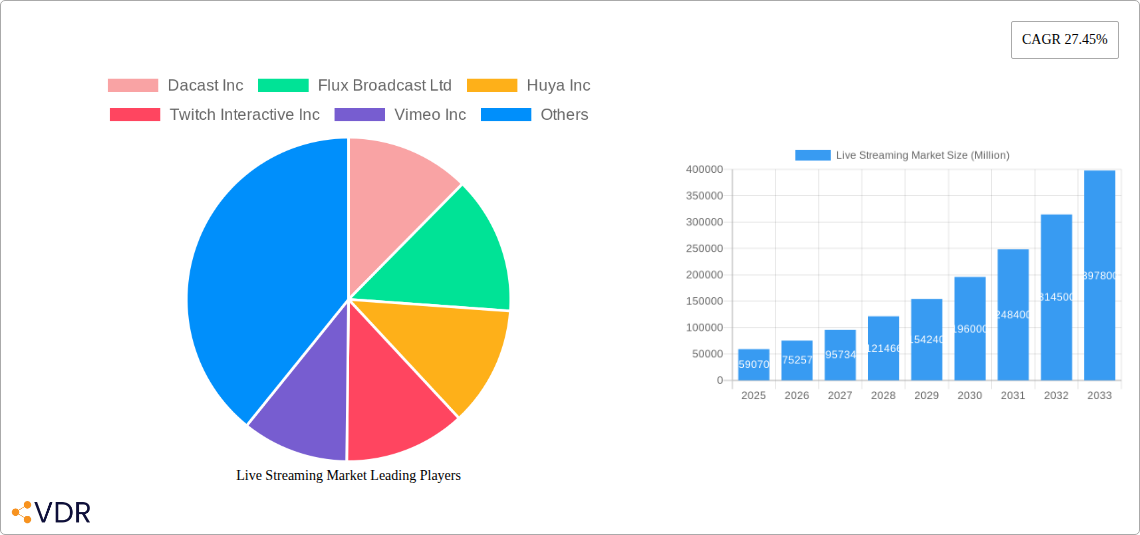
Live Streaming Market Market Size (In Billion)
Looking ahead, the market's trajectory suggests sustained growth. However, challenges remain. Maintaining consistent bandwidth and overcoming infrastructure limitations in certain regions are critical. Addressing concerns around content moderation and copyright infringement is vital for ensuring a sustainable and ethical ecosystem. The market's segmentation into different platforms (e.g., gaming, social media, educational), formats (e.g., short-form, long-form), and monetization models (e.g., subscriptions, advertising) will shape future developments. Companies need to adapt and innovate to cater to evolving consumer preferences and technological advancements. The emergence of immersive technologies like virtual and augmented reality (VR/AR) integration presents both opportunities and challenges for live streaming platforms, pushing the boundaries of user experience and engagement. The market’s future is dynamic, with ongoing innovation and competition defining its next chapter.
Live Streaming Market Company Market Share
Live Streaming Market: A Comprehensive Report (2019-2033)
This comprehensive report provides an in-depth analysis of the global live streaming market, encompassing historical data (2019-2024), current estimates (2025), and future forecasts (2025-2033). It delves into market dynamics, growth trends, regional dominance, key players, and emerging opportunities within the broader video streaming and online entertainment sectors. The report utilizes both parent market (online video streaming) and child market (live streaming) perspectives for a holistic understanding. Expect detailed quantitative and qualitative insights, including market sizing in millions of units, CAGR, market share breakdowns, and competitive landscape analysis.
Live Streaming Market Dynamics & Structure
The live streaming market is characterized by intense competition, rapid technological advancements, and evolving regulatory landscapes. Market concentration is moderately high, with a few dominant players alongside a large number of smaller, specialized providers. The market's structure is influenced by the interplay of several factors:
- Technological Innovation: Constant innovation in video compression technologies (e.g., HEVC, AV1), low-latency streaming protocols (e.g., WebRTC), and cloud-based infrastructure is driving market growth and shaping competitive dynamics.
- Regulatory Frameworks: Government regulations concerning data privacy, content moderation, and copyright infringement significantly impact market operations, especially in different regions.
- Competitive Product Substitutes: Traditional broadcasting, pre-recorded video content, and other forms of online video entertainment act as substitutes, influencing live streaming adoption rates.
- End-User Demographics: The market caters to a diverse demographic, ranging from individual streamers to large media organizations, leading to varied platform needs and functionalities.
- M&A Trends: The market has witnessed a considerable number of mergers and acquisitions (xx deals in the past five years, representing xx million USD in value), driven by consolidation efforts and access to new technologies/markets. Larger players are aggressively acquiring smaller companies to enhance capabilities and expand their market reach. These M&A activities indicate a high degree of industry competitiveness.
Live Streaming Market Growth Trends & Insights
The live streaming market has experienced significant growth throughout the historical period (2019-2024), driven by increasing internet penetration, the proliferation of mobile devices, and shifting consumer preferences towards interactive and on-demand entertainment. The market is projected to continue its strong growth trajectory during the forecast period (2025-2033), with a projected CAGR of xx%. Several key trends are shaping this growth:
- Increased Adoption Rates: The global penetration of live streaming services is increasing steadily across various demographics.
- Technological Disruptions: Advancements in VR/AR, AI-powered features, and interactive streaming experiences are significantly influencing consumer adoption.
- Consumer Behavior Shifts: The shift toward mobile-first consumption patterns and increased demand for personalized content experiences strongly favor live streaming platforms.
- Market Size Evolution: The global live streaming market size reached xx million units in 2024 and is forecast to reach xx million units by 2033.
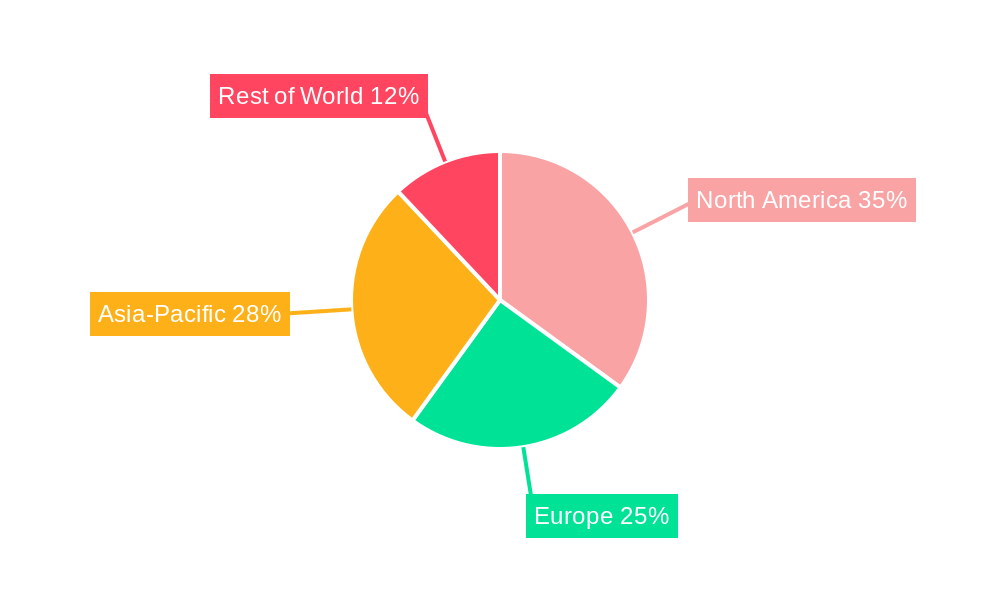
Dominant Regions, Countries, or Segments in Live Streaming Market
The North American and Asian markets currently dominate the live streaming landscape, driven by high internet penetration, robust digital infrastructure, and a large and engaged user base. However, significant growth potential exists in other regions.
- North America: High internet penetration, established digital infrastructure, and a strong presence of major live streaming platforms fuel market dominance.
- Asia: A massive population base, rapidly increasing smartphone ownership, and a thriving gaming and e-sports culture drive significant growth.
- Europe: Growing adoption rates, coupled with regulatory developments focused on content moderation and data privacy, are contributing to market expansion.
Key drivers for regional growth include:
- Favorable Economic Policies: Government incentives and support for the digital economy create a favorable environment for market expansion.
- Robust Digital Infrastructure: Extensive broadband internet access and advanced telecommunications networks underpin the growth of live streaming services.
Live Streaming Market Product Landscape
The live streaming market offers a diverse range of products and services, encompassing various platforms, encoding/decoding technologies, and distribution networks. Key product innovations focus on improving video quality, reducing latency, enhancing interactivity, and providing advanced analytics tools. New products emphasize seamless integration with social media platforms and improved monetization options for streamers.
Key Drivers, Barriers & Challenges in Live Streaming Market
Key Drivers:
- Increased Smartphone Penetration: Easy access to mobile internet facilitates the wider adoption of live streaming.
- Rising Internet Speed and Bandwidth: Improved internet infrastructure allows for higher quality and more stable streaming experiences.
- Growing Popularity of E-Sports and Gaming: Live streaming of gaming events attracts a significant audience.
Key Challenges:
- Bandwidth Limitations and Network Congestion: High-quality live streaming demands significant bandwidth, potentially leading to latency issues during peak usage.
- Content Moderation Challenges: Maintaining appropriate content and ensuring user safety across various platforms remains a significant hurdle.
- Competition and Market Saturation: The intense competition among established and emerging players makes market penetration challenging.
Emerging Opportunities in Live Streaming Market
- Expansion into Untapped Markets: Significant growth potential exists in developing economies with increasing internet penetration.
- Innovative Applications: Integration of live streaming into various sectors, such as education, healthcare, and corporate training, offers new opportunities.
- Evolving Consumer Preferences: Catering to the increasing demand for interactive, personalized, and immersive streaming experiences will drive market growth.
Growth Accelerators in the Live Streaming Market Industry
Technological advancements such as improved video compression, AI-powered content moderation, and the development of immersive streaming experiences are key growth accelerators. Strategic partnerships between technology providers, content creators, and distribution networks will play a crucial role in driving market expansion. Furthermore, expansion into new geographical markets and the development of innovative monetization models will fuel long-term growth.
Key Players Shaping the Live Streaming Market Market
- Dacast Inc
- Flux Broadcast Ltd
- Huya Inc
- Twitch Interactive Inc
- Vimeo Inc
- Pluto Inc
- BoxCast
- Uplynk by Edigo
- Wowza Streaming Engine
- Stream Hatchet
Notable Milestones in Live Streaming Market Sector
- September 2024: Dolby's launch of a comprehensive range of cloud video products and solutions supporting real-time interactive streaming, further enhanced by their acquisition of THEO Technologies, significantly improves the quality and capabilities of live streaming services.
- July 2024: Warner Bros. Discovery's innovative streaming features for the 2024 Paris Olympics demonstrate the ongoing evolution of live streaming towards enhanced user experiences, such as timeline markers and gold medal alerts.
In-Depth Live Streaming Market Market Outlook
The future of the live streaming market looks promising, driven by continued technological innovation, increasing consumer demand, and expansion into new markets. Strategic partnerships and investment in infrastructure will be crucial for long-term growth. The focus on personalized, interactive, and high-quality streaming experiences will differentiate successful players and drive market expansion in the years to come.
Live Streaming Market Segmentation
-
1. Component
- 1.1. Solution
- 1.2. Services
-
2. Type
- 2.1. Video Streaming
- 2.2. Audio Streaming
-
3. End-user Vertical
- 3.1. Gaming
- 3.2. Media and Entertainment
- 3.3. Sports
- 3.4. News and Events
- 3.5. Education
- 3.6. Other End-user Verticals
Live Streaming Market Segmentation By Geography
- 1. North America
- 2. Europe
- 3. Asia
- 4. Australia and New Zealand
- 5. Latin America
- 6. Middle East and Africa
Live Streaming Market Regional Market Share
Geographic Coverage of Live Streaming Market
Live Streaming Market REPORT HIGHLIGHTS
| Aspects | Details |
|---|---|
| Study Period | 2020-2034 |
| Base Year | 2025 |
| Estimated Year | 2026 |
| Forecast Period | 2026-2034 |
| Historical Period | 2020-2025 |
| Growth Rate | CAGR of 27.45% from 2020-2034 |
| Segmentation |
|
Table of Contents
- 1. Introduction
- 1.1. Research Scope
- 1.2. Market Segmentation
- 1.3. Research Objective
- 1.4. Definitions and Assumptions
- 2. Executive Summary
- 2.1. Market Snapshot
- 3. Market Dynamics
- 3.1. Market Drivers
- 3.2. Market Restrains
- 3.3. Market Trends
- 3.4. Market Opportunities
- 4. Market Factor Analysis
- 4.1. Porters Five Forces
- 4.1.1. Bargaining Power of Suppliers
- 4.1.2. Bargaining Power of Buyers
- 4.1.3. Threat of New Entrants
- 4.1.4. Threat of Substitutes
- 4.1.5. Competitive Rivalry
- 4.2. PESTEL analysis
- 4.3. BCG Analysis
- 4.3.1. Stars (High Growth, High Market Share)
- 4.3.2. Cash Cows (Low Growth, High Market Share)
- 4.3.3. Question Mark (High Growth, Low Market Share)
- 4.3.4. Dogs (Low Growth, Low Market Share)
- 4.4. Ansoff Matrix Analysis
- 4.5. Supply Chain Analysis
- 4.6. Regulatory Landscape
- 4.7. Current Market Potential and Opportunity Assessment (TAM–SAM–SOM Framework)
- 4.8. VDR Analyst Note
- 4.1. Porters Five Forces
- 5. Market Analysis, Insights and Forecast 2021-2033
- 5.1. Market Analysis, Insights and Forecast - by Component
- 5.1.1. Solution
- 5.1.2. Services
- 5.2. Market Analysis, Insights and Forecast - by Type
- 5.2.1. Video Streaming
- 5.2.2. Audio Streaming
- 5.3. Market Analysis, Insights and Forecast - by End-user Vertical
- 5.3.1. Gaming
- 5.3.2. Media and Entertainment
- 5.3.3. Sports
- 5.3.4. News and Events
- 5.3.5. Education
- 5.3.6. Other End-user Verticals
- 5.4. Market Analysis, Insights and Forecast - by Region
- 5.4.1. North America
- 5.4.2. Europe
- 5.4.3. Asia
- 5.4.4. Australia and New Zealand
- 5.4.5. Latin America
- 5.4.6. Middle East and Africa
- 5.1. Market Analysis, Insights and Forecast - by Component
- 6. Global Live Streaming Market Analysis, Insights and Forecast, 2021-2033
- 6.1. Market Analysis, Insights and Forecast - by Component
- 6.1.1. Solution
- 6.1.2. Services
- 6.2. Market Analysis, Insights and Forecast - by Type
- 6.2.1. Video Streaming
- 6.2.2. Audio Streaming
- 6.3. Market Analysis, Insights and Forecast - by End-user Vertical
- 6.3.1. Gaming
- 6.3.2. Media and Entertainment
- 6.3.3. Sports
- 6.3.4. News and Events
- 6.3.5. Education
- 6.3.6. Other End-user Verticals
- 6.1. Market Analysis, Insights and Forecast - by Component
- 7. North America Live Streaming Market Analysis, Insights and Forecast, 2021-2033
- 7.1. Market Analysis, Insights and Forecast - by Component
- 7.1.1. Solution
- 7.1.2. Services
- 7.2. Market Analysis, Insights and Forecast - by Type
- 7.2.1. Video Streaming
- 7.2.2. Audio Streaming
- 7.3. Market Analysis, Insights and Forecast - by End-user Vertical
- 7.3.1. Gaming
- 7.3.2. Media and Entertainment
- 7.3.3. Sports
- 7.3.4. News and Events
- 7.3.5. Education
- 7.3.6. Other End-user Verticals
- 7.1. Market Analysis, Insights and Forecast - by Component
- 8. Europe Live Streaming Market Analysis, Insights and Forecast, 2021-2033
- 8.1. Market Analysis, Insights and Forecast - by Component
- 8.1.1. Solution
- 8.1.2. Services
- 8.2. Market Analysis, Insights and Forecast - by Type
- 8.2.1. Video Streaming
- 8.2.2. Audio Streaming
- 8.3. Market Analysis, Insights and Forecast - by End-user Vertical
- 8.3.1. Gaming
- 8.3.2. Media and Entertainment
- 8.3.3. Sports
- 8.3.4. News and Events
- 8.3.5. Education
- 8.3.6. Other End-user Verticals
- 8.1. Market Analysis, Insights and Forecast - by Component
- 9. Asia Live Streaming Market Analysis, Insights and Forecast, 2021-2033
- 9.1. Market Analysis, Insights and Forecast - by Component
- 9.1.1. Solution
- 9.1.2. Services
- 9.2. Market Analysis, Insights and Forecast - by Type
- 9.2.1. Video Streaming
- 9.2.2. Audio Streaming
- 9.3. Market Analysis, Insights and Forecast - by End-user Vertical
- 9.3.1. Gaming
- 9.3.2. Media and Entertainment
- 9.3.3. Sports
- 9.3.4. News and Events
- 9.3.5. Education
- 9.3.6. Other End-user Verticals
- 9.1. Market Analysis, Insights and Forecast - by Component
- 10. Australia and New Zealand Live Streaming Market Analysis, Insights and Forecast, 2021-2033
- 10.1. Market Analysis, Insights and Forecast - by Component
- 10.1.1. Solution
- 10.1.2. Services
- 10.2. Market Analysis, Insights and Forecast - by Type
- 10.2.1. Video Streaming
- 10.2.2. Audio Streaming
- 10.3. Market Analysis, Insights and Forecast - by End-user Vertical
- 10.3.1. Gaming
- 10.3.2. Media and Entertainment
- 10.3.3. Sports
- 10.3.4. News and Events
- 10.3.5. Education
- 10.3.6. Other End-user Verticals
- 10.1. Market Analysis, Insights and Forecast - by Component
- 11. Latin America Live Streaming Market Analysis, Insights and Forecast, 2021-2033
- 11.1. Market Analysis, Insights and Forecast - by Component
- 11.1.1. Solution
- 11.1.2. Services
- 11.2. Market Analysis, Insights and Forecast - by Type
- 11.2.1. Video Streaming
- 11.2.2. Audio Streaming
- 11.3. Market Analysis, Insights and Forecast - by End-user Vertical
- 11.3.1. Gaming
- 11.3.2. Media and Entertainment
- 11.3.3. Sports
- 11.3.4. News and Events
- 11.3.5. Education
- 11.3.6. Other End-user Verticals
- 11.1. Market Analysis, Insights and Forecast - by Component
- 12. Middle East and Africa Live Streaming Market Analysis, Insights and Forecast, 2021-2033
- 12.1. Market Analysis, Insights and Forecast - by Component
- 12.1.1. Solution
- 12.1.2. Services
- 12.2. Market Analysis, Insights and Forecast - by Type
- 12.2.1. Video Streaming
- 12.2.2. Audio Streaming
- 12.3. Market Analysis, Insights and Forecast - by End-user Vertical
- 12.3.1. Gaming
- 12.3.2. Media and Entertainment
- 12.3.3. Sports
- 12.3.4. News and Events
- 12.3.5. Education
- 12.3.6. Other End-user Verticals
- 12.1. Market Analysis, Insights and Forecast - by Component
- 13. Competitive Analysis
- 13.1. Company Profiles
- 13.1.1 Dacast Inc
- 13.1.1.1. Company Overview
- 13.1.1.2. Products
- 13.1.1.3. Company Financials
- 13.1.1.4. SWOT Analysis
- 13.1.2 Flux Broadcast Ltd
- 13.1.2.1. Company Overview
- 13.1.2.2. Products
- 13.1.2.3. Company Financials
- 13.1.2.4. SWOT Analysis
- 13.1.3 Huya Inc
- 13.1.3.1. Company Overview
- 13.1.3.2. Products
- 13.1.3.3. Company Financials
- 13.1.3.4. SWOT Analysis
- 13.1.4 Twitch Interactive Inc
- 13.1.4.1. Company Overview
- 13.1.4.2. Products
- 13.1.4.3. Company Financials
- 13.1.4.4. SWOT Analysis
- 13.1.5 Vimeo Inc
- 13.1.5.1. Company Overview
- 13.1.5.2. Products
- 13.1.5.3. Company Financials
- 13.1.5.4. SWOT Analysis
- 13.1.6 Pluto Inc
- 13.1.6.1. Company Overview
- 13.1.6.2. Products
- 13.1.6.3. Company Financials
- 13.1.6.4. SWOT Analysis
- 13.1.7 BoxCast
- 13.1.7.1. Company Overview
- 13.1.7.2. Products
- 13.1.7.3. Company Financials
- 13.1.7.4. SWOT Analysis
- 13.1.8 Uplynk by Edigo
- 13.1.8.1. Company Overview
- 13.1.8.2. Products
- 13.1.8.3. Company Financials
- 13.1.8.4. SWOT Analysis
- 13.1.9 Wowza Streaming Engine
- 13.1.9.1. Company Overview
- 13.1.9.2. Products
- 13.1.9.3. Company Financials
- 13.1.9.4. SWOT Analysis
- 13.1.10 Stream Hatchet*List Not Exhaustive
- 13.1.10.1. Company Overview
- 13.1.10.2. Products
- 13.1.10.3. Company Financials
- 13.1.10.4. SWOT Analysis
- 13.1.1 Dacast Inc
- 13.2. Market Entropy
- 13.2.1 Company's Key Areas Served
- 13.2.2 Recent Developments
- 13.3. Company Market Share Analysis 2025
- 13.3.1 Top 5 Companies Market Share Analysis
- 13.3.2 Top 3 Companies Market Share Analysis
- 13.4. List of Potential Customers
- 14. Research Methodology
List of Figures
- Figure 1: Global Live Streaming Market Revenue Breakdown (Million, %) by Region 2025 & 2033
- Figure 2: Global Live Streaming Market Volume Breakdown (Billion, %) by Region 2025 & 2033
- Figure 3: North America Live Streaming Market Revenue (Million), by Component 2025 & 2033
- Figure 4: North America Live Streaming Market Volume (Billion), by Component 2025 & 2033
- Figure 5: North America Live Streaming Market Revenue Share (%), by Component 2025 & 2033
- Figure 6: North America Live Streaming Market Volume Share (%), by Component 2025 & 2033
- Figure 7: North America Live Streaming Market Revenue (Million), by Type 2025 & 2033
- Figure 8: North America Live Streaming Market Volume (Billion), by Type 2025 & 2033
- Figure 9: North America Live Streaming Market Revenue Share (%), by Type 2025 & 2033
- Figure 10: North America Live Streaming Market Volume Share (%), by Type 2025 & 2033
- Figure 11: North America Live Streaming Market Revenue (Million), by End-user Vertical 2025 & 2033
- Figure 12: North America Live Streaming Market Volume (Billion), by End-user Vertical 2025 & 2033
- Figure 13: North America Live Streaming Market Revenue Share (%), by End-user Vertical 2025 & 2033
- Figure 14: North America Live Streaming Market Volume Share (%), by End-user Vertical 2025 & 2033
- Figure 15: North America Live Streaming Market Revenue (Million), by Country 2025 & 2033
- Figure 16: North America Live Streaming Market Volume (Billion), by Country 2025 & 2033
- Figure 17: North America Live Streaming Market Revenue Share (%), by Country 2025 & 2033
- Figure 18: North America Live Streaming Market Volume Share (%), by Country 2025 & 2033
- Figure 19: Europe Live Streaming Market Revenue (Million), by Component 2025 & 2033
- Figure 20: Europe Live Streaming Market Volume (Billion), by Component 2025 & 2033
- Figure 21: Europe Live Streaming Market Revenue Share (%), by Component 2025 & 2033
- Figure 22: Europe Live Streaming Market Volume Share (%), by Component 2025 & 2033
- Figure 23: Europe Live Streaming Market Revenue (Million), by Type 2025 & 2033
- Figure 24: Europe Live Streaming Market Volume (Billion), by Type 2025 & 2033
- Figure 25: Europe Live Streaming Market Revenue Share (%), by Type 2025 & 2033
- Figure 26: Europe Live Streaming Market Volume Share (%), by Type 2025 & 2033
- Figure 27: Europe Live Streaming Market Revenue (Million), by End-user Vertical 2025 & 2033
- Figure 28: Europe Live Streaming Market Volume (Billion), by End-user Vertical 2025 & 2033
- Figure 29: Europe Live Streaming Market Revenue Share (%), by End-user Vertical 2025 & 2033
- Figure 30: Europe Live Streaming Market Volume Share (%), by End-user Vertical 2025 & 2033
- Figure 31: Europe Live Streaming Market Revenue (Million), by Country 2025 & 2033
- Figure 32: Europe Live Streaming Market Volume (Billion), by Country 2025 & 2033
- Figure 33: Europe Live Streaming Market Revenue Share (%), by Country 2025 & 2033
- Figure 34: Europe Live Streaming Market Volume Share (%), by Country 2025 & 2033
- Figure 35: Asia Live Streaming Market Revenue (Million), by Component 2025 & 2033
- Figure 36: Asia Live Streaming Market Volume (Billion), by Component 2025 & 2033
- Figure 37: Asia Live Streaming Market Revenue Share (%), by Component 2025 & 2033
- Figure 38: Asia Live Streaming Market Volume Share (%), by Component 2025 & 2033
- Figure 39: Asia Live Streaming Market Revenue (Million), by Type 2025 & 2033
- Figure 40: Asia Live Streaming Market Volume (Billion), by Type 2025 & 2033
- Figure 41: Asia Live Streaming Market Revenue Share (%), by Type 2025 & 2033
- Figure 42: Asia Live Streaming Market Volume Share (%), by Type 2025 & 2033
- Figure 43: Asia Live Streaming Market Revenue (Million), by End-user Vertical 2025 & 2033
- Figure 44: Asia Live Streaming Market Volume (Billion), by End-user Vertical 2025 & 2033
- Figure 45: Asia Live Streaming Market Revenue Share (%), by End-user Vertical 2025 & 2033
- Figure 46: Asia Live Streaming Market Volume Share (%), by End-user Vertical 2025 & 2033
- Figure 47: Asia Live Streaming Market Revenue (Million), by Country 2025 & 2033
- Figure 48: Asia Live Streaming Market Volume (Billion), by Country 2025 & 2033
- Figure 49: Asia Live Streaming Market Revenue Share (%), by Country 2025 & 2033
- Figure 50: Asia Live Streaming Market Volume Share (%), by Country 2025 & 2033
- Figure 51: Australia and New Zealand Live Streaming Market Revenue (Million), by Component 2025 & 2033
- Figure 52: Australia and New Zealand Live Streaming Market Volume (Billion), by Component 2025 & 2033
- Figure 53: Australia and New Zealand Live Streaming Market Revenue Share (%), by Component 2025 & 2033
- Figure 54: Australia and New Zealand Live Streaming Market Volume Share (%), by Component 2025 & 2033
- Figure 55: Australia and New Zealand Live Streaming Market Revenue (Million), by Type 2025 & 2033
- Figure 56: Australia and New Zealand Live Streaming Market Volume (Billion), by Type 2025 & 2033
- Figure 57: Australia and New Zealand Live Streaming Market Revenue Share (%), by Type 2025 & 2033
- Figure 58: Australia and New Zealand Live Streaming Market Volume Share (%), by Type 2025 & 2033
- Figure 59: Australia and New Zealand Live Streaming Market Revenue (Million), by End-user Vertical 2025 & 2033
- Figure 60: Australia and New Zealand Live Streaming Market Volume (Billion), by End-user Vertical 2025 & 2033
- Figure 61: Australia and New Zealand Live Streaming Market Revenue Share (%), by End-user Vertical 2025 & 2033
- Figure 62: Australia and New Zealand Live Streaming Market Volume Share (%), by End-user Vertical 2025 & 2033
- Figure 63: Australia and New Zealand Live Streaming Market Revenue (Million), by Country 2025 & 2033
- Figure 64: Australia and New Zealand Live Streaming Market Volume (Billion), by Country 2025 & 2033
- Figure 65: Australia and New Zealand Live Streaming Market Revenue Share (%), by Country 2025 & 2033
- Figure 66: Australia and New Zealand Live Streaming Market Volume Share (%), by Country 2025 & 2033
- Figure 67: Latin America Live Streaming Market Revenue (Million), by Component 2025 & 2033
- Figure 68: Latin America Live Streaming Market Volume (Billion), by Component 2025 & 2033
- Figure 69: Latin America Live Streaming Market Revenue Share (%), by Component 2025 & 2033
- Figure 70: Latin America Live Streaming Market Volume Share (%), by Component 2025 & 2033
- Figure 71: Latin America Live Streaming Market Revenue (Million), by Type 2025 & 2033
- Figure 72: Latin America Live Streaming Market Volume (Billion), by Type 2025 & 2033
- Figure 73: Latin America Live Streaming Market Revenue Share (%), by Type 2025 & 2033
- Figure 74: Latin America Live Streaming Market Volume Share (%), by Type 2025 & 2033
- Figure 75: Latin America Live Streaming Market Revenue (Million), by End-user Vertical 2025 & 2033
- Figure 76: Latin America Live Streaming Market Volume (Billion), by End-user Vertical 2025 & 2033
- Figure 77: Latin America Live Streaming Market Revenue Share (%), by End-user Vertical 2025 & 2033
- Figure 78: Latin America Live Streaming Market Volume Share (%), by End-user Vertical 2025 & 2033
- Figure 79: Latin America Live Streaming Market Revenue (Million), by Country 2025 & 2033
- Figure 80: Latin America Live Streaming Market Volume (Billion), by Country 2025 & 2033
- Figure 81: Latin America Live Streaming Market Revenue Share (%), by Country 2025 & 2033
- Figure 82: Latin America Live Streaming Market Volume Share (%), by Country 2025 & 2033
- Figure 83: Middle East and Africa Live Streaming Market Revenue (Million), by Component 2025 & 2033
- Figure 84: Middle East and Africa Live Streaming Market Volume (Billion), by Component 2025 & 2033
- Figure 85: Middle East and Africa Live Streaming Market Revenue Share (%), by Component 2025 & 2033
- Figure 86: Middle East and Africa Live Streaming Market Volume Share (%), by Component 2025 & 2033
- Figure 87: Middle East and Africa Live Streaming Market Revenue (Million), by Type 2025 & 2033
- Figure 88: Middle East and Africa Live Streaming Market Volume (Billion), by Type 2025 & 2033
- Figure 89: Middle East and Africa Live Streaming Market Revenue Share (%), by Type 2025 & 2033
- Figure 90: Middle East and Africa Live Streaming Market Volume Share (%), by Type 2025 & 2033
- Figure 91: Middle East and Africa Live Streaming Market Revenue (Million), by End-user Vertical 2025 & 2033
- Figure 92: Middle East and Africa Live Streaming Market Volume (Billion), by End-user Vertical 2025 & 2033
- Figure 93: Middle East and Africa Live Streaming Market Revenue Share (%), by End-user Vertical 2025 & 2033
- Figure 94: Middle East and Africa Live Streaming Market Volume Share (%), by End-user Vertical 2025 & 2033
- Figure 95: Middle East and Africa Live Streaming Market Revenue (Million), by Country 2025 & 2033
- Figure 96: Middle East and Africa Live Streaming Market Volume (Billion), by Country 2025 & 2033
- Figure 97: Middle East and Africa Live Streaming Market Revenue Share (%), by Country 2025 & 2033
- Figure 98: Middle East and Africa Live Streaming Market Volume Share (%), by Country 2025 & 2033
List of Tables
- Table 1: Global Live Streaming Market Revenue Million Forecast, by Component 2020 & 2033
- Table 2: Global Live Streaming Market Volume Billion Forecast, by Component 2020 & 2033
- Table 3: Global Live Streaming Market Revenue Million Forecast, by Type 2020 & 2033
- Table 4: Global Live Streaming Market Volume Billion Forecast, by Type 2020 & 2033
- Table 5: Global Live Streaming Market Revenue Million Forecast, by End-user Vertical 2020 & 2033
- Table 6: Global Live Streaming Market Volume Billion Forecast, by End-user Vertical 2020 & 2033
- Table 7: Global Live Streaming Market Revenue Million Forecast, by Region 2020 & 2033
- Table 8: Global Live Streaming Market Volume Billion Forecast, by Region 2020 & 2033
- Table 9: Global Live Streaming Market Revenue Million Forecast, by Component 2020 & 2033
- Table 10: Global Live Streaming Market Volume Billion Forecast, by Component 2020 & 2033
- Table 11: Global Live Streaming Market Revenue Million Forecast, by Type 2020 & 2033
- Table 12: Global Live Streaming Market Volume Billion Forecast, by Type 2020 & 2033
- Table 13: Global Live Streaming Market Revenue Million Forecast, by End-user Vertical 2020 & 2033
- Table 14: Global Live Streaming Market Volume Billion Forecast, by End-user Vertical 2020 & 2033
- Table 15: Global Live Streaming Market Revenue Million Forecast, by Country 2020 & 2033
- Table 16: Global Live Streaming Market Volume Billion Forecast, by Country 2020 & 2033
- Table 17: Global Live Streaming Market Revenue Million Forecast, by Component 2020 & 2033
- Table 18: Global Live Streaming Market Volume Billion Forecast, by Component 2020 & 2033
- Table 19: Global Live Streaming Market Revenue Million Forecast, by Type 2020 & 2033
- Table 20: Global Live Streaming Market Volume Billion Forecast, by Type 2020 & 2033
- Table 21: Global Live Streaming Market Revenue Million Forecast, by End-user Vertical 2020 & 2033
- Table 22: Global Live Streaming Market Volume Billion Forecast, by End-user Vertical 2020 & 2033
- Table 23: Global Live Streaming Market Revenue Million Forecast, by Country 2020 & 2033
- Table 24: Global Live Streaming Market Volume Billion Forecast, by Country 2020 & 2033
- Table 25: Global Live Streaming Market Revenue Million Forecast, by Component 2020 & 2033
- Table 26: Global Live Streaming Market Volume Billion Forecast, by Component 2020 & 2033
- Table 27: Global Live Streaming Market Revenue Million Forecast, by Type 2020 & 2033
- Table 28: Global Live Streaming Market Volume Billion Forecast, by Type 2020 & 2033
- Table 29: Global Live Streaming Market Revenue Million Forecast, by End-user Vertical 2020 & 2033
- Table 30: Global Live Streaming Market Volume Billion Forecast, by End-user Vertical 2020 & 2033
- Table 31: Global Live Streaming Market Revenue Million Forecast, by Country 2020 & 2033
- Table 32: Global Live Streaming Market Volume Billion Forecast, by Country 2020 & 2033
- Table 33: Global Live Streaming Market Revenue Million Forecast, by Component 2020 & 2033
- Table 34: Global Live Streaming Market Volume Billion Forecast, by Component 2020 & 2033
- Table 35: Global Live Streaming Market Revenue Million Forecast, by Type 2020 & 2033
- Table 36: Global Live Streaming Market Volume Billion Forecast, by Type 2020 & 2033
- Table 37: Global Live Streaming Market Revenue Million Forecast, by End-user Vertical 2020 & 2033
- Table 38: Global Live Streaming Market Volume Billion Forecast, by End-user Vertical 2020 & 2033
- Table 39: Global Live Streaming Market Revenue Million Forecast, by Country 2020 & 2033
- Table 40: Global Live Streaming Market Volume Billion Forecast, by Country 2020 & 2033
- Table 41: Global Live Streaming Market Revenue Million Forecast, by Component 2020 & 2033
- Table 42: Global Live Streaming Market Volume Billion Forecast, by Component 2020 & 2033
- Table 43: Global Live Streaming Market Revenue Million Forecast, by Type 2020 & 2033
- Table 44: Global Live Streaming Market Volume Billion Forecast, by Type 2020 & 2033
- Table 45: Global Live Streaming Market Revenue Million Forecast, by End-user Vertical 2020 & 2033
- Table 46: Global Live Streaming Market Volume Billion Forecast, by End-user Vertical 2020 & 2033
- Table 47: Global Live Streaming Market Revenue Million Forecast, by Country 2020 & 2033
- Table 48: Global Live Streaming Market Volume Billion Forecast, by Country 2020 & 2033
- Table 49: Global Live Streaming Market Revenue Million Forecast, by Component 2020 & 2033
- Table 50: Global Live Streaming Market Volume Billion Forecast, by Component 2020 & 2033
- Table 51: Global Live Streaming Market Revenue Million Forecast, by Type 2020 & 2033
- Table 52: Global Live Streaming Market Volume Billion Forecast, by Type 2020 & 2033
- Table 53: Global Live Streaming Market Revenue Million Forecast, by End-user Vertical 2020 & 2033
- Table 54: Global Live Streaming Market Volume Billion Forecast, by End-user Vertical 2020 & 2033
- Table 55: Global Live Streaming Market Revenue Million Forecast, by Country 2020 & 2033
- Table 56: Global Live Streaming Market Volume Billion Forecast, by Country 2020 & 2033
Frequently Asked Questions
1. What is the projected Compound Annual Growth Rate (CAGR) of the Live Streaming Market?
The projected CAGR is approximately 27.45%.
2. Which companies are prominent players in the Live Streaming Market?
Key companies in the market include Dacast Inc, Flux Broadcast Ltd, Huya Inc, Twitch Interactive Inc, Vimeo Inc, Pluto Inc, BoxCast, Uplynk by Edigo, Wowza Streaming Engine, Stream Hatchet*List Not Exhaustive.
3. What are the main segments of the Live Streaming Market?
The market segments include Component, Type, End-user Vertical.
4. Can you provide details about the market size?
The market size is estimated to be USD 59.07 Million as of 2022.
5. What are some drivers contributing to market growth?
Increasing Penetration Towards Greater Brand Engagement and Reach Through Live Videos; Increasing Penetration of Internet and Smartphone.
6. What are the notable trends driving market growth?
Gaming to Hold Significant Share for Market.
7. Are there any restraints impacting market growth?
Increasing Penetration Towards Greater Brand Engagement and Reach Through Live Videos; Increasing Penetration of Internet and Smartphone.
8. Can you provide examples of recent developments in the market?
September 2024: Dolby unveils a new comprehensive range of cloud video products and solutions supporting real-time interactive streaming. This comes on the heels of Dolby’s recent acquisition of THEO Technologies, a leading provider of high-quality video streaming tools embraced by top sports, media, and entertainment companies worldwide.July 2024: Warner Bros. Discovery (WBD) has unveiled a slew of special streaming features and innovations for its coverage of the 2024 Paris Olympic Games, including timeline markers, gold medal alerts and more. Timeline markers will allow viewers to easily navigate back through an event timeline to key moments. This feature is available across all platforms for discovery+ users, covering 15 sports, including beach volleyball, handball, tennis and more.
9. What pricing options are available for accessing the report?
Pricing options include single-user, multi-user, and enterprise licenses priced at USD 4750, USD 5250, and USD 8750 respectively.
10. Is the market size provided in terms of value or volume?
The market size is provided in terms of value, measured in Million and volume, measured in Billion.
11. Are there any specific market keywords associated with the report?
Yes, the market keyword associated with the report is "Live Streaming Market," which aids in identifying and referencing the specific market segment covered.
12. How do I determine which pricing option suits my needs best?
The pricing options vary based on user requirements and access needs. Individual users may opt for single-user licenses, while businesses requiring broader access may choose multi-user or enterprise licenses for cost-effective access to the report.
13. Are there any additional resources or data provided in the Live Streaming Market report?
While the report offers comprehensive insights, it's advisable to review the specific contents or supplementary materials provided to ascertain if additional resources or data are available.
14. How can I stay updated on further developments or reports in the Live Streaming Market?
To stay informed about further developments, trends, and reports in the Live Streaming Market, consider subscribing to industry newsletters, following relevant companies and organizations, or regularly checking reputable industry news sources and publications.
Methodology
Step 1 - Identification of Relevant Samples Size from Population Database


Step 2 - Approaches for Defining Global Market Size (Value, Volume* & Price*)

Note*: In applicable scenarios
Step 3 - Data Sources
Primary Research
- Web Analytics
- Survey Reports
- Research Institute
- Latest Research Reports
- Opinion Leaders
Secondary Research
- Annual Reports
- White Paper
- Latest Press Release
- Industry Association
- Paid Database
- Investor Presentations

Step 4 - Data Triangulation
Involves using different sources of information in order to increase the validity of a study
These sources are likely to be stakeholders in a program - participants, other researchers, program staff, other community members, and so on.
Then we put all data in single framework & apply various statistical tools to find out the dynamic on the market.
During the analysis stage, feedback from the stakeholder groups would be compared to determine areas of agreement as well as areas of divergence