

Key Insights
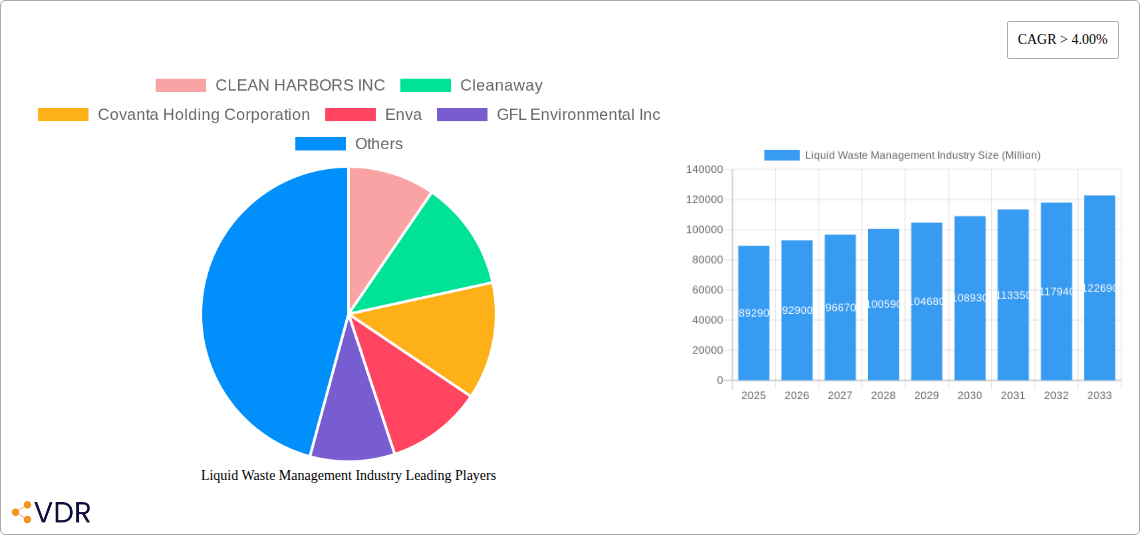
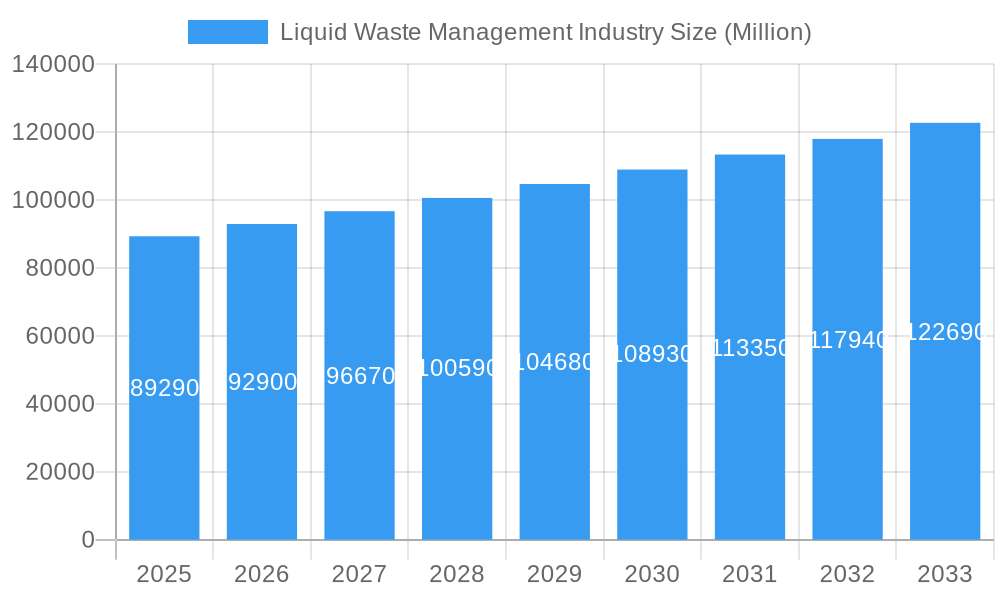
The global liquid waste management market, valued at $89.29 billion in 2025, is projected to experience robust growth, exceeding a compound annual growth rate (CAGR) of 4% through 2033. This expansion is driven by several key factors. Stringent government regulations aimed at protecting water resources and the environment are compelling businesses and municipalities to adopt more sophisticated and sustainable liquid waste treatment solutions. The increasing industrialization and urbanization across developing economies are contributing to a surge in liquid waste generation, fueling demand for effective management services. Furthermore, technological advancements in wastewater treatment technologies, such as membrane bioreactors and advanced oxidation processes, are improving efficiency and reducing environmental impact, further stimulating market growth. The rising awareness of the negative consequences of improper waste disposal on public health and ecosystems is also driving adoption of modern waste management practices.
Liquid Waste Management Industry Market Size (In Billion)
Major players in the liquid waste management sector, including Clean Harbors Inc., Cleanaway, Covanta Holding Corporation, and Veolia, are actively investing in research and development to enhance their service offerings and expand their market reach. Competition is fierce, leading to innovation in pricing strategies and service packages to attract clients. While the market presents significant opportunities, challenges remain. Fluctuations in raw material costs, particularly energy prices, can impact operational profitability. Moreover, securing necessary permits and navigating complex environmental regulations can pose hurdles for companies operating in this sector. The market is segmented by various factors, including waste type (industrial, municipal, etc.), treatment method, and geographical region. Growth will likely be geographically diverse, with developing regions witnessing faster expansion rates compared to mature markets. Understanding these nuances will be crucial for successful market participation.
Liquid Waste Management Industry Company Market Share
Liquid Waste Management Industry Market Report: 2019-2033
This comprehensive report provides an in-depth analysis of the global liquid waste management industry, encompassing market dynamics, growth trends, competitive landscape, and future outlook. The study period covers 2019-2033, with 2025 as the base and estimated year. This report is essential for industry professionals, investors, and stakeholders seeking to understand and capitalize on opportunities within this crucial sector. The report analyzes the parent market of Waste Management and the child market of Liquid Waste Management, providing a granular view of market segmentation and opportunities.
Market Size: The global liquid waste management market was valued at xx Million in 2024 and is projected to reach xx Million by 2033, exhibiting a CAGR of xx% during the forecast period (2025-2033).
Liquid Waste Management Industry Market Dynamics & Structure
The liquid waste management market is a dynamic and evolving sector characterized by a moderately consolidated structure. This landscape features a blend of established multinational corporations and a vibrant network of smaller, agile regional operators. The inherent capital intensity and the significant scale of operations required for efficient treatment and disposal are key factors influencing market concentration. Technological innovation serves as a primary catalyst, with a strong emphasis on enhancing treatment efficiency, minimizing environmental footprints, and maximizing resource recovery from waste streams. A robust and increasingly stringent global regulatory framework is actively shaping market dynamics, compelling the adoption of cutting-edge treatment technologies and sustainable practices. While direct competitive substitutes for comprehensive liquid waste management are limited, the emergence of innovative, niche solutions for specific waste streams, such as decentralized or on-site treatment systems, presents emerging alternatives. The end-user demographic is exceptionally diverse, spanning critical sectors including industrial manufacturing, commercial enterprises, and municipal services. Merger and acquisition (M&A) activity remains a significant trend, underscoring the ongoing consolidation within the industry and strategic efforts by companies to broaden their geographical reach and expand their comprehensive service portfolios.
- Market Concentration: Moderately consolidated, with the top 5 players projected to hold approximately 45-55% market share in 2024.
- Technological Innovation: Key areas of development include advanced resource recovery techniques (e.g., nutrient reclamation, energy generation), cutting-edge advanced oxidation processes (AOPs) for recalcitrant pollutants, and highly efficient membrane filtration systems for water reuse.
- Regulatory Framework: Stringent environmental regulations worldwide are a primary driver, mandating higher treatment standards and promoting the adoption of cleaner, more sustainable technologies and circular economy principles.
- Competitive Substitutes: Limited in the broader market, but growing in specific niches. Emerging solutions focus on localized treatment, advanced recycling technologies for particular waste components, and biological remediation methods for certain effluent types.
- End-User Demographics: Highly diverse, encompassing a wide spectrum of clients including heavy industry (e.g., chemical, pharmaceutical, food & beverage), various commercial operations (e.g., healthcare, hospitality, retail), and municipal wastewater treatment facilities.
- M&A Trends: Significant consolidation is occurring, driven by the pursuit of economies of scale, technological integration, and market expansion. Approximately 25-35 major strategic deals were recorded between 2019 and 2024, indicating a strong trend towards industry consolidation.
Liquid Waste Management Industry Growth Trends & Insights
The liquid waste management market is experiencing steady growth driven by increasing industrialization, urbanization, and stricter environmental regulations. Adoption rates for advanced treatment technologies are increasing, particularly in developed regions, due to rising awareness of environmental sustainability. Technological disruptions, such as the application of AI and IoT in waste management operations, are enhancing efficiency and optimizing resource allocation. Consumer behavior shifts are indirectly impacting the market, with increasing demand for sustainable products and services driving companies to adopt environmentally friendly practices. This trend is expected to further accelerate market growth in the coming years. The market is segmented by waste type (industrial, municipal, etc.), treatment technology (biological, physical-chemical), and service type (collection, treatment, disposal).
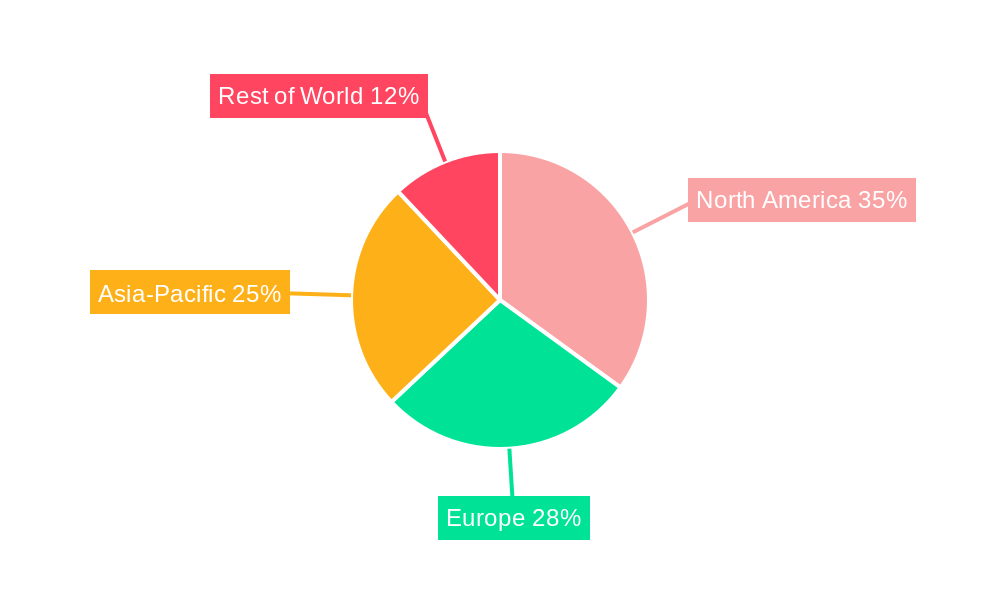
Dominant Regions, Countries, or Segments in Liquid Waste Management Industry
Currently, North America and Europe stand as the dominant regions in the global liquid waste management market. This leadership is underpinned by well-established infrastructure, stringent and consistently enforced environmental regulations, and a high density of industrial and commercial activities that generate significant liquid waste volumes. However, the Asia-Pacific region is rapidly emerging as a powerhouse of growth potential. Driven by accelerated industrialization, rapid urbanization, and increasing awareness of environmental sustainability, countries within this region are witnessing substantial investments in modern waste management infrastructure. Specifically, China and India are at the forefront of this transformation, making significant strides in developing and expanding their liquid waste treatment and management capabilities.
- North America: Characterized by a robust regulatory framework, extensive industrial activity, and the widespread adoption of advanced treatment technologies, leading to high standards of liquid waste management.
- Europe: Possesses mature infrastructure, exceptionally stringent environmental standards, and a strong focus on the principles of the circular economy, particularly in resource recovery and water reuse.
- Asia-Pacific: Experiencing the most rapid growth due to unprecedented industrialization, massive urbanization, and a burgeoning middle class, creating significant demand for improved waste management services.
- Key Drivers: The primary growth drivers across all regions include increasingly stringent environmental regulations, the escalating pace of industrialization and urbanization, and a heightened global awareness and demand for environmental sustainability.
Liquid Waste Management Industry Product Landscape
The liquid waste management industry offers a range of services and technologies, including collection, transportation, treatment, and disposal. Recent innovations focus on resource recovery, such as biogas production from wastewater treatment, and the development of more energy-efficient and sustainable treatment processes. The unique selling propositions of leading companies are often based on their technological expertise, geographical coverage, and integrated service offerings. Technological advancements are leading to more efficient and environmentally friendly waste management solutions.
Key Drivers, Barriers & Challenges in Liquid Waste Management Industry
Key Drivers:
- Increasing industrialization and urbanization leading to higher waste generation.
- Stringent environmental regulations promoting the adoption of advanced technologies.
- Growing awareness of environmental sustainability among businesses and consumers.
Challenges and Restraints:
- High capital expenditure required for infrastructure development and technology implementation.
- Fluctuating raw material prices and energy costs impacting operational profitability.
- Supply chain disruptions, particularly in the procurement of specialized equipment and chemicals. This has resulted in a xx% increase in operational costs for some companies in 2024.
Emerging Opportunities in Liquid Waste Management Industry
- Untapped markets in developing countries present significant growth potential.
- Innovative applications of advanced treatment technologies, such as membrane bioreactors and anaerobic digestion, offer opportunities for efficiency improvements and resource recovery.
- Evolving consumer preferences towards sustainable and environmentally friendly waste management solutions create new market niches.
Growth Accelerators in the Liquid Waste Management Industry
The liquid waste management industry's growth is being significantly accelerated by technological breakthroughs and strategic market strategies. The integration of Artificial Intelligence (AI) is optimizing treatment processes in real-time, leading to enhanced efficiency and reduced operational costs. Furthermore, the deployment of the Internet of Things (IoT) enables remote monitoring and predictive maintenance of treatment facilities, ensuring continuous and reliable operations. Strategic partnerships between established waste management companies and innovative technology providers are proving crucial for fostering innovation, developing novel solutions, and improving overall service delivery. Proactive market expansion strategies, particularly targeting emerging economies and historically underserved regions, are unlocking new and substantial growth opportunities for forward-thinking companies in the sector.
Key Players Shaping the Liquid Waste Management Industry Market
- CLEAN HARBORS INC: A leading provider of environmental and industrial services, including hazardous waste management and disposal.
- Cleanaway: A major waste management company in Australia, offering a comprehensive range of waste and recycling services.
- Covanta Holding Corporation: Specializes in waste-to-energy solutions and provides sustainable waste management services.
- Enva: A prominent environmental services group in the UK and Ireland, focusing on waste recycling and resource recovery.
- GFL Environmental Inc: A diversified environmental services company in North America, offering waste management, water, and soil solutions.
- Hulsey (a Blue Flow Company): Offers advanced wastewater treatment and reuse solutions, emphasizing sustainability.
- Ovivo: A global leader in water and wastewater treatment technologies and solutions for municipal and industrial clients.
- REMONDIS SE & Co KG: One of the world's largest privately owned environmental service companies, providing waste management, water, and air quality services.
- SUEZ: A global leader in water and waste management, committed to resource recovery and sustainable development.
- Veolia: A world leader in optimized resource management, providing a range of services for water, waste, and energy.
- WM Intellectual Property Holdings L L C: Associated with Waste Management, Inc., a leading provider of comprehensive waste management services in North America.
- List Not Exhaustive
Notable Milestones in Liquid Waste Management Industry Sector
- October 2023: SUEZ Recycling and Recovery UK acquired Devon Contract Waste (DCW), strengthening its market position.
- September 2023: SUEZ secured contracts for water and waste projects in China, supporting the nation's carbon neutrality goals.
- January 2022: Veolia completed the sale of the new SUEZ to a consortium of investors, reshaping the industry landscape.
In-Depth Liquid Waste Management Industry Market Outlook
The outlook for the liquid waste management industry is exceptionally promising, propelled by the ongoing trends of global urbanization, continued industrial expansion, and a universally increasing emphasis on environmental sustainability and resource preservation. Strategic opportunities abound for companies that can effectively harness advancements in technology, cultivate robust strategic partnerships, and successfully penetrate burgeoning emerging markets. Companies demonstrating the agility to adeptly navigate complex regulatory landscapes while championing innovative, eco-friendly solutions will be best positioned to achieve sustained success and leadership in the long term within this vital sector.
Liquid Waste Management Industry Segmentation
-
1. Source
- 1.1. Residential
- 1.2. Commercial
- 1.3. Industrial
-
2. Service
- 2.1. Collection
- 2.2. Transportation/Hauling
- 2.3. Disposal/Recycling
-
3. End-user Industry
- 3.1. Automotive
- 3.2. Iron and Steel
- 3.3. Oil and Gas
- 3.4. Pharmaceutical
- 3.5. Textile
- 3.6. Other En
Liquid Waste Management Industry Segmentation By Geography
-
1. Asia Pacific
- 1.1. China
- 1.2. India
- 1.3. Japan
- 1.4. South Korea
- 1.5. Rest of Asia Pacific
-
2. North America
- 2.1. United States
- 2.2. Canada
- 2.3. Mexico
-
3. Europe
- 3.1. Germany
- 3.2. United Kingdom
- 3.3. France
- 3.4. Italy
- 3.5. Rest of Europe
-
4. South America
- 4.1. Brazil
- 4.2. Argentina
- 4.3. Rest of South America
-
5. Middle East and Africa
- 5.1. Saudi Arabia
- 5.2. South Africa
- 5.3. Rest of Middle East and Africa
Liquid Waste Management Industry Regional Market Share
Geographic Coverage of Liquid Waste Management Industry
Liquid Waste Management Industry REPORT HIGHLIGHTS
| Aspects | Details |
|---|---|
| Study Period | 2020-2034 |
| Base Year | 2025 |
| Estimated Year | 2026 |
| Forecast Period | 2026-2034 |
| Historical Period | 2020-2025 |
| Growth Rate | CAGR of > 4.00% from 2020-2034 |
| Segmentation |
|
Table of Contents
- 1. Introduction
- 1.1. Research Scope
- 1.2. Market Segmentation
- 1.3. Research Objective
- 1.4. Definitions and Assumptions
- 2. Executive Summary
- 2.1. Market Snapshot
- 3. Market Dynamics
- 3.1. Market Drivers
- 3.2. Market Restrains
- 3.3. Market Trends
- 3.4. Market Opportunities
- 4. Market Factor Analysis
- 4.1. Porters Five Forces
- 4.1.1. Bargaining Power of Suppliers
- 4.1.2. Bargaining Power of Buyers
- 4.1.3. Threat of New Entrants
- 4.1.4. Threat of Substitutes
- 4.1.5. Competitive Rivalry
- 4.2. PESTEL analysis
- 4.3. BCG Analysis
- 4.3.1. Stars (High Growth, High Market Share)
- 4.3.2. Cash Cows (Low Growth, High Market Share)
- 4.3.3. Question Mark (High Growth, Low Market Share)
- 4.3.4. Dogs (Low Growth, Low Market Share)
- 4.4. Ansoff Matrix Analysis
- 4.5. Supply Chain Analysis
- 4.6. Regulatory Landscape
- 4.7. Current Market Potential and Opportunity Assessment (TAM–SAM–SOM Framework)
- 4.8. VDR Analyst Note
- 4.1. Porters Five Forces
- 5. Market Analysis, Insights and Forecast 2021-2033
- 5.1. Market Analysis, Insights and Forecast - by Source
- 5.1.1. Residential
- 5.1.2. Commercial
- 5.1.3. Industrial
- 5.2. Market Analysis, Insights and Forecast - by Service
- 5.2.1. Collection
- 5.2.2. Transportation/Hauling
- 5.2.3. Disposal/Recycling
- 5.3. Market Analysis, Insights and Forecast - by End-user Industry
- 5.3.1. Automotive
- 5.3.2. Iron and Steel
- 5.3.3. Oil and Gas
- 5.3.4. Pharmaceutical
- 5.3.5. Textile
- 5.3.6. Other En
- 5.4. Market Analysis, Insights and Forecast - by Region
- 5.4.1. Asia Pacific
- 5.4.2. North America
- 5.4.3. Europe
- 5.4.4. South America
- 5.4.5. Middle East and Africa
- 5.1. Market Analysis, Insights and Forecast - by Source
- 6. Global Liquid Waste Management Industry Analysis, Insights and Forecast, 2021-2033
- 6.1. Market Analysis, Insights and Forecast - by Source
- 6.1.1. Residential
- 6.1.2. Commercial
- 6.1.3. Industrial
- 6.2. Market Analysis, Insights and Forecast - by Service
- 6.2.1. Collection
- 6.2.2. Transportation/Hauling
- 6.2.3. Disposal/Recycling
- 6.3. Market Analysis, Insights and Forecast - by End-user Industry
- 6.3.1. Automotive
- 6.3.2. Iron and Steel
- 6.3.3. Oil and Gas
- 6.3.4. Pharmaceutical
- 6.3.5. Textile
- 6.3.6. Other En
- 6.1. Market Analysis, Insights and Forecast - by Source
- 7. Asia Pacific Liquid Waste Management Industry Analysis, Insights and Forecast, 2021-2033
- 7.1. Market Analysis, Insights and Forecast - by Source
- 7.1.1. Residential
- 7.1.2. Commercial
- 7.1.3. Industrial
- 7.2. Market Analysis, Insights and Forecast - by Service
- 7.2.1. Collection
- 7.2.2. Transportation/Hauling
- 7.2.3. Disposal/Recycling
- 7.3. Market Analysis, Insights and Forecast - by End-user Industry
- 7.3.1. Automotive
- 7.3.2. Iron and Steel
- 7.3.3. Oil and Gas
- 7.3.4. Pharmaceutical
- 7.3.5. Textile
- 7.3.6. Other En
- 7.1. Market Analysis, Insights and Forecast - by Source
- 8. North America Liquid Waste Management Industry Analysis, Insights and Forecast, 2021-2033
- 8.1. Market Analysis, Insights and Forecast - by Source
- 8.1.1. Residential
- 8.1.2. Commercial
- 8.1.3. Industrial
- 8.2. Market Analysis, Insights and Forecast - by Service
- 8.2.1. Collection
- 8.2.2. Transportation/Hauling
- 8.2.3. Disposal/Recycling
- 8.3. Market Analysis, Insights and Forecast - by End-user Industry
- 8.3.1. Automotive
- 8.3.2. Iron and Steel
- 8.3.3. Oil and Gas
- 8.3.4. Pharmaceutical
- 8.3.5. Textile
- 8.3.6. Other En
- 8.1. Market Analysis, Insights and Forecast - by Source
- 9. Europe Liquid Waste Management Industry Analysis, Insights and Forecast, 2021-2033
- 9.1. Market Analysis, Insights and Forecast - by Source
- 9.1.1. Residential
- 9.1.2. Commercial
- 9.1.3. Industrial
- 9.2. Market Analysis, Insights and Forecast - by Service
- 9.2.1. Collection
- 9.2.2. Transportation/Hauling
- 9.2.3. Disposal/Recycling
- 9.3. Market Analysis, Insights and Forecast - by End-user Industry
- 9.3.1. Automotive
- 9.3.2. Iron and Steel
- 9.3.3. Oil and Gas
- 9.3.4. Pharmaceutical
- 9.3.5. Textile
- 9.3.6. Other En
- 9.1. Market Analysis, Insights and Forecast - by Source
- 10. South America Liquid Waste Management Industry Analysis, Insights and Forecast, 2021-2033
- 10.1. Market Analysis, Insights and Forecast - by Source
- 10.1.1. Residential
- 10.1.2. Commercial
- 10.1.3. Industrial
- 10.2. Market Analysis, Insights and Forecast - by Service
- 10.2.1. Collection
- 10.2.2. Transportation/Hauling
- 10.2.3. Disposal/Recycling
- 10.3. Market Analysis, Insights and Forecast - by End-user Industry
- 10.3.1. Automotive
- 10.3.2. Iron and Steel
- 10.3.3. Oil and Gas
- 10.3.4. Pharmaceutical
- 10.3.5. Textile
- 10.3.6. Other En
- 10.1. Market Analysis, Insights and Forecast - by Source
- 11. Middle East and Africa Liquid Waste Management Industry Analysis, Insights and Forecast, 2021-2033
- 11.1. Market Analysis, Insights and Forecast - by Source
- 11.1.1. Residential
- 11.1.2. Commercial
- 11.1.3. Industrial
- 11.2. Market Analysis, Insights and Forecast - by Service
- 11.2.1. Collection
- 11.2.2. Transportation/Hauling
- 11.2.3. Disposal/Recycling
- 11.3. Market Analysis, Insights and Forecast - by End-user Industry
- 11.3.1. Automotive
- 11.3.2. Iron and Steel
- 11.3.3. Oil and Gas
- 11.3.4. Pharmaceutical
- 11.3.5. Textile
- 11.3.6. Other En
- 11.1. Market Analysis, Insights and Forecast - by Source
- 12. Competitive Analysis
- 12.1. Company Profiles
- 12.1.1 CLEAN HARBORS INC
- 12.1.1.1. Company Overview
- 12.1.1.2. Products
- 12.1.1.3. Company Financials
- 12.1.1.4. SWOT Analysis
- 12.1.2 Cleanaway
- 12.1.2.1. Company Overview
- 12.1.2.2. Products
- 12.1.2.3. Company Financials
- 12.1.2.4. SWOT Analysis
- 12.1.3 Covanta Holding Corporation
- 12.1.3.1. Company Overview
- 12.1.3.2. Products
- 12.1.3.3. Company Financials
- 12.1.3.4. SWOT Analysis
- 12.1.4 Enva
- 12.1.4.1. Company Overview
- 12.1.4.2. Products
- 12.1.4.3. Company Financials
- 12.1.4.4. SWOT Analysis
- 12.1.5 GFL Environmental Inc
- 12.1.5.1. Company Overview
- 12.1.5.2. Products
- 12.1.5.3. Company Financials
- 12.1.5.4. SWOT Analysis
- 12.1.6 Hulsey (a Blue Flow Company)
- 12.1.6.1. Company Overview
- 12.1.6.2. Products
- 12.1.6.3. Company Financials
- 12.1.6.4. SWOT Analysis
- 12.1.7 Ovivo
- 12.1.7.1. Company Overview
- 12.1.7.2. Products
- 12.1.7.3. Company Financials
- 12.1.7.4. SWOT Analysis
- 12.1.8 REMONDIS SE & Co KG
- 12.1.8.1. Company Overview
- 12.1.8.2. Products
- 12.1.8.3. Company Financials
- 12.1.8.4. SWOT Analysis
- 12.1.9 SUEZ
- 12.1.9.1. Company Overview
- 12.1.9.2. Products
- 12.1.9.3. Company Financials
- 12.1.9.4. SWOT Analysis
- 12.1.10 Veolia
- 12.1.10.1. Company Overview
- 12.1.10.2. Products
- 12.1.10.3. Company Financials
- 12.1.10.4. SWOT Analysis
- 12.1.11 WM Intellectual Property Holdings L L C *List Not Exhaustive
- 12.1.11.1. Company Overview
- 12.1.11.2. Products
- 12.1.11.3. Company Financials
- 12.1.11.4. SWOT Analysis
- 12.1.1 CLEAN HARBORS INC
- 12.2. Market Entropy
- 12.2.1 Company's Key Areas Served
- 12.2.2 Recent Developments
- 12.3. Company Market Share Analysis 2025
- 12.3.1 Top 5 Companies Market Share Analysis
- 12.3.2 Top 3 Companies Market Share Analysis
- 12.4. List of Potential Customers
- 13. Research Methodology
List of Figures
- Figure 1: Global Liquid Waste Management Industry Revenue Breakdown (Million, %) by Region 2025 & 2033
- Figure 2: Global Liquid Waste Management Industry Volume Breakdown (Billion, %) by Region 2025 & 2033
- Figure 3: Asia Pacific Liquid Waste Management Industry Revenue (Million), by Source 2025 & 2033
- Figure 4: Asia Pacific Liquid Waste Management Industry Volume (Billion), by Source 2025 & 2033
- Figure 5: Asia Pacific Liquid Waste Management Industry Revenue Share (%), by Source 2025 & 2033
- Figure 6: Asia Pacific Liquid Waste Management Industry Volume Share (%), by Source 2025 & 2033
- Figure 7: Asia Pacific Liquid Waste Management Industry Revenue (Million), by Service 2025 & 2033
- Figure 8: Asia Pacific Liquid Waste Management Industry Volume (Billion), by Service 2025 & 2033
- Figure 9: Asia Pacific Liquid Waste Management Industry Revenue Share (%), by Service 2025 & 2033
- Figure 10: Asia Pacific Liquid Waste Management Industry Volume Share (%), by Service 2025 & 2033
- Figure 11: Asia Pacific Liquid Waste Management Industry Revenue (Million), by End-user Industry 2025 & 2033
- Figure 12: Asia Pacific Liquid Waste Management Industry Volume (Billion), by End-user Industry 2025 & 2033
- Figure 13: Asia Pacific Liquid Waste Management Industry Revenue Share (%), by End-user Industry 2025 & 2033
- Figure 14: Asia Pacific Liquid Waste Management Industry Volume Share (%), by End-user Industry 2025 & 2033
- Figure 15: Asia Pacific Liquid Waste Management Industry Revenue (Million), by Country 2025 & 2033
- Figure 16: Asia Pacific Liquid Waste Management Industry Volume (Billion), by Country 2025 & 2033
- Figure 17: Asia Pacific Liquid Waste Management Industry Revenue Share (%), by Country 2025 & 2033
- Figure 18: Asia Pacific Liquid Waste Management Industry Volume Share (%), by Country 2025 & 2033
- Figure 19: North America Liquid Waste Management Industry Revenue (Million), by Source 2025 & 2033
- Figure 20: North America Liquid Waste Management Industry Volume (Billion), by Source 2025 & 2033
- Figure 21: North America Liquid Waste Management Industry Revenue Share (%), by Source 2025 & 2033
- Figure 22: North America Liquid Waste Management Industry Volume Share (%), by Source 2025 & 2033
- Figure 23: North America Liquid Waste Management Industry Revenue (Million), by Service 2025 & 2033
- Figure 24: North America Liquid Waste Management Industry Volume (Billion), by Service 2025 & 2033
- Figure 25: North America Liquid Waste Management Industry Revenue Share (%), by Service 2025 & 2033
- Figure 26: North America Liquid Waste Management Industry Volume Share (%), by Service 2025 & 2033
- Figure 27: North America Liquid Waste Management Industry Revenue (Million), by End-user Industry 2025 & 2033
- Figure 28: North America Liquid Waste Management Industry Volume (Billion), by End-user Industry 2025 & 2033
- Figure 29: North America Liquid Waste Management Industry Revenue Share (%), by End-user Industry 2025 & 2033
- Figure 30: North America Liquid Waste Management Industry Volume Share (%), by End-user Industry 2025 & 2033
- Figure 31: North America Liquid Waste Management Industry Revenue (Million), by Country 2025 & 2033
- Figure 32: North America Liquid Waste Management Industry Volume (Billion), by Country 2025 & 2033
- Figure 33: North America Liquid Waste Management Industry Revenue Share (%), by Country 2025 & 2033
- Figure 34: North America Liquid Waste Management Industry Volume Share (%), by Country 2025 & 2033
- Figure 35: Europe Liquid Waste Management Industry Revenue (Million), by Source 2025 & 2033
- Figure 36: Europe Liquid Waste Management Industry Volume (Billion), by Source 2025 & 2033
- Figure 37: Europe Liquid Waste Management Industry Revenue Share (%), by Source 2025 & 2033
- Figure 38: Europe Liquid Waste Management Industry Volume Share (%), by Source 2025 & 2033
- Figure 39: Europe Liquid Waste Management Industry Revenue (Million), by Service 2025 & 2033
- Figure 40: Europe Liquid Waste Management Industry Volume (Billion), by Service 2025 & 2033
- Figure 41: Europe Liquid Waste Management Industry Revenue Share (%), by Service 2025 & 2033
- Figure 42: Europe Liquid Waste Management Industry Volume Share (%), by Service 2025 & 2033
- Figure 43: Europe Liquid Waste Management Industry Revenue (Million), by End-user Industry 2025 & 2033
- Figure 44: Europe Liquid Waste Management Industry Volume (Billion), by End-user Industry 2025 & 2033
- Figure 45: Europe Liquid Waste Management Industry Revenue Share (%), by End-user Industry 2025 & 2033
- Figure 46: Europe Liquid Waste Management Industry Volume Share (%), by End-user Industry 2025 & 2033
- Figure 47: Europe Liquid Waste Management Industry Revenue (Million), by Country 2025 & 2033
- Figure 48: Europe Liquid Waste Management Industry Volume (Billion), by Country 2025 & 2033
- Figure 49: Europe Liquid Waste Management Industry Revenue Share (%), by Country 2025 & 2033
- Figure 50: Europe Liquid Waste Management Industry Volume Share (%), by Country 2025 & 2033
- Figure 51: South America Liquid Waste Management Industry Revenue (Million), by Source 2025 & 2033
- Figure 52: South America Liquid Waste Management Industry Volume (Billion), by Source 2025 & 2033
- Figure 53: South America Liquid Waste Management Industry Revenue Share (%), by Source 2025 & 2033
- Figure 54: South America Liquid Waste Management Industry Volume Share (%), by Source 2025 & 2033
- Figure 55: South America Liquid Waste Management Industry Revenue (Million), by Service 2025 & 2033
- Figure 56: South America Liquid Waste Management Industry Volume (Billion), by Service 2025 & 2033
- Figure 57: South America Liquid Waste Management Industry Revenue Share (%), by Service 2025 & 2033
- Figure 58: South America Liquid Waste Management Industry Volume Share (%), by Service 2025 & 2033
- Figure 59: South America Liquid Waste Management Industry Revenue (Million), by End-user Industry 2025 & 2033
- Figure 60: South America Liquid Waste Management Industry Volume (Billion), by End-user Industry 2025 & 2033
- Figure 61: South America Liquid Waste Management Industry Revenue Share (%), by End-user Industry 2025 & 2033
- Figure 62: South America Liquid Waste Management Industry Volume Share (%), by End-user Industry 2025 & 2033
- Figure 63: South America Liquid Waste Management Industry Revenue (Million), by Country 2025 & 2033
- Figure 64: South America Liquid Waste Management Industry Volume (Billion), by Country 2025 & 2033
- Figure 65: South America Liquid Waste Management Industry Revenue Share (%), by Country 2025 & 2033
- Figure 66: South America Liquid Waste Management Industry Volume Share (%), by Country 2025 & 2033
- Figure 67: Middle East and Africa Liquid Waste Management Industry Revenue (Million), by Source 2025 & 2033
- Figure 68: Middle East and Africa Liquid Waste Management Industry Volume (Billion), by Source 2025 & 2033
- Figure 69: Middle East and Africa Liquid Waste Management Industry Revenue Share (%), by Source 2025 & 2033
- Figure 70: Middle East and Africa Liquid Waste Management Industry Volume Share (%), by Source 2025 & 2033
- Figure 71: Middle East and Africa Liquid Waste Management Industry Revenue (Million), by Service 2025 & 2033
- Figure 72: Middle East and Africa Liquid Waste Management Industry Volume (Billion), by Service 2025 & 2033
- Figure 73: Middle East and Africa Liquid Waste Management Industry Revenue Share (%), by Service 2025 & 2033
- Figure 74: Middle East and Africa Liquid Waste Management Industry Volume Share (%), by Service 2025 & 2033
- Figure 75: Middle East and Africa Liquid Waste Management Industry Revenue (Million), by End-user Industry 2025 & 2033
- Figure 76: Middle East and Africa Liquid Waste Management Industry Volume (Billion), by End-user Industry 2025 & 2033
- Figure 77: Middle East and Africa Liquid Waste Management Industry Revenue Share (%), by End-user Industry 2025 & 2033
- Figure 78: Middle East and Africa Liquid Waste Management Industry Volume Share (%), by End-user Industry 2025 & 2033
- Figure 79: Middle East and Africa Liquid Waste Management Industry Revenue (Million), by Country 2025 & 2033
- Figure 80: Middle East and Africa Liquid Waste Management Industry Volume (Billion), by Country 2025 & 2033
- Figure 81: Middle East and Africa Liquid Waste Management Industry Revenue Share (%), by Country 2025 & 2033
- Figure 82: Middle East and Africa Liquid Waste Management Industry Volume Share (%), by Country 2025 & 2033
List of Tables
- Table 1: Global Liquid Waste Management Industry Revenue Million Forecast, by Source 2020 & 2033
- Table 2: Global Liquid Waste Management Industry Volume Billion Forecast, by Source 2020 & 2033
- Table 3: Global Liquid Waste Management Industry Revenue Million Forecast, by Service 2020 & 2033
- Table 4: Global Liquid Waste Management Industry Volume Billion Forecast, by Service 2020 & 2033
- Table 5: Global Liquid Waste Management Industry Revenue Million Forecast, by End-user Industry 2020 & 2033
- Table 6: Global Liquid Waste Management Industry Volume Billion Forecast, by End-user Industry 2020 & 2033
- Table 7: Global Liquid Waste Management Industry Revenue Million Forecast, by Region 2020 & 2033
- Table 8: Global Liquid Waste Management Industry Volume Billion Forecast, by Region 2020 & 2033
- Table 9: Global Liquid Waste Management Industry Revenue Million Forecast, by Source 2020 & 2033
- Table 10: Global Liquid Waste Management Industry Volume Billion Forecast, by Source 2020 & 2033
- Table 11: Global Liquid Waste Management Industry Revenue Million Forecast, by Service 2020 & 2033
- Table 12: Global Liquid Waste Management Industry Volume Billion Forecast, by Service 2020 & 2033
- Table 13: Global Liquid Waste Management Industry Revenue Million Forecast, by End-user Industry 2020 & 2033
- Table 14: Global Liquid Waste Management Industry Volume Billion Forecast, by End-user Industry 2020 & 2033
- Table 15: Global Liquid Waste Management Industry Revenue Million Forecast, by Country 2020 & 2033
- Table 16: Global Liquid Waste Management Industry Volume Billion Forecast, by Country 2020 & 2033
- Table 17: China Liquid Waste Management Industry Revenue (Million) Forecast, by Application 2020 & 2033
- Table 18: China Liquid Waste Management Industry Volume (Billion) Forecast, by Application 2020 & 2033
- Table 19: India Liquid Waste Management Industry Revenue (Million) Forecast, by Application 2020 & 2033
- Table 20: India Liquid Waste Management Industry Volume (Billion) Forecast, by Application 2020 & 2033
- Table 21: Japan Liquid Waste Management Industry Revenue (Million) Forecast, by Application 2020 & 2033
- Table 22: Japan Liquid Waste Management Industry Volume (Billion) Forecast, by Application 2020 & 2033
- Table 23: South Korea Liquid Waste Management Industry Revenue (Million) Forecast, by Application 2020 & 2033
- Table 24: South Korea Liquid Waste Management Industry Volume (Billion) Forecast, by Application 2020 & 2033
- Table 25: Rest of Asia Pacific Liquid Waste Management Industry Revenue (Million) Forecast, by Application 2020 & 2033
- Table 26: Rest of Asia Pacific Liquid Waste Management Industry Volume (Billion) Forecast, by Application 2020 & 2033
- Table 27: Global Liquid Waste Management Industry Revenue Million Forecast, by Source 2020 & 2033
- Table 28: Global Liquid Waste Management Industry Volume Billion Forecast, by Source 2020 & 2033
- Table 29: Global Liquid Waste Management Industry Revenue Million Forecast, by Service 2020 & 2033
- Table 30: Global Liquid Waste Management Industry Volume Billion Forecast, by Service 2020 & 2033
- Table 31: Global Liquid Waste Management Industry Revenue Million Forecast, by End-user Industry 2020 & 2033
- Table 32: Global Liquid Waste Management Industry Volume Billion Forecast, by End-user Industry 2020 & 2033
- Table 33: Global Liquid Waste Management Industry Revenue Million Forecast, by Country 2020 & 2033
- Table 34: Global Liquid Waste Management Industry Volume Billion Forecast, by Country 2020 & 2033
- Table 35: United States Liquid Waste Management Industry Revenue (Million) Forecast, by Application 2020 & 2033
- Table 36: United States Liquid Waste Management Industry Volume (Billion) Forecast, by Application 2020 & 2033
- Table 37: Canada Liquid Waste Management Industry Revenue (Million) Forecast, by Application 2020 & 2033
- Table 38: Canada Liquid Waste Management Industry Volume (Billion) Forecast, by Application 2020 & 2033
- Table 39: Mexico Liquid Waste Management Industry Revenue (Million) Forecast, by Application 2020 & 2033
- Table 40: Mexico Liquid Waste Management Industry Volume (Billion) Forecast, by Application 2020 & 2033
- Table 41: Global Liquid Waste Management Industry Revenue Million Forecast, by Source 2020 & 2033
- Table 42: Global Liquid Waste Management Industry Volume Billion Forecast, by Source 2020 & 2033
- Table 43: Global Liquid Waste Management Industry Revenue Million Forecast, by Service 2020 & 2033
- Table 44: Global Liquid Waste Management Industry Volume Billion Forecast, by Service 2020 & 2033
- Table 45: Global Liquid Waste Management Industry Revenue Million Forecast, by End-user Industry 2020 & 2033
- Table 46: Global Liquid Waste Management Industry Volume Billion Forecast, by End-user Industry 2020 & 2033
- Table 47: Global Liquid Waste Management Industry Revenue Million Forecast, by Country 2020 & 2033
- Table 48: Global Liquid Waste Management Industry Volume Billion Forecast, by Country 2020 & 2033
- Table 49: Germany Liquid Waste Management Industry Revenue (Million) Forecast, by Application 2020 & 2033
- Table 50: Germany Liquid Waste Management Industry Volume (Billion) Forecast, by Application 2020 & 2033
- Table 51: United Kingdom Liquid Waste Management Industry Revenue (Million) Forecast, by Application 2020 & 2033
- Table 52: United Kingdom Liquid Waste Management Industry Volume (Billion) Forecast, by Application 2020 & 2033
- Table 53: France Liquid Waste Management Industry Revenue (Million) Forecast, by Application 2020 & 2033
- Table 54: France Liquid Waste Management Industry Volume (Billion) Forecast, by Application 2020 & 2033
- Table 55: Italy Liquid Waste Management Industry Revenue (Million) Forecast, by Application 2020 & 2033
- Table 56: Italy Liquid Waste Management Industry Volume (Billion) Forecast, by Application 2020 & 2033
- Table 57: Rest of Europe Liquid Waste Management Industry Revenue (Million) Forecast, by Application 2020 & 2033
- Table 58: Rest of Europe Liquid Waste Management Industry Volume (Billion) Forecast, by Application 2020 & 2033
- Table 59: Global Liquid Waste Management Industry Revenue Million Forecast, by Source 2020 & 2033
- Table 60: Global Liquid Waste Management Industry Volume Billion Forecast, by Source 2020 & 2033
- Table 61: Global Liquid Waste Management Industry Revenue Million Forecast, by Service 2020 & 2033
- Table 62: Global Liquid Waste Management Industry Volume Billion Forecast, by Service 2020 & 2033
- Table 63: Global Liquid Waste Management Industry Revenue Million Forecast, by End-user Industry 2020 & 2033
- Table 64: Global Liquid Waste Management Industry Volume Billion Forecast, by End-user Industry 2020 & 2033
- Table 65: Global Liquid Waste Management Industry Revenue Million Forecast, by Country 2020 & 2033
- Table 66: Global Liquid Waste Management Industry Volume Billion Forecast, by Country 2020 & 2033
- Table 67: Brazil Liquid Waste Management Industry Revenue (Million) Forecast, by Application 2020 & 2033
- Table 68: Brazil Liquid Waste Management Industry Volume (Billion) Forecast, by Application 2020 & 2033
- Table 69: Argentina Liquid Waste Management Industry Revenue (Million) Forecast, by Application 2020 & 2033
- Table 70: Argentina Liquid Waste Management Industry Volume (Billion) Forecast, by Application 2020 & 2033
- Table 71: Rest of South America Liquid Waste Management Industry Revenue (Million) Forecast, by Application 2020 & 2033
- Table 72: Rest of South America Liquid Waste Management Industry Volume (Billion) Forecast, by Application 2020 & 2033
- Table 73: Global Liquid Waste Management Industry Revenue Million Forecast, by Source 2020 & 2033
- Table 74: Global Liquid Waste Management Industry Volume Billion Forecast, by Source 2020 & 2033
- Table 75: Global Liquid Waste Management Industry Revenue Million Forecast, by Service 2020 & 2033
- Table 76: Global Liquid Waste Management Industry Volume Billion Forecast, by Service 2020 & 2033
- Table 77: Global Liquid Waste Management Industry Revenue Million Forecast, by End-user Industry 2020 & 2033
- Table 78: Global Liquid Waste Management Industry Volume Billion Forecast, by End-user Industry 2020 & 2033
- Table 79: Global Liquid Waste Management Industry Revenue Million Forecast, by Country 2020 & 2033
- Table 80: Global Liquid Waste Management Industry Volume Billion Forecast, by Country 2020 & 2033
- Table 81: Saudi Arabia Liquid Waste Management Industry Revenue (Million) Forecast, by Application 2020 & 2033
- Table 82: Saudi Arabia Liquid Waste Management Industry Volume (Billion) Forecast, by Application 2020 & 2033
- Table 83: South Africa Liquid Waste Management Industry Revenue (Million) Forecast, by Application 2020 & 2033
- Table 84: South Africa Liquid Waste Management Industry Volume (Billion) Forecast, by Application 2020 & 2033
- Table 85: Rest of Middle East and Africa Liquid Waste Management Industry Revenue (Million) Forecast, by Application 2020 & 2033
- Table 86: Rest of Middle East and Africa Liquid Waste Management Industry Volume (Billion) Forecast, by Application 2020 & 2033
Frequently Asked Questions
1. What is the projected Compound Annual Growth Rate (CAGR) of the Liquid Waste Management Industry?
The projected CAGR is approximately > 4.00%.
2. Which companies are prominent players in the Liquid Waste Management Industry?
Key companies in the market include CLEAN HARBORS INC, Cleanaway, Covanta Holding Corporation, Enva, GFL Environmental Inc, Hulsey (a Blue Flow Company), Ovivo, REMONDIS SE & Co KG, SUEZ, Veolia, WM Intellectual Property Holdings L L C *List Not Exhaustive.
3. What are the main segments of the Liquid Waste Management Industry?
The market segments include Source, Service, End-user Industry.
4. Can you provide details about the market size?
The market size is estimated to be USD 89.29 Million as of 2022.
5. What are some drivers contributing to market growth?
Growth in the Pharmaceutical and Healthcare Industry; Increased Manufacturing Activities Containing Toxic Chemicals Leading to Growing Liquid Effluent Management; Other Drivers.
6. What are the notable trends driving market growth?
Oil and Gas Segment to Dominate the Market.
7. Are there any restraints impacting market growth?
Growth in the Pharmaceutical and Healthcare Industry; Increased Manufacturing Activities Containing Toxic Chemicals Leading to Growing Liquid Effluent Management; Other Drivers.
8. Can you provide examples of recent developments in the market?
October 2023: SUEZ Recycling and Recovery UK completed the acquisition of Devon Contract Waste (DCW), a prominent recycling and waste management company. This strategic move is aimed at enhancing SUEZ's global position within the waste sector.
9. What pricing options are available for accessing the report?
Pricing options include single-user, multi-user, and enterprise licenses priced at USD 4750, USD 5250, and USD 8750 respectively.
10. Is the market size provided in terms of value or volume?
The market size is provided in terms of value, measured in Million and volume, measured in Billion.
11. Are there any specific market keywords associated with the report?
Yes, the market keyword associated with the report is "Liquid Waste Management Industry," which aids in identifying and referencing the specific market segment covered.
12. How do I determine which pricing option suits my needs best?
The pricing options vary based on user requirements and access needs. Individual users may opt for single-user licenses, while businesses requiring broader access may choose multi-user or enterprise licenses for cost-effective access to the report.
13. Are there any additional resources or data provided in the Liquid Waste Management Industry report?
While the report offers comprehensive insights, it's advisable to review the specific contents or supplementary materials provided to ascertain if additional resources or data are available.
14. How can I stay updated on further developments or reports in the Liquid Waste Management Industry?
To stay informed about further developments, trends, and reports in the Liquid Waste Management Industry, consider subscribing to industry newsletters, following relevant companies and organizations, or regularly checking reputable industry news sources and publications.
Methodology
Step 1 - Identification of Relevant Samples Size from Population Database


Step 2 - Approaches for Defining Global Market Size (Value, Volume* & Price*)

Note*: In applicable scenarios
Step 3 - Data Sources
Primary Research
- Web Analytics
- Survey Reports
- Research Institute
- Latest Research Reports
- Opinion Leaders
Secondary Research
- Annual Reports
- White Paper
- Latest Press Release
- Industry Association
- Paid Database
- Investor Presentations

Step 4 - Data Triangulation
Involves using different sources of information in order to increase the validity of a study
These sources are likely to be stakeholders in a program - participants, other researchers, program staff, other community members, and so on.
Then we put all data in single framework & apply various statistical tools to find out the dynamic on the market.
During the analysis stage, feedback from the stakeholder groups would be compared to determine areas of agreement as well as areas of divergence