

Key Insights
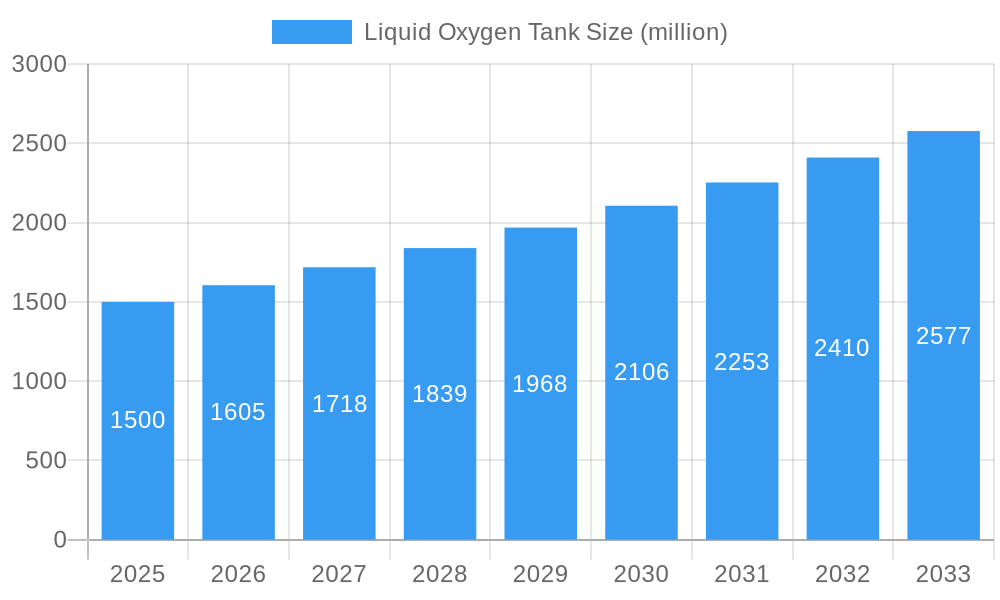
The global liquid oxygen tank market is experiencing robust growth, driven by increasing demand from healthcare, industrial, and aerospace sectors. The market's expansion is fueled by the rising prevalence of chronic respiratory diseases requiring oxygen therapy, the growth of industrial applications like metal fabrication and chemical processing, and the burgeoning space exploration initiatives. Technological advancements in tank design, such as the development of lightweight, high-capacity, and improved insulation technologies, are further contributing to market expansion. While regulatory compliance and stringent safety standards present challenges, the overall market outlook remains positive, with a projected Compound Annual Growth Rate (CAGR) of approximately 7% between 2025 and 2033. This growth is anticipated to be driven primarily by emerging economies in Asia-Pacific and Latin America, where healthcare infrastructure is rapidly developing and industrialization is accelerating.
Liquid Oxygen Tank Market Size (In Billion)
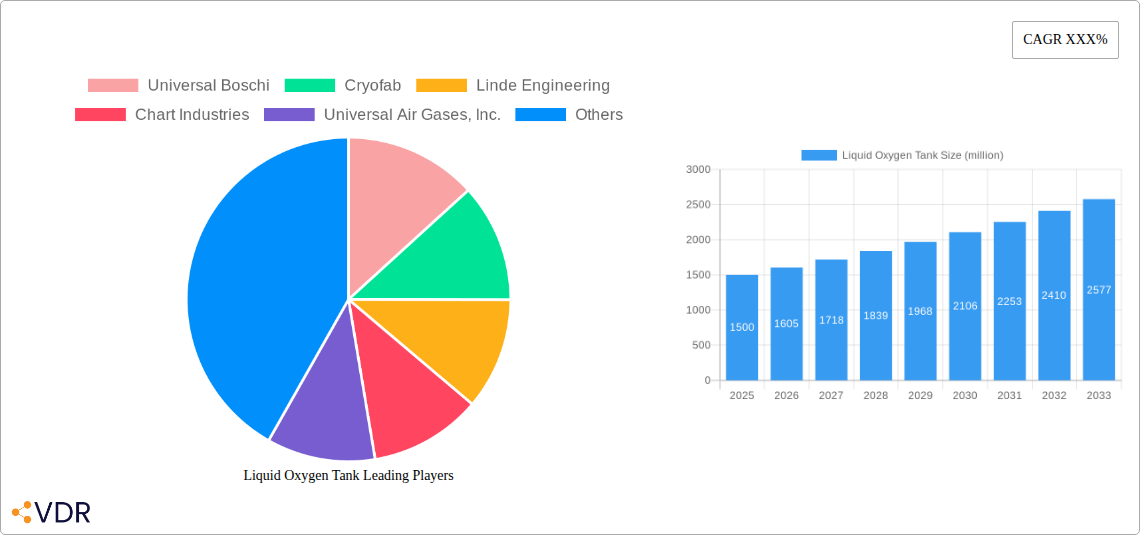
Competition in the liquid oxygen tank market is intense, with both established players and emerging companies vying for market share. Key players such as Universal Boschi, Linde Engineering, Chart Industries, and Taylor-Worton are leveraging their technological expertise and extensive distribution networks to maintain their dominance. However, several smaller companies, particularly in developing regions, are gaining traction by offering cost-effective solutions tailored to regional needs. Future market growth will likely be shaped by strategic partnerships, technological innovations focusing on improved efficiency and sustainability, and increasing focus on product customization to serve niche applications. The market is segmented by tank type, capacity, and end-user industry, offering various opportunities for companies to specialize and target specific customer segments.
Liquid Oxygen Tank Company Market Share
Liquid Oxygen Tank Market Report: 2019-2033
This comprehensive report provides an in-depth analysis of the global liquid oxygen tank market, covering market dynamics, growth trends, regional landscapes, and key players. The study period spans from 2019 to 2033, with a base year of 2025 and a forecast period from 2025 to 2033. This report is essential for industry professionals, investors, and anyone seeking a thorough understanding of this critical sector within the broader cryogenic equipment and industrial gas markets. The market size is expected to reach xx million units by 2033.
Liquid Oxygen Tank Market Dynamics & Structure
This section analyzes the competitive landscape, technological advancements, and regulatory influences shaping the liquid oxygen tank market. Market concentration is moderately high, with a few dominant players and numerous smaller regional manufacturers. Technological innovation focuses on improved insulation, enhanced safety features, and lightweight materials. Regulatory frameworks vary across regions, influencing design and safety standards. Substitute products, such as high-pressure gas cylinders, exist but offer limited advantages in terms of storage capacity and cost-effectiveness for large-scale applications. The end-user demographics encompass diverse sectors, including healthcare, industrial manufacturing, aerospace, and research. Mergers and acquisitions (M&A) activity in the past five years has been moderate, with approximately xx M&A deals recorded, primarily focusing on consolidation among smaller players.
- Market Concentration: Moderately high (xx% market share held by top 5 players)
- Technological Drivers: Improved insulation, lightweight materials, advanced safety systems.
- Regulatory Landscape: Varies by region, impacting design and safety standards.
- Competitive Substitutes: High-pressure gas cylinders.
- End-User Demographics: Healthcare, industrial manufacturing, aerospace, research.
- M&A Trends: Moderate activity (xx deals in 2019-2024), focusing on consolidation.
- Innovation Barriers: High R&D costs, stringent safety regulations.
Liquid Oxygen Tank Growth Trends & Insights
The global liquid oxygen tank market exhibited a CAGR of xx% during the historical period (2019-2024). Driven by increasing demand from healthcare, industrial, and aerospace sectors, the market is projected to maintain a steady growth trajectory, reaching xx million units by 2033 with a projected CAGR of xx% during the forecast period (2025-2033). This growth is fueled by technological advancements, expanding applications in emerging economies, and rising awareness of efficient cryogenic storage solutions. Market penetration remains relatively high in developed nations but offers significant growth potential in developing regions. Consumer behavior increasingly favors improved safety, ease of use, and cost-effectiveness.
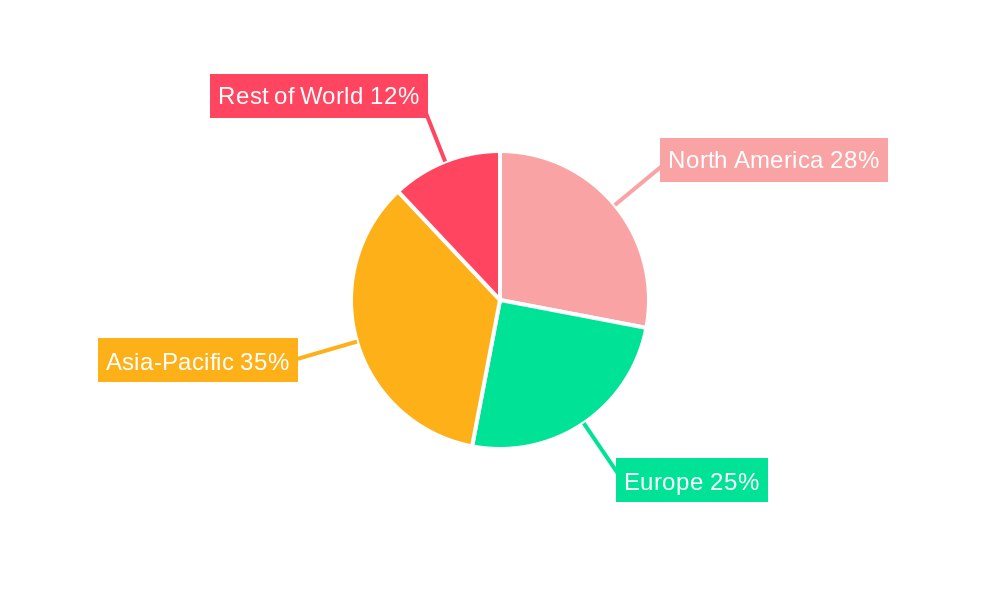
Dominant Regions, Countries, or Segments in Liquid Oxygen Tank
North America and Europe currently dominate the liquid oxygen tank market, accounting for xx% of the global market share in 2025. This dominance is attributed to well-established healthcare infrastructure, robust industrial sectors, and stringent safety regulations driving demand for advanced liquid oxygen storage solutions. However, Asia-Pacific is expected to witness the highest growth rate during the forecast period, driven by rapid industrialization, increasing healthcare spending, and government initiatives promoting technological advancements.
- North America: Established healthcare infrastructure, strong industrial base.
- Europe: Stringent regulations, high adoption of advanced technologies.
- Asia-Pacific: Rapid industrialization, rising healthcare spending.
- Other Regions: Growing demand, but with lower market penetration.
Liquid Oxygen Tank Product Landscape
Liquid oxygen tanks are available in various sizes and designs, ranging from small portable units for medical use to large-scale stationary tanks for industrial applications. Recent innovations focus on improved insulation materials (e.g., vacuum-insulated tanks), lightweight construction, and integrated safety systems (e.g., pressure relief valves, leak detection systems). These advancements enhance efficiency, reduce transportation costs, and improve safety. Unique selling propositions often include superior thermal performance, extended storage times, and reduced maintenance requirements.
Key Drivers, Barriers & Challenges in Liquid Oxygen Tank
Key Drivers:
- Growing healthcare sector and increasing demand for medical oxygen.
- Expansion of industrial applications requiring cryogenic storage.
- Technological advancements enhancing efficiency and safety.
- Government regulations promoting safe handling and storage of cryogenic liquids.
Challenges and Restraints:
- High initial investment costs associated with advanced tank designs.
- Stringent safety regulations and certifications.
- Fluctuations in raw material prices (e.g., stainless steel).
- Potential supply chain disruptions impacting manufacturing and delivery.
Emerging Opportunities in Liquid Oxygen Tank
- Expanding applications in emerging markets (e.g., Africa, South America).
- Development of innovative tank designs for specific applications (e.g., aerospace, LNG transportation).
- Integration of smart technologies for remote monitoring and control.
- Growing demand for sustainable and eco-friendly solutions.
Growth Accelerators in the Liquid Oxygen Tank Industry
Strategic partnerships and collaborations between tank manufacturers and end-users are driving market growth. Technological breakthroughs, particularly in materials science and insulation techniques, continue to enhance product performance and reduce operating costs. Expansion into new geographic markets and diversification into specialized applications (e.g., aerospace, LNG) also contribute to market expansion.
Key Players Shaping the Liquid Oxygen Tank Market
- Universal Boschi
- Cryofab
- Linde Engineering
- Chart Industries
- Universal Air Gases, Inc.
- Taylor-worton
- Wessington Cryogenics
- FIBA Technologies
- BNH Gas Tanks
- Super Cryogenic Systems Private Limited
- LUXI NEW ENERGY EQUIPMENT GROUP
- ERGIL
- ING. L. & A. Boschi Italy
Notable Milestones in Liquid Oxygen Tank Sector
- 2020: Introduction of a new lightweight liquid oxygen tank by Chart Industries.
- 2022: Acquisition of a smaller cryogenic tank manufacturer by Linde Engineering.
- 2023: Launch of a new vacuum-insulated liquid oxygen tank with enhanced safety features by Universal Boschi.
In-Depth Liquid Oxygen Tank Market Outlook
The liquid oxygen tank market is poised for continued growth, driven by technological innovation, expanding applications, and increased demand from various sectors. Strategic investments in research and development, strategic partnerships, and expansion into emerging markets will be crucial for companies to capture significant market share in the coming years. The market offers significant opportunities for companies that can provide innovative, efficient, and safe liquid oxygen storage solutions.
Liquid Oxygen Tank Segmentation
-
1. Application
- 1.1. Energy and Power
- 1.2. Chemicals
- 1.3. Metallurgy
- 1.4. Other
-
2. Type
- 2.1. Cylindrical Tank
- 2.2. Spherical Tank
Liquid Oxygen Tank Segmentation By Geography
-
1. North America
- 1.1. United States
- 1.2. Canada
- 1.3. Mexico
-
2. South America
- 2.1. Brazil
- 2.2. Argentina
- 2.3. Rest of South America
-
3. Europe
- 3.1. United Kingdom
- 3.2. Germany
- 3.3. France
- 3.4. Italy
- 3.5. Spain
- 3.6. Russia
- 3.7. Benelux
- 3.8. Nordics
- 3.9. Rest of Europe
-
4. Middle East & Africa
- 4.1. Turkey
- 4.2. Israel
- 4.3. GCC
- 4.4. North Africa
- 4.5. South Africa
- 4.6. Rest of Middle East & Africa
-
5. Asia Pacific
- 5.1. China
- 5.2. India
- 5.3. Japan
- 5.4. South Korea
- 5.5. ASEAN
- 5.6. Oceania
- 5.7. Rest of Asia Pacific
Liquid Oxygen Tank Regional Market Share
Geographic Coverage of Liquid Oxygen Tank
Liquid Oxygen Tank REPORT HIGHLIGHTS
| Aspects | Details |
|---|---|
| Study Period | 2020-2034 |
| Base Year | 2025 |
| Estimated Year | 2026 |
| Forecast Period | 2026-2034 |
| Historical Period | 2020-2025 |
| Growth Rate | CAGR of 12.5% from 2020-2034 |
| Segmentation |
|
Table of Contents
- 1. Introduction
- 1.1. Research Scope
- 1.2. Market Segmentation
- 1.3. Research Objective
- 1.4. Definitions and Assumptions
- 2. Executive Summary
- 2.1. Market Snapshot
- 3. Market Dynamics
- 3.1. Market Drivers
- 3.2. Market Restrains
- 3.3. Market Trends
- 3.4. Market Opportunities
- 4. Market Factor Analysis
- 4.1. Porters Five Forces
- 4.1.1. Bargaining Power of Suppliers
- 4.1.2. Bargaining Power of Buyers
- 4.1.3. Threat of New Entrants
- 4.1.4. Threat of Substitutes
- 4.1.5. Competitive Rivalry
- 4.2. PESTEL analysis
- 4.3. BCG Analysis
- 4.3.1. Stars (High Growth, High Market Share)
- 4.3.2. Cash Cows (Low Growth, High Market Share)
- 4.3.3. Question Mark (High Growth, Low Market Share)
- 4.3.4. Dogs (Low Growth, Low Market Share)
- 4.4. Ansoff Matrix Analysis
- 4.5. Supply Chain Analysis
- 4.6. Regulatory Landscape
- 4.7. Current Market Potential and Opportunity Assessment (TAM–SAM–SOM Framework)
- 4.8. VDR Analyst Note
- 4.1. Porters Five Forces
- 5. Market Analysis, Insights and Forecast 2021-2033
- 5.1. Market Analysis, Insights and Forecast - by Application
- 5.1.1. Energy and Power
- 5.1.2. Chemicals
- 5.1.3. Metallurgy
- 5.1.4. Other
- 5.2. Market Analysis, Insights and Forecast - by Type
- 5.2.1. Cylindrical Tank
- 5.2.2. Spherical Tank
- 5.3. Market Analysis, Insights and Forecast - by Region
- 5.3.1. North America
- 5.3.2. South America
- 5.3.3. Europe
- 5.3.4. Middle East & Africa
- 5.3.5. Asia Pacific
- 5.1. Market Analysis, Insights and Forecast - by Application
- 6. Global Liquid Oxygen Tank Analysis, Insights and Forecast, 2021-2033
- 6.1. Market Analysis, Insights and Forecast - by Application
- 6.1.1. Energy and Power
- 6.1.2. Chemicals
- 6.1.3. Metallurgy
- 6.1.4. Other
- 6.2. Market Analysis, Insights and Forecast - by Type
- 6.2.1. Cylindrical Tank
- 6.2.2. Spherical Tank
- 6.1. Market Analysis, Insights and Forecast - by Application
- 7. North America Liquid Oxygen Tank Analysis, Insights and Forecast, 2021-2033
- 7.1. Market Analysis, Insights and Forecast - by Application
- 7.1.1. Energy and Power
- 7.1.2. Chemicals
- 7.1.3. Metallurgy
- 7.1.4. Other
- 7.2. Market Analysis, Insights and Forecast - by Type
- 7.2.1. Cylindrical Tank
- 7.2.2. Spherical Tank
- 7.1. Market Analysis, Insights and Forecast - by Application
- 8. South America Liquid Oxygen Tank Analysis, Insights and Forecast, 2021-2033
- 8.1. Market Analysis, Insights and Forecast - by Application
- 8.1.1. Energy and Power
- 8.1.2. Chemicals
- 8.1.3. Metallurgy
- 8.1.4. Other
- 8.2. Market Analysis, Insights and Forecast - by Type
- 8.2.1. Cylindrical Tank
- 8.2.2. Spherical Tank
- 8.1. Market Analysis, Insights and Forecast - by Application
- 9. Europe Liquid Oxygen Tank Analysis, Insights and Forecast, 2021-2033
- 9.1. Market Analysis, Insights and Forecast - by Application
- 9.1.1. Energy and Power
- 9.1.2. Chemicals
- 9.1.3. Metallurgy
- 9.1.4. Other
- 9.2. Market Analysis, Insights and Forecast - by Type
- 9.2.1. Cylindrical Tank
- 9.2.2. Spherical Tank
- 9.1. Market Analysis, Insights and Forecast - by Application
- 10. Middle East & Africa Liquid Oxygen Tank Analysis, Insights and Forecast, 2021-2033
- 10.1. Market Analysis, Insights and Forecast - by Application
- 10.1.1. Energy and Power
- 10.1.2. Chemicals
- 10.1.3. Metallurgy
- 10.1.4. Other
- 10.2. Market Analysis, Insights and Forecast - by Type
- 10.2.1. Cylindrical Tank
- 10.2.2. Spherical Tank
- 10.1. Market Analysis, Insights and Forecast - by Application
- 11. Asia Pacific Liquid Oxygen Tank Analysis, Insights and Forecast, 2021-2033
- 11.1. Market Analysis, Insights and Forecast - by Application
- 11.1.1. Energy and Power
- 11.1.2. Chemicals
- 11.1.3. Metallurgy
- 11.1.4. Other
- 11.2. Market Analysis, Insights and Forecast - by Type
- 11.2.1. Cylindrical Tank
- 11.2.2. Spherical Tank
- 11.1. Market Analysis, Insights and Forecast - by Application
- 12. Competitive Analysis
- 12.1. Company Profiles
- 12.1.1 Universal Boschi
- 12.1.1.1. Company Overview
- 12.1.1.2. Products
- 12.1.1.3. Company Financials
- 12.1.1.4. SWOT Analysis
- 12.1.2 Cryofab
- 12.1.2.1. Company Overview
- 12.1.2.2. Products
- 12.1.2.3. Company Financials
- 12.1.2.4. SWOT Analysis
- 12.1.3 Linde Engineering
- 12.1.3.1. Company Overview
- 12.1.3.2. Products
- 12.1.3.3. Company Financials
- 12.1.3.4. SWOT Analysis
- 12.1.4 Chart Industries
- 12.1.4.1. Company Overview
- 12.1.4.2. Products
- 12.1.4.3. Company Financials
- 12.1.4.4. SWOT Analysis
- 12.1.5 Universal Air Gases Inc.
- 12.1.5.1. Company Overview
- 12.1.5.2. Products
- 12.1.5.3. Company Financials
- 12.1.5.4. SWOT Analysis
- 12.1.6 Taylor-worton
- 12.1.6.1. Company Overview
- 12.1.6.2. Products
- 12.1.6.3. Company Financials
- 12.1.6.4. SWOT Analysis
- 12.1.7 Wessington Cryogenics
- 12.1.7.1. Company Overview
- 12.1.7.2. Products
- 12.1.7.3. Company Financials
- 12.1.7.4. SWOT Analysis
- 12.1.8 FIBA Technologies
- 12.1.8.1. Company Overview
- 12.1.8.2. Products
- 12.1.8.3. Company Financials
- 12.1.8.4. SWOT Analysis
- 12.1.9 BNH Gas Tanks
- 12.1.9.1. Company Overview
- 12.1.9.2. Products
- 12.1.9.3. Company Financials
- 12.1.9.4. SWOT Analysis
- 12.1.10 Super Cryogenic Systems Private Limited
- 12.1.10.1. Company Overview
- 12.1.10.2. Products
- 12.1.10.3. Company Financials
- 12.1.10.4. SWOT Analysis
- 12.1.11 LUXI NEW ENERGY EQUIPMENT GROUP
- 12.1.11.1. Company Overview
- 12.1.11.2. Products
- 12.1.11.3. Company Financials
- 12.1.11.4. SWOT Analysis
- 12.1.12 ERGIL
- 12.1.12.1. Company Overview
- 12.1.12.2. Products
- 12.1.12.3. Company Financials
- 12.1.12.4. SWOT Analysis
- 12.1.13 ING. L. & A. Boschi Italy
- 12.1.13.1. Company Overview
- 12.1.13.2. Products
- 12.1.13.3. Company Financials
- 12.1.13.4. SWOT Analysis
- 12.1.1 Universal Boschi
- 12.2. Market Entropy
- 12.2.1 Company's Key Areas Served
- 12.2.2 Recent Developments
- 12.3. Company Market Share Analysis 2025
- 12.3.1 Top 5 Companies Market Share Analysis
- 12.3.2 Top 3 Companies Market Share Analysis
- 12.4. List of Potential Customers
- 13. Research Methodology
List of Figures
- Figure 1: Global Liquid Oxygen Tank Revenue Breakdown (billion, %) by Region 2025 & 2033
- Figure 2: Global Liquid Oxygen Tank Volume Breakdown (K, %) by Region 2025 & 2033
- Figure 3: North America Liquid Oxygen Tank Revenue (billion), by Application 2025 & 2033
- Figure 4: North America Liquid Oxygen Tank Volume (K), by Application 2025 & 2033
- Figure 5: North America Liquid Oxygen Tank Revenue Share (%), by Application 2025 & 2033
- Figure 6: North America Liquid Oxygen Tank Volume Share (%), by Application 2025 & 2033
- Figure 7: North America Liquid Oxygen Tank Revenue (billion), by Type 2025 & 2033
- Figure 8: North America Liquid Oxygen Tank Volume (K), by Type 2025 & 2033
- Figure 9: North America Liquid Oxygen Tank Revenue Share (%), by Type 2025 & 2033
- Figure 10: North America Liquid Oxygen Tank Volume Share (%), by Type 2025 & 2033
- Figure 11: North America Liquid Oxygen Tank Revenue (billion), by Country 2025 & 2033
- Figure 12: North America Liquid Oxygen Tank Volume (K), by Country 2025 & 2033
- Figure 13: North America Liquid Oxygen Tank Revenue Share (%), by Country 2025 & 2033
- Figure 14: North America Liquid Oxygen Tank Volume Share (%), by Country 2025 & 2033
- Figure 15: South America Liquid Oxygen Tank Revenue (billion), by Application 2025 & 2033
- Figure 16: South America Liquid Oxygen Tank Volume (K), by Application 2025 & 2033
- Figure 17: South America Liquid Oxygen Tank Revenue Share (%), by Application 2025 & 2033
- Figure 18: South America Liquid Oxygen Tank Volume Share (%), by Application 2025 & 2033
- Figure 19: South America Liquid Oxygen Tank Revenue (billion), by Type 2025 & 2033
- Figure 20: South America Liquid Oxygen Tank Volume (K), by Type 2025 & 2033
- Figure 21: South America Liquid Oxygen Tank Revenue Share (%), by Type 2025 & 2033
- Figure 22: South America Liquid Oxygen Tank Volume Share (%), by Type 2025 & 2033
- Figure 23: South America Liquid Oxygen Tank Revenue (billion), by Country 2025 & 2033
- Figure 24: South America Liquid Oxygen Tank Volume (K), by Country 2025 & 2033
- Figure 25: South America Liquid Oxygen Tank Revenue Share (%), by Country 2025 & 2033
- Figure 26: South America Liquid Oxygen Tank Volume Share (%), by Country 2025 & 2033
- Figure 27: Europe Liquid Oxygen Tank Revenue (billion), by Application 2025 & 2033
- Figure 28: Europe Liquid Oxygen Tank Volume (K), by Application 2025 & 2033
- Figure 29: Europe Liquid Oxygen Tank Revenue Share (%), by Application 2025 & 2033
- Figure 30: Europe Liquid Oxygen Tank Volume Share (%), by Application 2025 & 2033
- Figure 31: Europe Liquid Oxygen Tank Revenue (billion), by Type 2025 & 2033
- Figure 32: Europe Liquid Oxygen Tank Volume (K), by Type 2025 & 2033
- Figure 33: Europe Liquid Oxygen Tank Revenue Share (%), by Type 2025 & 2033
- Figure 34: Europe Liquid Oxygen Tank Volume Share (%), by Type 2025 & 2033
- Figure 35: Europe Liquid Oxygen Tank Revenue (billion), by Country 2025 & 2033
- Figure 36: Europe Liquid Oxygen Tank Volume (K), by Country 2025 & 2033
- Figure 37: Europe Liquid Oxygen Tank Revenue Share (%), by Country 2025 & 2033
- Figure 38: Europe Liquid Oxygen Tank Volume Share (%), by Country 2025 & 2033
- Figure 39: Middle East & Africa Liquid Oxygen Tank Revenue (billion), by Application 2025 & 2033
- Figure 40: Middle East & Africa Liquid Oxygen Tank Volume (K), by Application 2025 & 2033
- Figure 41: Middle East & Africa Liquid Oxygen Tank Revenue Share (%), by Application 2025 & 2033
- Figure 42: Middle East & Africa Liquid Oxygen Tank Volume Share (%), by Application 2025 & 2033
- Figure 43: Middle East & Africa Liquid Oxygen Tank Revenue (billion), by Type 2025 & 2033
- Figure 44: Middle East & Africa Liquid Oxygen Tank Volume (K), by Type 2025 & 2033
- Figure 45: Middle East & Africa Liquid Oxygen Tank Revenue Share (%), by Type 2025 & 2033
- Figure 46: Middle East & Africa Liquid Oxygen Tank Volume Share (%), by Type 2025 & 2033
- Figure 47: Middle East & Africa Liquid Oxygen Tank Revenue (billion), by Country 2025 & 2033
- Figure 48: Middle East & Africa Liquid Oxygen Tank Volume (K), by Country 2025 & 2033
- Figure 49: Middle East & Africa Liquid Oxygen Tank Revenue Share (%), by Country 2025 & 2033
- Figure 50: Middle East & Africa Liquid Oxygen Tank Volume Share (%), by Country 2025 & 2033
- Figure 51: Asia Pacific Liquid Oxygen Tank Revenue (billion), by Application 2025 & 2033
- Figure 52: Asia Pacific Liquid Oxygen Tank Volume (K), by Application 2025 & 2033
- Figure 53: Asia Pacific Liquid Oxygen Tank Revenue Share (%), by Application 2025 & 2033
- Figure 54: Asia Pacific Liquid Oxygen Tank Volume Share (%), by Application 2025 & 2033
- Figure 55: Asia Pacific Liquid Oxygen Tank Revenue (billion), by Type 2025 & 2033
- Figure 56: Asia Pacific Liquid Oxygen Tank Volume (K), by Type 2025 & 2033
- Figure 57: Asia Pacific Liquid Oxygen Tank Revenue Share (%), by Type 2025 & 2033
- Figure 58: Asia Pacific Liquid Oxygen Tank Volume Share (%), by Type 2025 & 2033
- Figure 59: Asia Pacific Liquid Oxygen Tank Revenue (billion), by Country 2025 & 2033
- Figure 60: Asia Pacific Liquid Oxygen Tank Volume (K), by Country 2025 & 2033
- Figure 61: Asia Pacific Liquid Oxygen Tank Revenue Share (%), by Country 2025 & 2033
- Figure 62: Asia Pacific Liquid Oxygen Tank Volume Share (%), by Country 2025 & 2033
List of Tables
- Table 1: Global Liquid Oxygen Tank Revenue billion Forecast, by Application 2020 & 2033
- Table 2: Global Liquid Oxygen Tank Volume K Forecast, by Application 2020 & 2033
- Table 3: Global Liquid Oxygen Tank Revenue billion Forecast, by Type 2020 & 2033
- Table 4: Global Liquid Oxygen Tank Volume K Forecast, by Type 2020 & 2033
- Table 5: Global Liquid Oxygen Tank Revenue billion Forecast, by Region 2020 & 2033
- Table 6: Global Liquid Oxygen Tank Volume K Forecast, by Region 2020 & 2033
- Table 7: Global Liquid Oxygen Tank Revenue billion Forecast, by Application 2020 & 2033
- Table 8: Global Liquid Oxygen Tank Volume K Forecast, by Application 2020 & 2033
- Table 9: Global Liquid Oxygen Tank Revenue billion Forecast, by Type 2020 & 2033
- Table 10: Global Liquid Oxygen Tank Volume K Forecast, by Type 2020 & 2033
- Table 11: Global Liquid Oxygen Tank Revenue billion Forecast, by Country 2020 & 2033
- Table 12: Global Liquid Oxygen Tank Volume K Forecast, by Country 2020 & 2033
- Table 13: United States Liquid Oxygen Tank Revenue (billion) Forecast, by Application 2020 & 2033
- Table 14: United States Liquid Oxygen Tank Volume (K) Forecast, by Application 2020 & 2033
- Table 15: Canada Liquid Oxygen Tank Revenue (billion) Forecast, by Application 2020 & 2033
- Table 16: Canada Liquid Oxygen Tank Volume (K) Forecast, by Application 2020 & 2033
- Table 17: Mexico Liquid Oxygen Tank Revenue (billion) Forecast, by Application 2020 & 2033
- Table 18: Mexico Liquid Oxygen Tank Volume (K) Forecast, by Application 2020 & 2033
- Table 19: Global Liquid Oxygen Tank Revenue billion Forecast, by Application 2020 & 2033
- Table 20: Global Liquid Oxygen Tank Volume K Forecast, by Application 2020 & 2033
- Table 21: Global Liquid Oxygen Tank Revenue billion Forecast, by Type 2020 & 2033
- Table 22: Global Liquid Oxygen Tank Volume K Forecast, by Type 2020 & 2033
- Table 23: Global Liquid Oxygen Tank Revenue billion Forecast, by Country 2020 & 2033
- Table 24: Global Liquid Oxygen Tank Volume K Forecast, by Country 2020 & 2033
- Table 25: Brazil Liquid Oxygen Tank Revenue (billion) Forecast, by Application 2020 & 2033
- Table 26: Brazil Liquid Oxygen Tank Volume (K) Forecast, by Application 2020 & 2033
- Table 27: Argentina Liquid Oxygen Tank Revenue (billion) Forecast, by Application 2020 & 2033
- Table 28: Argentina Liquid Oxygen Tank Volume (K) Forecast, by Application 2020 & 2033
- Table 29: Rest of South America Liquid Oxygen Tank Revenue (billion) Forecast, by Application 2020 & 2033
- Table 30: Rest of South America Liquid Oxygen Tank Volume (K) Forecast, by Application 2020 & 2033
- Table 31: Global Liquid Oxygen Tank Revenue billion Forecast, by Application 2020 & 2033
- Table 32: Global Liquid Oxygen Tank Volume K Forecast, by Application 2020 & 2033
- Table 33: Global Liquid Oxygen Tank Revenue billion Forecast, by Type 2020 & 2033
- Table 34: Global Liquid Oxygen Tank Volume K Forecast, by Type 2020 & 2033
- Table 35: Global Liquid Oxygen Tank Revenue billion Forecast, by Country 2020 & 2033
- Table 36: Global Liquid Oxygen Tank Volume K Forecast, by Country 2020 & 2033
- Table 37: United Kingdom Liquid Oxygen Tank Revenue (billion) Forecast, by Application 2020 & 2033
- Table 38: United Kingdom Liquid Oxygen Tank Volume (K) Forecast, by Application 2020 & 2033
- Table 39: Germany Liquid Oxygen Tank Revenue (billion) Forecast, by Application 2020 & 2033
- Table 40: Germany Liquid Oxygen Tank Volume (K) Forecast, by Application 2020 & 2033
- Table 41: France Liquid Oxygen Tank Revenue (billion) Forecast, by Application 2020 & 2033
- Table 42: France Liquid Oxygen Tank Volume (K) Forecast, by Application 2020 & 2033
- Table 43: Italy Liquid Oxygen Tank Revenue (billion) Forecast, by Application 2020 & 2033
- Table 44: Italy Liquid Oxygen Tank Volume (K) Forecast, by Application 2020 & 2033
- Table 45: Spain Liquid Oxygen Tank Revenue (billion) Forecast, by Application 2020 & 2033
- Table 46: Spain Liquid Oxygen Tank Volume (K) Forecast, by Application 2020 & 2033
- Table 47: Russia Liquid Oxygen Tank Revenue (billion) Forecast, by Application 2020 & 2033
- Table 48: Russia Liquid Oxygen Tank Volume (K) Forecast, by Application 2020 & 2033
- Table 49: Benelux Liquid Oxygen Tank Revenue (billion) Forecast, by Application 2020 & 2033
- Table 50: Benelux Liquid Oxygen Tank Volume (K) Forecast, by Application 2020 & 2033
- Table 51: Nordics Liquid Oxygen Tank Revenue (billion) Forecast, by Application 2020 & 2033
- Table 52: Nordics Liquid Oxygen Tank Volume (K) Forecast, by Application 2020 & 2033
- Table 53: Rest of Europe Liquid Oxygen Tank Revenue (billion) Forecast, by Application 2020 & 2033
- Table 54: Rest of Europe Liquid Oxygen Tank Volume (K) Forecast, by Application 2020 & 2033
- Table 55: Global Liquid Oxygen Tank Revenue billion Forecast, by Application 2020 & 2033
- Table 56: Global Liquid Oxygen Tank Volume K Forecast, by Application 2020 & 2033
- Table 57: Global Liquid Oxygen Tank Revenue billion Forecast, by Type 2020 & 2033
- Table 58: Global Liquid Oxygen Tank Volume K Forecast, by Type 2020 & 2033
- Table 59: Global Liquid Oxygen Tank Revenue billion Forecast, by Country 2020 & 2033
- Table 60: Global Liquid Oxygen Tank Volume K Forecast, by Country 2020 & 2033
- Table 61: Turkey Liquid Oxygen Tank Revenue (billion) Forecast, by Application 2020 & 2033
- Table 62: Turkey Liquid Oxygen Tank Volume (K) Forecast, by Application 2020 & 2033
- Table 63: Israel Liquid Oxygen Tank Revenue (billion) Forecast, by Application 2020 & 2033
- Table 64: Israel Liquid Oxygen Tank Volume (K) Forecast, by Application 2020 & 2033
- Table 65: GCC Liquid Oxygen Tank Revenue (billion) Forecast, by Application 2020 & 2033
- Table 66: GCC Liquid Oxygen Tank Volume (K) Forecast, by Application 2020 & 2033
- Table 67: North Africa Liquid Oxygen Tank Revenue (billion) Forecast, by Application 2020 & 2033
- Table 68: North Africa Liquid Oxygen Tank Volume (K) Forecast, by Application 2020 & 2033
- Table 69: South Africa Liquid Oxygen Tank Revenue (billion) Forecast, by Application 2020 & 2033
- Table 70: South Africa Liquid Oxygen Tank Volume (K) Forecast, by Application 2020 & 2033
- Table 71: Rest of Middle East & Africa Liquid Oxygen Tank Revenue (billion) Forecast, by Application 2020 & 2033
- Table 72: Rest of Middle East & Africa Liquid Oxygen Tank Volume (K) Forecast, by Application 2020 & 2033
- Table 73: Global Liquid Oxygen Tank Revenue billion Forecast, by Application 2020 & 2033
- Table 74: Global Liquid Oxygen Tank Volume K Forecast, by Application 2020 & 2033
- Table 75: Global Liquid Oxygen Tank Revenue billion Forecast, by Type 2020 & 2033
- Table 76: Global Liquid Oxygen Tank Volume K Forecast, by Type 2020 & 2033
- Table 77: Global Liquid Oxygen Tank Revenue billion Forecast, by Country 2020 & 2033
- Table 78: Global Liquid Oxygen Tank Volume K Forecast, by Country 2020 & 2033
- Table 79: China Liquid Oxygen Tank Revenue (billion) Forecast, by Application 2020 & 2033
- Table 80: China Liquid Oxygen Tank Volume (K) Forecast, by Application 2020 & 2033
- Table 81: India Liquid Oxygen Tank Revenue (billion) Forecast, by Application 2020 & 2033
- Table 82: India Liquid Oxygen Tank Volume (K) Forecast, by Application 2020 & 2033
- Table 83: Japan Liquid Oxygen Tank Revenue (billion) Forecast, by Application 2020 & 2033
- Table 84: Japan Liquid Oxygen Tank Volume (K) Forecast, by Application 2020 & 2033
- Table 85: South Korea Liquid Oxygen Tank Revenue (billion) Forecast, by Application 2020 & 2033
- Table 86: South Korea Liquid Oxygen Tank Volume (K) Forecast, by Application 2020 & 2033
- Table 87: ASEAN Liquid Oxygen Tank Revenue (billion) Forecast, by Application 2020 & 2033
- Table 88: ASEAN Liquid Oxygen Tank Volume (K) Forecast, by Application 2020 & 2033
- Table 89: Oceania Liquid Oxygen Tank Revenue (billion) Forecast, by Application 2020 & 2033
- Table 90: Oceania Liquid Oxygen Tank Volume (K) Forecast, by Application 2020 & 2033
- Table 91: Rest of Asia Pacific Liquid Oxygen Tank Revenue (billion) Forecast, by Application 2020 & 2033
- Table 92: Rest of Asia Pacific Liquid Oxygen Tank Volume (K) Forecast, by Application 2020 & 2033
Frequently Asked Questions
1. What is the projected Compound Annual Growth Rate (CAGR) of the Liquid Oxygen Tank?
The projected CAGR is approximately 12.5%.
2. Which companies are prominent players in the Liquid Oxygen Tank?
Key companies in the market include Universal Boschi, Cryofab, Linde Engineering, Chart Industries, Universal Air Gases, Inc., Taylor-worton, Wessington Cryogenics, FIBA Technologies, BNH Gas Tanks, Super Cryogenic Systems Private Limited, LUXI NEW ENERGY EQUIPMENT GROUP, ERGIL, ING. L. & A. Boschi Italy.
3. What are the main segments of the Liquid Oxygen Tank?
The market segments include Application, Type.
4. Can you provide details about the market size?
The market size is estimated to be USD 47.97 billion as of 2022.
5. What are some drivers contributing to market growth?
N/A
6. What are the notable trends driving market growth?
N/A
7. Are there any restraints impacting market growth?
N/A
8. Can you provide examples of recent developments in the market?
N/A
9. What pricing options are available for accessing the report?
Pricing options include single-user, multi-user, and enterprise licenses priced at USD 3950.00, USD 5925.00, and USD 7900.00 respectively.
10. Is the market size provided in terms of value or volume?
The market size is provided in terms of value, measured in billion and volume, measured in K.
11. Are there any specific market keywords associated with the report?
Yes, the market keyword associated with the report is "Liquid Oxygen Tank," which aids in identifying and referencing the specific market segment covered.
12. How do I determine which pricing option suits my needs best?
The pricing options vary based on user requirements and access needs. Individual users may opt for single-user licenses, while businesses requiring broader access may choose multi-user or enterprise licenses for cost-effective access to the report.
13. Are there any additional resources or data provided in the Liquid Oxygen Tank report?
While the report offers comprehensive insights, it's advisable to review the specific contents or supplementary materials provided to ascertain if additional resources or data are available.
14. How can I stay updated on further developments or reports in the Liquid Oxygen Tank?
To stay informed about further developments, trends, and reports in the Liquid Oxygen Tank, consider subscribing to industry newsletters, following relevant companies and organizations, or regularly checking reputable industry news sources and publications.
Methodology
Step 1 - Identification of Relevant Samples Size from Population Database


Step 2 - Approaches for Defining Global Market Size (Value, Volume* & Price*)

Note*: In applicable scenarios
Step 3 - Data Sources
Primary Research
- Web Analytics
- Survey Reports
- Research Institute
- Latest Research Reports
- Opinion Leaders
Secondary Research
- Annual Reports
- White Paper
- Latest Press Release
- Industry Association
- Paid Database
- Investor Presentations

Step 4 - Data Triangulation
Involves using different sources of information in order to increase the validity of a study
These sources are likely to be stakeholders in a program - participants, other researchers, program staff, other community members, and so on.
Then we put all data in single framework & apply various statistical tools to find out the dynamic on the market.
During the analysis stage, feedback from the stakeholder groups would be compared to determine areas of agreement as well as areas of divergence