

Key Insights
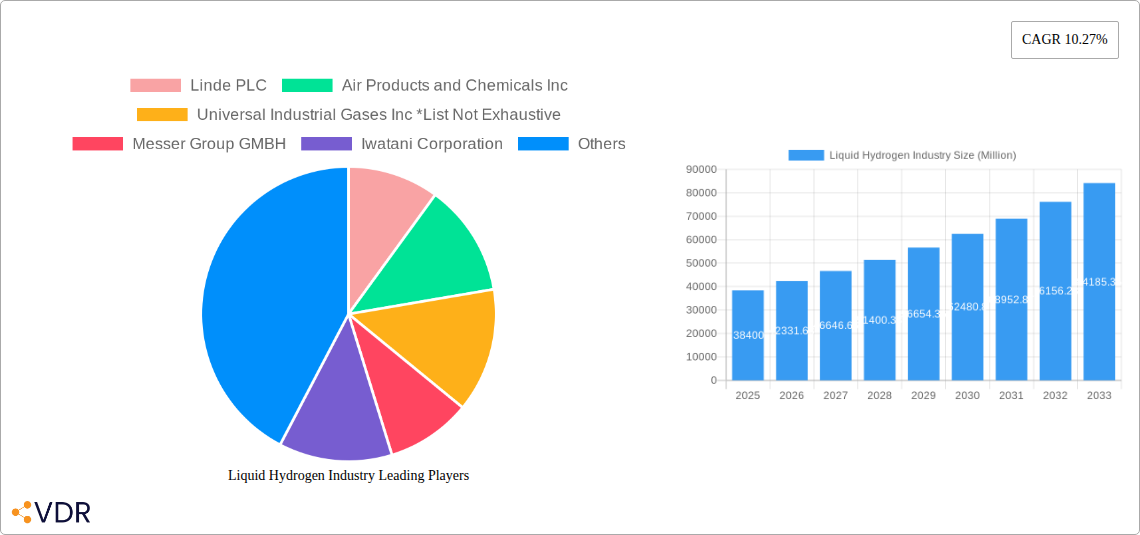
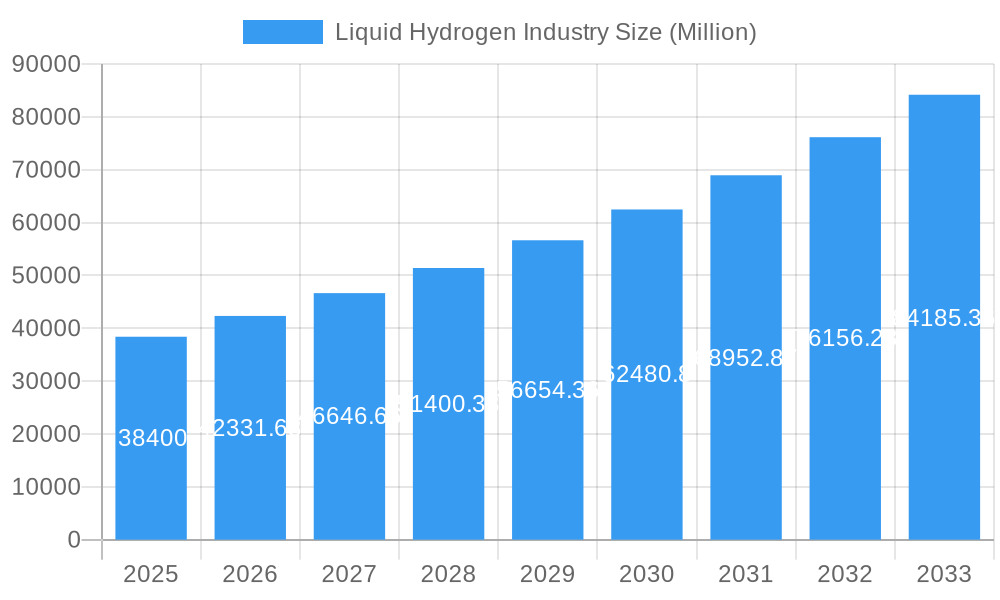
The liquid hydrogen market, valued at $38.4 billion in 2025, is projected to experience robust growth, driven by the increasing demand for clean energy solutions and the expansion of hydrogen-powered vehicles. A compound annual growth rate (CAGR) of 10.27% from 2025 to 2033 indicates a significant market expansion, reaching an estimated value exceeding $100 billion by 2033. This growth is fueled by several key factors. The automotive sector is a major driver, with increased investments in fuel cell electric vehicles (FCEVs) and the development of associated infrastructure. The aerospace and marine industries are also contributing significantly, exploring liquid hydrogen as a sustainable fuel source for space exploration and shipping, respectively. Furthermore, advancements in cryogenic storage and transportation technologies, such as improved cryogenic tanks and high-pressure tube trailers, are facilitating easier and safer handling of liquid hydrogen, further accelerating market growth. However, challenges remain, including the high cost of production and distribution, along with the need for significant infrastructure development to support widespread adoption. Overcoming these hurdles will be crucial for unlocking the full potential of the liquid hydrogen market.
Liquid Hydrogen Industry Market Size (In Billion)
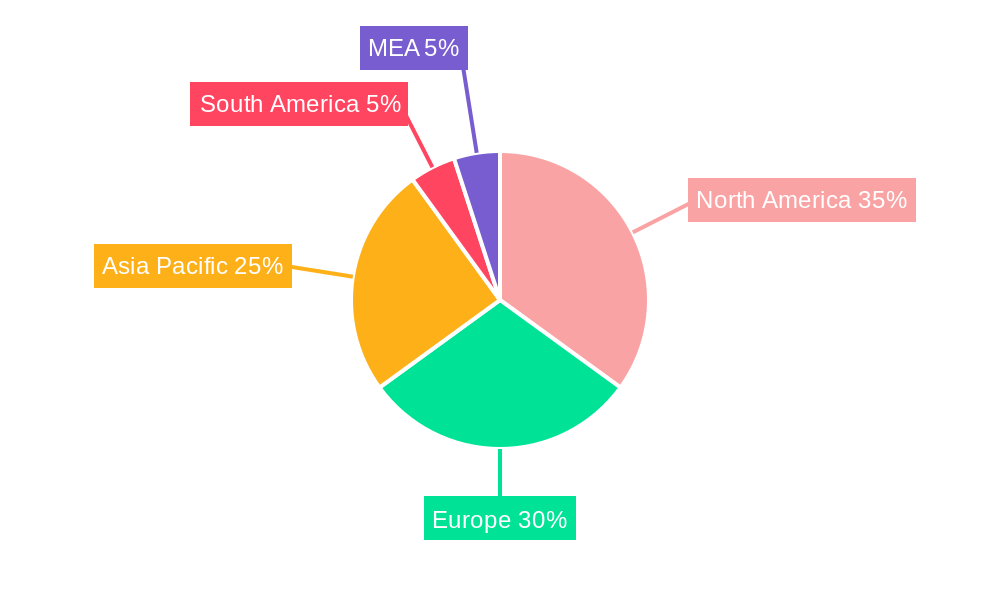
Despite these challenges, the market's trajectory remains positive. Regional analysis reveals strong growth across North America, Europe, and Asia-Pacific, with significant contributions from countries like the United States, Germany, China, and Japan. These regions are characterized by supportive government policies, substantial investments in renewable energy, and a growing focus on reducing carbon emissions. While the "Other End-User Industries" segment currently holds a smaller share, its potential is substantial as various sectors explore the use of liquid hydrogen for various applications. Companies like Linde PLC, Air Products and Chemicals Inc., and Air Liquide are leading the market, driving innovation and expanding the production and distribution networks. However, the competitive landscape is dynamic, with numerous companies entering the market, intensifying competition and driving further innovation. The future of the liquid hydrogen market is bright, with continuous technological advancements and favorable regulatory environments contributing to its sustainable growth in the coming years.
Liquid Hydrogen Industry Company Market Share
Liquid Hydrogen Industry Market Report: 2019-2033
This comprehensive report provides an in-depth analysis of the Liquid Hydrogen Industry, encompassing market dynamics, growth trends, regional dominance, product landscapes, key players, and future outlook. The study period covers 2019-2033, with 2025 as the base and estimated year. This report is crucial for industry professionals, investors, and strategic decision-makers seeking to navigate this rapidly evolving sector.
Parent Market: Green Energy Child Market: Hydrogen Energy Storage and Transportation
Liquid Hydrogen Industry Market Dynamics & Structure
The liquid hydrogen market is characterized by a moderately concentrated structure with key players like Linde PLC, Air Products and Chemicals Inc, and Air Liquide holding significant market share. However, emerging players and technological advancements are fostering increased competition. Technological innovation, driven by advancements in cryogenic storage and transportation, PEM electrolyzers, and renewable energy integration, is a primary growth driver. Stringent environmental regulations globally are pushing adoption, while the lack of standardized infrastructure and high production costs remain key challenges. Mergers and acquisitions (M&A) activity is expected to increase as companies strive for scale and technological expertise.
- Market Concentration: Moderately concentrated, with top 5 players holding xx% market share in 2025.
- Technological Innovation: Advancements in cryogenic storage, PEM electrolyzers, and renewable energy integration are key drivers.
- Regulatory Framework: Stringent emission regulations in various regions are boosting demand.
- Competitive Substitutes: Other energy storage solutions like compressed hydrogen and batteries pose some competition.
- End-User Demographics: Automotive, aerospace, and industrial sectors are primary end-users.
- M&A Trends: An increasing number of M&A deals are expected in the forecast period (xx deals predicted in 2025-2033).
Liquid Hydrogen Industry Growth Trends & Insights
The liquid hydrogen market is witnessing exponential growth, driven by the increasing demand for clean energy solutions and government support for hydrogen initiatives. The market size is projected to reach xx million units by 2033, exhibiting a CAGR of xx% during the forecast period (2025-2033). Early adoption is concentrated in developed nations with robust infrastructure and supportive policies. Technological disruptions, such as advancements in electrolyzer technology and improved storage solutions, are accelerating market penetration. Consumer behavior shifts towards sustainable transportation and industrial processes further boost market expansion. The historical period (2019-2024) showed a steady growth trajectory laying a solid foundation for the projected boom.
Dominant Regions, Countries, or Segments in Liquid Hydrogen Industry
Currently, North America and Europe are leading the liquid hydrogen market due to supportive government policies, substantial investments, and well-established industrial infrastructure. Within these regions, the automotive and aerospace segments are experiencing the fastest growth. Asia-Pacific is expected to exhibit significant growth potential in the coming years, driven by increasing energy demands and government initiatives aimed at reducing carbon emissions. The distribution segment witnesses high adoption of cryogenic tanks due to efficient long-term storage and transportation, while high-pressure tube trailers are gaining traction in short-distance transport due to lower capital expenditure.
- Key Drivers:
- North America: Government incentives, strong industrial base, and focus on hydrogen mobility.
- Europe: Stringent environmental regulations, investments in renewable energy, and growing aerospace sector.
- Asia-Pacific: Rising energy demand, government support for hydrogen technologies, and growing industrial sector.
- Automotive: High growth potential due to increasing demand for fuel-cell electric vehicles.
- Aerospace: Significant demand from space launch vehicles and aircraft propulsion systems.
- Marine: Emerging segment with potential for decarbonizing shipping.
Liquid Hydrogen Industry Product Landscape
The liquid hydrogen industry offers a range of products, including cryogenic storage tanks, high-pressure tube trailers, and specialized handling equipment. Recent innovations focus on improving the efficiency and safety of liquid hydrogen storage and transportation. This includes advanced insulation materials for cryogenic tanks, lightweight and high-strength materials for tube trailers, and automated handling systems to reduce risks. Unique selling propositions are based on factors like superior energy density compared to compressed hydrogen and improved safety features compared to earlier generations of storage technologies.
Key Drivers, Barriers & Challenges in Liquid Hydrogen Industry
Key Drivers:
- Growing demand for clean energy solutions.
- Government support and incentives for hydrogen technologies.
- Technological advancements in production, storage, and transportation.
Challenges and Restraints:
- High production costs and infrastructure development expenses.
- Safety concerns related to hydrogen handling and storage.
- Lack of standardized infrastructure and regulatory frameworks.
- Competition from other energy storage and transportation solutions.
Emerging Opportunities in Liquid Hydrogen Industry
- Expanding into untapped markets such as developing nations with ambitious clean energy targets.
- Developing innovative applications in sectors like power generation and industrial processes.
- Leveraging advancements in materials science and manufacturing to reduce production costs and enhance efficiency.
Growth Accelerators in the Liquid Hydrogen Industry
Technological breakthroughs in electrolyzer technology, coupled with strategic partnerships between energy companies, automakers, and technology providers, will significantly accelerate market growth. Expanding the liquid hydrogen refueling infrastructure and government initiatives promoting the adoption of hydrogen-based technologies will also play crucial roles. Focusing on cost reduction and improved safety through innovations will further boost industry growth.
Key Players Shaping the Liquid Hydrogen Industry Market
- Linde PLC
- Air Products and Chemicals Inc
- Universal Industrial Gases Inc
- Messer Group GMBH
- Iwatani Corporation
- Air Liquide
- Nippon Sanso Holdings Corporation
- Praxair Technology Inc.
- ITM Power
Notable Milestones in Liquid Hydrogen Industry Sector
- May 2022: Air Liquide invested USD 250 million in a liquid hydrogen production facility in Nevada, boosting US capacity significantly.
- Sept 2022: Linde announced the construction of a large-scale green hydrogen electrolyzer in New York, enhancing its green hydrogen production capabilities.
- Mar 2023: Iwatani Corporation and ENEOS Corporation initiated a project to develop cost-effective marine transportation for liquefied hydrogen.
In-Depth Liquid Hydrogen Industry Market Outlook
The future of the liquid hydrogen industry is exceptionally promising. Continued technological advancements, supportive government policies, and the urgent need for clean energy solutions will drive sustained market growth. Strategic partnerships and investments in infrastructure development will play key roles in unlocking the full potential of this sector. Focusing on cost reduction and addressing safety concerns will further enhance market adoption and solidify liquid hydrogen's position as a vital component of a sustainable energy future.
Liquid Hydrogen Industry Segmentation
-
1. Distribution
- 1.1. Cryogenic Tank
- 1.2. High-Pressure Tube Trailers
-
2. End-user Industry
- 2.1. Automotive
- 2.2. Aerospace (including Outer Space)
- 2.3. Marine
- 2.4. Other End-User Industries
Liquid Hydrogen Industry Segmentation By Geography
-
1. Asia Pacific
- 1.1. China
- 1.2. India
- 1.3. Japan
- 1.4. South Korea
- 1.5. Rest of Asia Pacific
-
2. North America
- 2.1. United States
- 2.2. Canada
- 2.3. Mexico
-
3. Europe
- 3.1. Germany
- 3.2. United Kingdom
- 3.3. Italy
- 3.4. France
- 3.5. Rest of Europe
-
4. Rest of the World
- 4.1. South America
- 4.2. Middle East and Africa
Liquid Hydrogen Industry Regional Market Share
Geographic Coverage of Liquid Hydrogen Industry
Liquid Hydrogen Industry REPORT HIGHLIGHTS
| Aspects | Details |
|---|---|
| Study Period | 2020-2034 |
| Base Year | 2025 |
| Estimated Year | 2026 |
| Forecast Period | 2026-2034 |
| Historical Period | 2020-2025 |
| Growth Rate | CAGR of 10.27% from 2020-2034 |
| Segmentation |
|
Table of Contents
- 1. Introduction
- 1.1. Research Scope
- 1.2. Market Segmentation
- 1.3. Research Objective
- 1.4. Definitions and Assumptions
- 2. Executive Summary
- 2.1. Market Snapshot
- 3. Market Dynamics
- 3.1. Market Drivers
- 3.2. Market Restrains
- 3.3. Market Trends
- 3.4. Market Opportunities
- 4. Market Factor Analysis
- 4.1. Porters Five Forces
- 4.1.1. Bargaining Power of Suppliers
- 4.1.2. Bargaining Power of Buyers
- 4.1.3. Threat of New Entrants
- 4.1.4. Threat of Substitutes
- 4.1.5. Competitive Rivalry
- 4.2. PESTEL analysis
- 4.3. BCG Analysis
- 4.3.1. Stars (High Growth, High Market Share)
- 4.3.2. Cash Cows (Low Growth, High Market Share)
- 4.3.3. Question Mark (High Growth, Low Market Share)
- 4.3.4. Dogs (Low Growth, Low Market Share)
- 4.4. Ansoff Matrix Analysis
- 4.5. Supply Chain Analysis
- 4.6. Regulatory Landscape
- 4.7. Current Market Potential and Opportunity Assessment (TAM–SAM–SOM Framework)
- 4.8. VDR Analyst Note
- 4.1. Porters Five Forces
- 5. Market Analysis, Insights and Forecast 2021-2033
- 5.1. Market Analysis, Insights and Forecast - by Distribution
- 5.1.1. Cryogenic Tank
- 5.1.2. High-Pressure Tube Trailers
- 5.2. Market Analysis, Insights and Forecast - by End-user Industry
- 5.2.1. Automotive
- 5.2.2. Aerospace (including Outer Space)
- 5.2.3. Marine
- 5.2.4. Other End-User Industries
- 5.3. Market Analysis, Insights and Forecast - by Region
- 5.3.1. Asia Pacific
- 5.3.2. North America
- 5.3.3. Europe
- 5.3.4. Rest of the World
- 5.1. Market Analysis, Insights and Forecast - by Distribution
- 6. Global Liquid Hydrogen Industry Analysis, Insights and Forecast, 2021-2033
- 6.1. Market Analysis, Insights and Forecast - by Distribution
- 6.1.1. Cryogenic Tank
- 6.1.2. High-Pressure Tube Trailers
- 6.2. Market Analysis, Insights and Forecast - by End-user Industry
- 6.2.1. Automotive
- 6.2.2. Aerospace (including Outer Space)
- 6.2.3. Marine
- 6.2.4. Other End-User Industries
- 6.1. Market Analysis, Insights and Forecast - by Distribution
- 7. Asia Pacific Liquid Hydrogen Industry Analysis, Insights and Forecast, 2021-2033
- 7.1. Market Analysis, Insights and Forecast - by Distribution
- 7.1.1. Cryogenic Tank
- 7.1.2. High-Pressure Tube Trailers
- 7.2. Market Analysis, Insights and Forecast - by End-user Industry
- 7.2.1. Automotive
- 7.2.2. Aerospace (including Outer Space)
- 7.2.3. Marine
- 7.2.4. Other End-User Industries
- 7.1. Market Analysis, Insights and Forecast - by Distribution
- 8. North America Liquid Hydrogen Industry Analysis, Insights and Forecast, 2021-2033
- 8.1. Market Analysis, Insights and Forecast - by Distribution
- 8.1.1. Cryogenic Tank
- 8.1.2. High-Pressure Tube Trailers
- 8.2. Market Analysis, Insights and Forecast - by End-user Industry
- 8.2.1. Automotive
- 8.2.2. Aerospace (including Outer Space)
- 8.2.3. Marine
- 8.2.4. Other End-User Industries
- 8.1. Market Analysis, Insights and Forecast - by Distribution
- 9. Europe Liquid Hydrogen Industry Analysis, Insights and Forecast, 2021-2033
- 9.1. Market Analysis, Insights and Forecast - by Distribution
- 9.1.1. Cryogenic Tank
- 9.1.2. High-Pressure Tube Trailers
- 9.2. Market Analysis, Insights and Forecast - by End-user Industry
- 9.2.1. Automotive
- 9.2.2. Aerospace (including Outer Space)
- 9.2.3. Marine
- 9.2.4. Other End-User Industries
- 9.1. Market Analysis, Insights and Forecast - by Distribution
- 10. Rest of the World Liquid Hydrogen Industry Analysis, Insights and Forecast, 2021-2033
- 10.1. Market Analysis, Insights and Forecast - by Distribution
- 10.1.1. Cryogenic Tank
- 10.1.2. High-Pressure Tube Trailers
- 10.2. Market Analysis, Insights and Forecast - by End-user Industry
- 10.2.1. Automotive
- 10.2.2. Aerospace (including Outer Space)
- 10.2.3. Marine
- 10.2.4. Other End-User Industries
- 10.1. Market Analysis, Insights and Forecast - by Distribution
- 11. Competitive Analysis
- 11.1. Company Profiles
- 11.1.1 Linde PLC
- 11.1.1.1. Company Overview
- 11.1.1.2. Products
- 11.1.1.3. Company Financials
- 11.1.1.4. SWOT Analysis
- 11.1.2 Air Products and Chemicals Inc
- 11.1.2.1. Company Overview
- 11.1.2.2. Products
- 11.1.2.3. Company Financials
- 11.1.2.4. SWOT Analysis
- 11.1.3 Universal Industrial Gases Inc *List Not Exhaustive
- 11.1.3.1. Company Overview
- 11.1.3.2. Products
- 11.1.3.3. Company Financials
- 11.1.3.4. SWOT Analysis
- 11.1.4 Messer Group GMBH
- 11.1.4.1. Company Overview
- 11.1.4.2. Products
- 11.1.4.3. Company Financials
- 11.1.4.4. SWOT Analysis
- 11.1.5 Iwatani Corporation
- 11.1.5.1. Company Overview
- 11.1.5.2. Products
- 11.1.5.3. Company Financials
- 11.1.5.4. SWOT Analysis
- 11.1.6 Air Liquide
- 11.1.6.1. Company Overview
- 11.1.6.2. Products
- 11.1.6.3. Company Financials
- 11.1.6.4. SWOT Analysis
- 11.1.7 Nippon Sanso Holdings Corporation
- 11.1.7.1. Company Overview
- 11.1.7.2. Products
- 11.1.7.3. Company Financials
- 11.1.7.4. SWOT Analysis
- 11.1.8 Nippon Sanso Holdings Corporation
- 11.1.8.1. Company Overview
- 11.1.8.2. Products
- 11.1.8.3. Company Financials
- 11.1.8.4. SWOT Analysis
- 11.1.9 Praxair Technology Inc.
- 11.1.9.1. Company Overview
- 11.1.9.2. Products
- 11.1.9.3. Company Financials
- 11.1.9.4. SWOT Analysis
- 11.1.10 ITM Power
- 11.1.10.1. Company Overview
- 11.1.10.2. Products
- 11.1.10.3. Company Financials
- 11.1.10.4. SWOT Analysis
- 11.1.1 Linde PLC
- 11.2. Market Entropy
- 11.2.1 Company's Key Areas Served
- 11.2.2 Recent Developments
- 11.3. Company Market Share Analysis 2025
- 11.3.1 Top 5 Companies Market Share Analysis
- 11.3.2 Top 3 Companies Market Share Analysis
- 11.4. List of Potential Customers
- 12. Research Methodology
List of Figures
- Figure 1: Global Liquid Hydrogen Industry Revenue Breakdown (Million, %) by Region 2025 & 2033
- Figure 2: Global Liquid Hydrogen Industry Volume Breakdown (kilotons, %) by Region 2025 & 2033
- Figure 3: Asia Pacific Liquid Hydrogen Industry Revenue (Million), by Distribution 2025 & 2033
- Figure 4: Asia Pacific Liquid Hydrogen Industry Volume (kilotons), by Distribution 2025 & 2033
- Figure 5: Asia Pacific Liquid Hydrogen Industry Revenue Share (%), by Distribution 2025 & 2033
- Figure 6: Asia Pacific Liquid Hydrogen Industry Volume Share (%), by Distribution 2025 & 2033
- Figure 7: Asia Pacific Liquid Hydrogen Industry Revenue (Million), by End-user Industry 2025 & 2033
- Figure 8: Asia Pacific Liquid Hydrogen Industry Volume (kilotons), by End-user Industry 2025 & 2033
- Figure 9: Asia Pacific Liquid Hydrogen Industry Revenue Share (%), by End-user Industry 2025 & 2033
- Figure 10: Asia Pacific Liquid Hydrogen Industry Volume Share (%), by End-user Industry 2025 & 2033
- Figure 11: Asia Pacific Liquid Hydrogen Industry Revenue (Million), by Country 2025 & 2033
- Figure 12: Asia Pacific Liquid Hydrogen Industry Volume (kilotons), by Country 2025 & 2033
- Figure 13: Asia Pacific Liquid Hydrogen Industry Revenue Share (%), by Country 2025 & 2033
- Figure 14: Asia Pacific Liquid Hydrogen Industry Volume Share (%), by Country 2025 & 2033
- Figure 15: North America Liquid Hydrogen Industry Revenue (Million), by Distribution 2025 & 2033
- Figure 16: North America Liquid Hydrogen Industry Volume (kilotons), by Distribution 2025 & 2033
- Figure 17: North America Liquid Hydrogen Industry Revenue Share (%), by Distribution 2025 & 2033
- Figure 18: North America Liquid Hydrogen Industry Volume Share (%), by Distribution 2025 & 2033
- Figure 19: North America Liquid Hydrogen Industry Revenue (Million), by End-user Industry 2025 & 2033
- Figure 20: North America Liquid Hydrogen Industry Volume (kilotons), by End-user Industry 2025 & 2033
- Figure 21: North America Liquid Hydrogen Industry Revenue Share (%), by End-user Industry 2025 & 2033
- Figure 22: North America Liquid Hydrogen Industry Volume Share (%), by End-user Industry 2025 & 2033
- Figure 23: North America Liquid Hydrogen Industry Revenue (Million), by Country 2025 & 2033
- Figure 24: North America Liquid Hydrogen Industry Volume (kilotons), by Country 2025 & 2033
- Figure 25: North America Liquid Hydrogen Industry Revenue Share (%), by Country 2025 & 2033
- Figure 26: North America Liquid Hydrogen Industry Volume Share (%), by Country 2025 & 2033
- Figure 27: Europe Liquid Hydrogen Industry Revenue (Million), by Distribution 2025 & 2033
- Figure 28: Europe Liquid Hydrogen Industry Volume (kilotons), by Distribution 2025 & 2033
- Figure 29: Europe Liquid Hydrogen Industry Revenue Share (%), by Distribution 2025 & 2033
- Figure 30: Europe Liquid Hydrogen Industry Volume Share (%), by Distribution 2025 & 2033
- Figure 31: Europe Liquid Hydrogen Industry Revenue (Million), by End-user Industry 2025 & 2033
- Figure 32: Europe Liquid Hydrogen Industry Volume (kilotons), by End-user Industry 2025 & 2033
- Figure 33: Europe Liquid Hydrogen Industry Revenue Share (%), by End-user Industry 2025 & 2033
- Figure 34: Europe Liquid Hydrogen Industry Volume Share (%), by End-user Industry 2025 & 2033
- Figure 35: Europe Liquid Hydrogen Industry Revenue (Million), by Country 2025 & 2033
- Figure 36: Europe Liquid Hydrogen Industry Volume (kilotons), by Country 2025 & 2033
- Figure 37: Europe Liquid Hydrogen Industry Revenue Share (%), by Country 2025 & 2033
- Figure 38: Europe Liquid Hydrogen Industry Volume Share (%), by Country 2025 & 2033
- Figure 39: Rest of the World Liquid Hydrogen Industry Revenue (Million), by Distribution 2025 & 2033
- Figure 40: Rest of the World Liquid Hydrogen Industry Volume (kilotons), by Distribution 2025 & 2033
- Figure 41: Rest of the World Liquid Hydrogen Industry Revenue Share (%), by Distribution 2025 & 2033
- Figure 42: Rest of the World Liquid Hydrogen Industry Volume Share (%), by Distribution 2025 & 2033
- Figure 43: Rest of the World Liquid Hydrogen Industry Revenue (Million), by End-user Industry 2025 & 2033
- Figure 44: Rest of the World Liquid Hydrogen Industry Volume (kilotons), by End-user Industry 2025 & 2033
- Figure 45: Rest of the World Liquid Hydrogen Industry Revenue Share (%), by End-user Industry 2025 & 2033
- Figure 46: Rest of the World Liquid Hydrogen Industry Volume Share (%), by End-user Industry 2025 & 2033
- Figure 47: Rest of the World Liquid Hydrogen Industry Revenue (Million), by Country 2025 & 2033
- Figure 48: Rest of the World Liquid Hydrogen Industry Volume (kilotons), by Country 2025 & 2033
- Figure 49: Rest of the World Liquid Hydrogen Industry Revenue Share (%), by Country 2025 & 2033
- Figure 50: Rest of the World Liquid Hydrogen Industry Volume Share (%), by Country 2025 & 2033
List of Tables
- Table 1: Global Liquid Hydrogen Industry Revenue Million Forecast, by Distribution 2020 & 2033
- Table 2: Global Liquid Hydrogen Industry Volume kilotons Forecast, by Distribution 2020 & 2033
- Table 3: Global Liquid Hydrogen Industry Revenue Million Forecast, by End-user Industry 2020 & 2033
- Table 4: Global Liquid Hydrogen Industry Volume kilotons Forecast, by End-user Industry 2020 & 2033
- Table 5: Global Liquid Hydrogen Industry Revenue Million Forecast, by Region 2020 & 2033
- Table 6: Global Liquid Hydrogen Industry Volume kilotons Forecast, by Region 2020 & 2033
- Table 7: Global Liquid Hydrogen Industry Revenue Million Forecast, by Distribution 2020 & 2033
- Table 8: Global Liquid Hydrogen Industry Volume kilotons Forecast, by Distribution 2020 & 2033
- Table 9: Global Liquid Hydrogen Industry Revenue Million Forecast, by End-user Industry 2020 & 2033
- Table 10: Global Liquid Hydrogen Industry Volume kilotons Forecast, by End-user Industry 2020 & 2033
- Table 11: Global Liquid Hydrogen Industry Revenue Million Forecast, by Country 2020 & 2033
- Table 12: Global Liquid Hydrogen Industry Volume kilotons Forecast, by Country 2020 & 2033
- Table 13: China Liquid Hydrogen Industry Revenue (Million) Forecast, by Application 2020 & 2033
- Table 14: China Liquid Hydrogen Industry Volume (kilotons) Forecast, by Application 2020 & 2033
- Table 15: India Liquid Hydrogen Industry Revenue (Million) Forecast, by Application 2020 & 2033
- Table 16: India Liquid Hydrogen Industry Volume (kilotons) Forecast, by Application 2020 & 2033
- Table 17: Japan Liquid Hydrogen Industry Revenue (Million) Forecast, by Application 2020 & 2033
- Table 18: Japan Liquid Hydrogen Industry Volume (kilotons) Forecast, by Application 2020 & 2033
- Table 19: South Korea Liquid Hydrogen Industry Revenue (Million) Forecast, by Application 2020 & 2033
- Table 20: South Korea Liquid Hydrogen Industry Volume (kilotons) Forecast, by Application 2020 & 2033
- Table 21: Rest of Asia Pacific Liquid Hydrogen Industry Revenue (Million) Forecast, by Application 2020 & 2033
- Table 22: Rest of Asia Pacific Liquid Hydrogen Industry Volume (kilotons) Forecast, by Application 2020 & 2033
- Table 23: Global Liquid Hydrogen Industry Revenue Million Forecast, by Distribution 2020 & 2033
- Table 24: Global Liquid Hydrogen Industry Volume kilotons Forecast, by Distribution 2020 & 2033
- Table 25: Global Liquid Hydrogen Industry Revenue Million Forecast, by End-user Industry 2020 & 2033
- Table 26: Global Liquid Hydrogen Industry Volume kilotons Forecast, by End-user Industry 2020 & 2033
- Table 27: Global Liquid Hydrogen Industry Revenue Million Forecast, by Country 2020 & 2033
- Table 28: Global Liquid Hydrogen Industry Volume kilotons Forecast, by Country 2020 & 2033
- Table 29: United States Liquid Hydrogen Industry Revenue (Million) Forecast, by Application 2020 & 2033
- Table 30: United States Liquid Hydrogen Industry Volume (kilotons) Forecast, by Application 2020 & 2033
- Table 31: Canada Liquid Hydrogen Industry Revenue (Million) Forecast, by Application 2020 & 2033
- Table 32: Canada Liquid Hydrogen Industry Volume (kilotons) Forecast, by Application 2020 & 2033
- Table 33: Mexico Liquid Hydrogen Industry Revenue (Million) Forecast, by Application 2020 & 2033
- Table 34: Mexico Liquid Hydrogen Industry Volume (kilotons) Forecast, by Application 2020 & 2033
- Table 35: Global Liquid Hydrogen Industry Revenue Million Forecast, by Distribution 2020 & 2033
- Table 36: Global Liquid Hydrogen Industry Volume kilotons Forecast, by Distribution 2020 & 2033
- Table 37: Global Liquid Hydrogen Industry Revenue Million Forecast, by End-user Industry 2020 & 2033
- Table 38: Global Liquid Hydrogen Industry Volume kilotons Forecast, by End-user Industry 2020 & 2033
- Table 39: Global Liquid Hydrogen Industry Revenue Million Forecast, by Country 2020 & 2033
- Table 40: Global Liquid Hydrogen Industry Volume kilotons Forecast, by Country 2020 & 2033
- Table 41: Germany Liquid Hydrogen Industry Revenue (Million) Forecast, by Application 2020 & 2033
- Table 42: Germany Liquid Hydrogen Industry Volume (kilotons) Forecast, by Application 2020 & 2033
- Table 43: United Kingdom Liquid Hydrogen Industry Revenue (Million) Forecast, by Application 2020 & 2033
- Table 44: United Kingdom Liquid Hydrogen Industry Volume (kilotons) Forecast, by Application 2020 & 2033
- Table 45: Italy Liquid Hydrogen Industry Revenue (Million) Forecast, by Application 2020 & 2033
- Table 46: Italy Liquid Hydrogen Industry Volume (kilotons) Forecast, by Application 2020 & 2033
- Table 47: France Liquid Hydrogen Industry Revenue (Million) Forecast, by Application 2020 & 2033
- Table 48: France Liquid Hydrogen Industry Volume (kilotons) Forecast, by Application 2020 & 2033
- Table 49: Rest of Europe Liquid Hydrogen Industry Revenue (Million) Forecast, by Application 2020 & 2033
- Table 50: Rest of Europe Liquid Hydrogen Industry Volume (kilotons) Forecast, by Application 2020 & 2033
- Table 51: Global Liquid Hydrogen Industry Revenue Million Forecast, by Distribution 2020 & 2033
- Table 52: Global Liquid Hydrogen Industry Volume kilotons Forecast, by Distribution 2020 & 2033
- Table 53: Global Liquid Hydrogen Industry Revenue Million Forecast, by End-user Industry 2020 & 2033
- Table 54: Global Liquid Hydrogen Industry Volume kilotons Forecast, by End-user Industry 2020 & 2033
- Table 55: Global Liquid Hydrogen Industry Revenue Million Forecast, by Country 2020 & 2033
- Table 56: Global Liquid Hydrogen Industry Volume kilotons Forecast, by Country 2020 & 2033
- Table 57: South America Liquid Hydrogen Industry Revenue (Million) Forecast, by Application 2020 & 2033
- Table 58: South America Liquid Hydrogen Industry Volume (kilotons) Forecast, by Application 2020 & 2033
- Table 59: Middle East and Africa Liquid Hydrogen Industry Revenue (Million) Forecast, by Application 2020 & 2033
- Table 60: Middle East and Africa Liquid Hydrogen Industry Volume (kilotons) Forecast, by Application 2020 & 2033
Frequently Asked Questions
1. What is the projected Compound Annual Growth Rate (CAGR) of the Liquid Hydrogen Industry?
The projected CAGR is approximately 10.27%.
2. Which companies are prominent players in the Liquid Hydrogen Industry?
Key companies in the market include Linde PLC, Air Products and Chemicals Inc, Universal Industrial Gases Inc *List Not Exhaustive, Messer Group GMBH, Iwatani Corporation, Air Liquide, Nippon Sanso Holdings Corporation, Nippon Sanso Holdings Corporation , Praxair Technology Inc. , ITM Power.
3. What are the main segments of the Liquid Hydrogen Industry?
The market segments include Distribution, End-user Industry.
4. Can you provide details about the market size?
The market size is estimated to be USD 38400 Million as of 2022.
5. What are some drivers contributing to market growth?
Growing Demand for Liquid Hydrogen for Space Exploration; Increasing Adoption of Hydrogen Fuel Cell in Commercial Vehicle.
6. What are the notable trends driving market growth?
Aerospace Industry to Dominate the Market.
7. Are there any restraints impacting market growth?
High Cost Associated with Handling and Storage; Other Restraints.
8. Can you provide examples of recent developments in the market?
Mar 2023: Iwatani Corporation and ENEOS Corporation were working to deliver a "Liquefied Hydrogen Supply Chain Commercialization Demonstration Project. The project aims to develop marine transportation technologies of liquefied clean hydrogen, which will help to achieve a hydrogen supply cost of 30 JPY/Nm3 by 2030.
9. What pricing options are available for accessing the report?
Pricing options include single-user, multi-user, and enterprise licenses priced at USD 4750, USD 5250, and USD 8750 respectively.
10. Is the market size provided in terms of value or volume?
The market size is provided in terms of value, measured in Million and volume, measured in kilotons.
11. Are there any specific market keywords associated with the report?
Yes, the market keyword associated with the report is "Liquid Hydrogen Industry," which aids in identifying and referencing the specific market segment covered.
12. How do I determine which pricing option suits my needs best?
The pricing options vary based on user requirements and access needs. Individual users may opt for single-user licenses, while businesses requiring broader access may choose multi-user or enterprise licenses for cost-effective access to the report.
13. Are there any additional resources or data provided in the Liquid Hydrogen Industry report?
While the report offers comprehensive insights, it's advisable to review the specific contents or supplementary materials provided to ascertain if additional resources or data are available.
14. How can I stay updated on further developments or reports in the Liquid Hydrogen Industry?
To stay informed about further developments, trends, and reports in the Liquid Hydrogen Industry, consider subscribing to industry newsletters, following relevant companies and organizations, or regularly checking reputable industry news sources and publications.
Methodology
Step 1 - Identification of Relevant Samples Size from Population Database


Step 2 - Approaches for Defining Global Market Size (Value, Volume* & Price*)

Note*: In applicable scenarios
Step 3 - Data Sources
Primary Research
- Web Analytics
- Survey Reports
- Research Institute
- Latest Research Reports
- Opinion Leaders
Secondary Research
- Annual Reports
- White Paper
- Latest Press Release
- Industry Association
- Paid Database
- Investor Presentations

Step 4 - Data Triangulation
Involves using different sources of information in order to increase the validity of a study
These sources are likely to be stakeholders in a program - participants, other researchers, program staff, other community members, and so on.
Then we put all data in single framework & apply various statistical tools to find out the dynamic on the market.
During the analysis stage, feedback from the stakeholder groups would be compared to determine areas of agreement as well as areas of divergence