

Key Insights
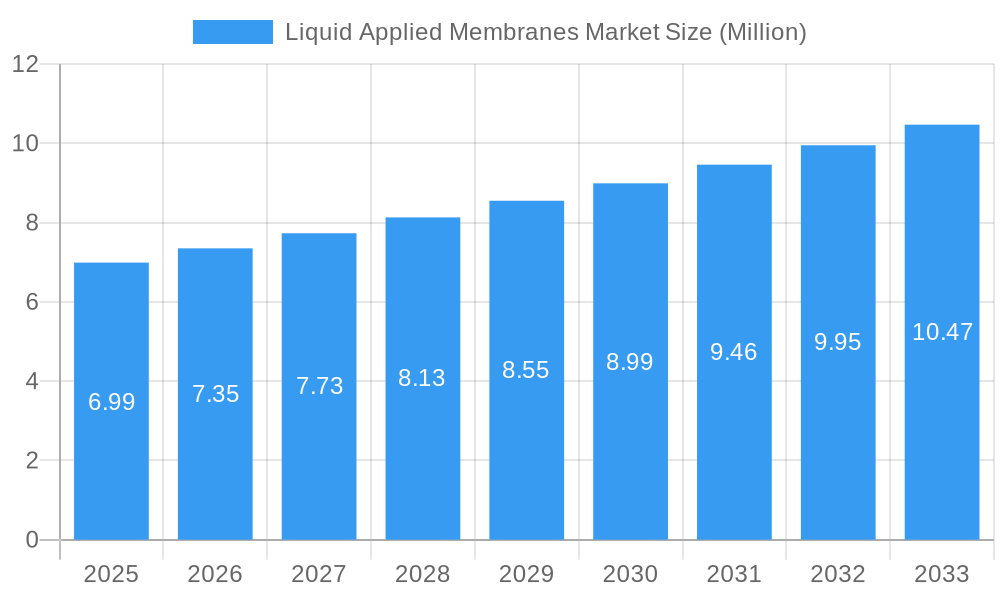
The global Liquid Applied Membranes (LAM) market is poised for robust expansion, projected to reach approximately $6.99 million by the base year of 2025, with an impressive Compound Annual Growth Rate (CAGR) of 5.25%. This growth trajectory is anticipated to continue through the forecast period of 2025-2033, highlighting the increasing demand for advanced waterproofing and protection solutions across diverse applications. The market's dynamism is fueled by several key drivers, including the escalating need for durable and long-lasting waterproofing in construction projects, particularly in emerging economies experiencing rapid urbanization and infrastructure development. Furthermore, stringent building codes and regulations mandating superior waterproofing standards for both residential and commercial structures are significantly bolstering market adoption. Technological advancements leading to the development of more environmentally friendly and high-performance LAM formulations, such as those with enhanced UV resistance, flexibility, and faster curing times, are also playing a pivotal role.
Liquid Applied Membranes Market Market Size (In Million)
The market is segmented by type, with Polyurethane and Cementitious membranes leading in adoption due to their superior performance characteristics and versatility. Applications in roofing, walls, and underground structures are the primary demand generators, driven by the need for effective moisture barrier solutions to prolong the lifespan of buildings and infrastructure. While the market enjoys strong growth, certain restraints exist, such as the initial cost of premium LAM products and the availability of lower-cost alternatives. However, the long-term benefits in terms of reduced maintenance and repair costs often outweigh the initial investment. Geographically, the Asia Pacific region, particularly China and India, is emerging as a significant growth engine due to massive infrastructure investments and a burgeoning construction sector. North America and Europe continue to be mature markets with steady demand driven by renovation and new construction projects adhering to high-performance standards.
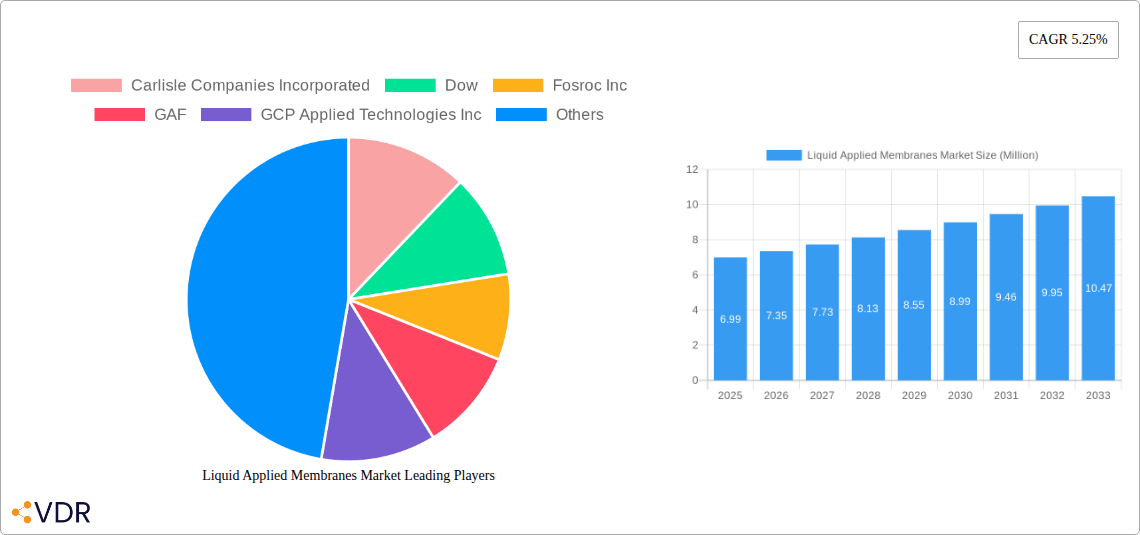
Liquid Applied Membranes Market Company Market Share
Report Description:
This in-depth liquid applied membranes market report offers a strategic analysis of the global market from 2019–2033, with a focus on the base year 2025 and a detailed forecast period of 2025–2033. It meticulously examines the evolving landscape of liquid-applied waterproofing solutions, driven by increasing construction activity, stringent building codes, and the demand for sustainable building materials. The report delves into the parent market of waterproofing solutions and the child market of liquid applied membranes, providing a holistic view of their interdependencies and growth trajectories. Key market segments, including Polyurethane, Cementitious, Bituminous, and Other Types of membranes, are analyzed across critical applications such as Roofing, Walls, Underground and Tunnels, and Other Applications.
This research is indispensable for industry stakeholders seeking to understand market dynamics, identify growth opportunities, and navigate competitive pressures within the waterproofing membranes market. It provides actionable insights into technological advancements, regulatory shifts, and emerging trends that are shaping the future of the liquid membranes industry. The report highlights the strategic initiatives of leading players like Carlisle Companies Incorporated, Dow, Fosroc Inc, GAF, GCP Applied Technologies Inc, Henry Company, Johns Manville (A Berkshire Hathaway Company), KEMPER SYSTEM Ltd, MAPEI SpA, SOPREMA INC, Saint-Gobain Weber, and Sika AG, offering a clear picture of the competitive landscape.
Liquid Applied Membranes Market Market Dynamics & Structure
The global liquid applied membranes market is characterized by a moderate to high level of market concentration, with key players investing heavily in research and development to drive technological innovation. The demand for advanced waterproofing solutions, including high-performance polyurethane membranes and eco-friendly formulations, is a significant innovation driver. Stringent regulatory frameworks mandating enhanced building performance and energy efficiency further propel the adoption of liquid applied membranes. While competitive product substitutes like sheet membranes exist, the seamless application and superior adhesion offered by liquid systems provide a distinct advantage. End-user demographics are shifting towards environmentally conscious developers and contractors seeking durable and sustainable construction materials. Mergers and acquisitions (M&A) are playing a crucial role in market consolidation and expansion. For instance, Sika AG's acquisition of MBCC Group in May 2023 significantly bolstered its presence in the construction chemicals sector, including waterproofing solutions. The M&A trend is expected to continue, leading to further consolidation and enhanced competitive capabilities among market leaders. Barriers to innovation include the high cost of raw materials and the need for specialized application expertise, although ongoing research into new formulations is steadily addressing these challenges.
Liquid Applied Membranes Market Growth Trends & Insights
The liquid applied membranes market is poised for robust growth, driven by a confluence of factors influencing the global construction industry. The market size is projected to expand significantly from an estimated $5,000 million in 2025 to $8,000 million by 2033, exhibiting a compound annual growth rate (CAGR) of approximately 6.2% during the forecast period. Adoption rates of liquid applied membranes are escalating due to their superior performance characteristics, including seamless application, excellent adhesion, and resistance to water ingress. Technological disruptions, such as the development of faster-curing formulations and enhanced UV-resistant membranes, are further stimulating market penetration. Consumer behavior shifts are increasingly favoring sustainable and long-lasting building solutions, aligning perfectly with the benefits offered by advanced liquid membranes. The growing emphasis on green building certifications and energy-efficient construction practices is a key catalyst for market expansion. Furthermore, the increasing frequency of extreme weather events is highlighting the critical need for reliable waterproofing solutions in both new construction and renovation projects, directly impacting the demand for high-performance liquid applied membranes. The shift from traditional waterproofing methods to more advanced and efficient liquid systems underscores the market's dynamic evolution.
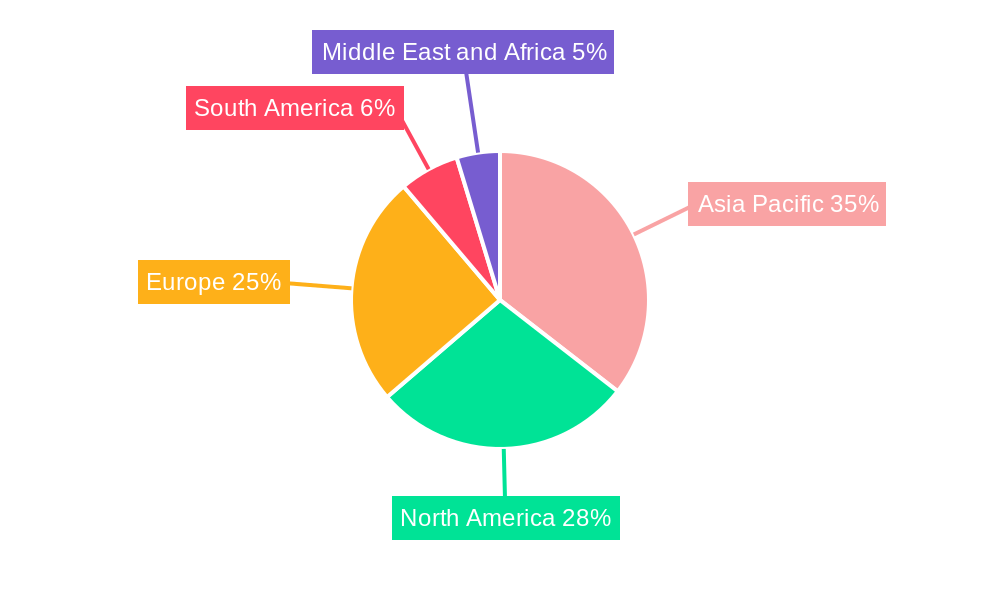
Dominant Regions, Countries, or Segments in Liquid Applied Membranes Market
The Roofing application segment consistently emerges as the dominant driver of growth within the global liquid applied membranes market, accounting for an estimated 45% of the total market share in 2025. This dominance is attributed to the critical need for effective waterproofing in protecting building structures from the elements, significantly extending their lifespan and reducing maintenance costs. The North America region is also a leading market, driven by substantial infrastructure development, stringent building codes that mandate high-performance waterproofing, and a strong emphasis on energy efficiency in construction. Economic policies in countries like the United States and Canada, promoting sustainable building practices and offering incentives for green construction, further bolster the demand for advanced liquid applied membranes. The presence of major construction chemical manufacturers and a well-established distribution network also contribute to North America's leadership.
- Roofing Application Dominance:
- Essential for preventing water damage, mold growth, and structural degradation.
- Growing demand for cool roofing solutions and energy-efficient building envelopes.
- Increasing application in both residential and commercial roofing systems.
- North America's Regional Prowess:
- Significant investments in new construction and retrofitting projects.
- Strict building regulations emphasizing durability and weather resistance.
- High adoption rate of advanced waterproofing technologies, including polyurethane and polymer-modified bituminous membranes.
- Favorable economic conditions and government initiatives supporting sustainable construction.
- Polyurethane Membranes:
- Witnessing substantial growth due to their superior flexibility, durability, and resistance to chemicals.
- Ideal for complex roof geometries and demanding applications.
- Bituminous Membranes:
- Continue to hold a significant market share, especially in cost-sensitive projects, with advancements in polymer modification enhancing their performance.
Liquid Applied Membranes Market Product Landscape
The liquid applied membranes market is witnessing continuous product innovation focused on enhancing performance, sustainability, and ease of application. Manufacturers are developing next-generation polyurethane membranes offering superior crack-bridging capabilities and extended UV resistance, crucial for exposed roofing applications. Innovations in cementitious waterproofing are yielding faster-curing and more flexible formulations, suitable for concrete structures in challenging environments. The market is also seeing advancements in bituminous membranes, with polymer modifications improving their elasticity and adhesion properties. Key selling propositions include seamless, monolithic application, excellent adhesion to various substrates, and robust protection against water ingress and environmental damage. Technological advancements are also driving the development of low-VOC and water-based liquid membranes, aligning with growing environmental regulations and market demand for sustainable building materials.
Key Drivers, Barriers & Challenges in Liquid Applied Membranes Market
The liquid applied membranes market is propelled by several key drivers, including the escalating demand for durable and long-lasting waterproofing solutions in the construction sector, stringent building codes mandating advanced weatherproofing, and a growing global awareness of the importance of energy-efficient buildings. Technological advancements in membrane formulations, offering enhanced performance and quicker application times, are also significant growth accelerators. The increasing investments in infrastructure development worldwide further fuel the demand for reliable waterproofing systems.
Conversely, the market faces several challenges and restraints. Fluctuations in raw material prices, particularly for petrochemical-based polymers, can impact manufacturing costs and product pricing. The requirement for specialized equipment and skilled labor for proper application can also act as a barrier to adoption, especially in less developed regions. Intense competition among manufacturers, coupled with the presence of alternative waterproofing technologies, necessitates continuous innovation and competitive pricing strategies. Supply chain disruptions and evolving environmental regulations can also pose significant hurdles for market participants.
Emerging Opportunities in Liquid Applied Membranes Market
Emerging opportunities in the liquid applied membranes market lie in the growing demand for green building solutions and the increasing adoption of liquid membranes in the renovation and refurbishment of existing structures. Untapped markets in developing economies with burgeoning construction sectors present significant growth potential. Innovative applications, such as their use in precast concrete elements and as protective coatings for bridges and tunnels, are gaining traction. Evolving consumer preferences for aesthetically pleasing and highly functional building envelopes are also driving demand for membranes with enhanced durability and weather resistance. Furthermore, the development of self-healing or "smart" liquid membranes with integrated sensors for leak detection represents a promising future avenue.
Growth Accelerators in the Liquid Applied Membranes Market Industry
Several factors are acting as significant growth accelerators for the liquid applied membranes industry. Breakthroughs in polymer science are leading to the development of more resilient, adaptable, and environmentally friendly membrane formulations. Strategic partnerships between raw material suppliers, membrane manufacturers, and construction companies are fostering innovation and market penetration. The increasing global focus on sustainable construction practices and the implementation of stricter building performance standards are creating a favorable environment for the widespread adoption of liquid applied membranes. Moreover, market expansion strategies targeting underserved regions and the development of specialized liquid membrane solutions for niche applications are further contributing to the industry's upward trajectory.
Key Players Shaping the Liquid Applied Membranes Market Market
- Carlisle Companies Incorporated
- Dow
- Fosroc Inc
- GAF
- GCP Applied Technologies Inc
- Henry Company
- Johns Manville (A Berkshire Hathaway Company)
- KEMPER SYSTEM Ltd
- MAPEI SpA
- SOPREMA INC
- Saint-Gobain Weber
- Sika AG
Notable Milestones in Liquid Applied Membranes Market Sector
- May 2023: Sika AG completed the acquisition of MBCC Group, a global supplier of construction chemicals, significantly strengthening its market position in waterproofing and construction solutions.
In-Depth Liquid Applied Membranes Market Market Outlook
The liquid applied membranes market is set for sustained and significant growth, driven by an confluence of macro-economic trends and technological advancements. The increasing global emphasis on infrastructure development, coupled with stringent building regulations designed to enhance structural integrity and energy efficiency, will continue to fuel demand for high-performance waterproofing solutions. Innovations in material science, particularly the development of more sustainable and adaptable liquid membrane formulations, will further unlock new market opportunities. Strategic collaborations and M&A activities are expected to shape a more consolidated yet dynamic competitive landscape, driving efficiency and innovation. The rising awareness of the long-term economic and environmental benefits of robust waterproofing will solidify the position of liquid applied membranes as an indispensable component of modern construction.
Liquid Applied Membranes Market Segmentation
-
1. Type
- 1.1. Polyurethane
- 1.2. Cementitious
- 1.3. Bituminous
- 1.4. Other Types
-
2. Application
- 2.1. Roofing
- 2.2. Walls
- 2.3. Underground and Tunnels
- 2.4. Other Applications
Liquid Applied Membranes Market Segmentation By Geography
-
1. Asia Pacific
- 1.1. China
- 1.2. India
- 1.3. Japan
- 1.4. South Korea
- 1.5. ASEAN Countries
- 1.6. Rest of Asia Pacific
-
2. North America
- 2.1. United States
- 2.2. Canada
- 2.3. Mexico
-
3. Europe
- 3.1. Germany
- 3.2. United Kingdom
- 3.3. Italy
- 3.4. France
- 3.5. Russia
- 3.6. Rest of Europe
-
4. South America
- 4.1. Brazil
- 4.2. Argentina
- 4.3. Rest of South America
-
5. Middle East and Africa
- 5.1. Saudi Arabia
- 5.2. South Africa
- 5.3. Rest of Middle East and Africa
Liquid Applied Membranes Market Regional Market Share
Geographic Coverage of Liquid Applied Membranes Market
Liquid Applied Membranes Market REPORT HIGHLIGHTS
| Aspects | Details |
|---|---|
| Study Period | 2020-2034 |
| Base Year | 2025 |
| Estimated Year | 2026 |
| Forecast Period | 2026-2034 |
| Historical Period | 2020-2025 |
| Growth Rate | CAGR of 5.25% from 2020-2034 |
| Segmentation |
|
Table of Contents
- 1. Introduction
- 1.1. Research Scope
- 1.2. Market Segmentation
- 1.3. Research Objective
- 1.4. Definitions and Assumptions
- 2. Executive Summary
- 2.1. Market Snapshot
- 3. Market Dynamics
- 3.1. Market Drivers
- 3.2. Market Restrains
- 3.3. Market Trends
- 3.4. Market Opportunities
- 4. Market Factor Analysis
- 4.1. Porters Five Forces
- 4.1.1. Bargaining Power of Suppliers
- 4.1.2. Bargaining Power of Buyers
- 4.1.3. Threat of New Entrants
- 4.1.4. Threat of Substitutes
- 4.1.5. Competitive Rivalry
- 4.2. PESTEL analysis
- 4.3. BCG Analysis
- 4.3.1. Stars (High Growth, High Market Share)
- 4.3.2. Cash Cows (Low Growth, High Market Share)
- 4.3.3. Question Mark (High Growth, Low Market Share)
- 4.3.4. Dogs (Low Growth, Low Market Share)
- 4.4. Ansoff Matrix Analysis
- 4.5. Supply Chain Analysis
- 4.6. Regulatory Landscape
- 4.7. Current Market Potential and Opportunity Assessment (TAM–SAM–SOM Framework)
- 4.8. VDR Analyst Note
- 4.1. Porters Five Forces
- 5. Market Analysis, Insights and Forecast 2021-2033
- 5.1. Market Analysis, Insights and Forecast - by Type
- 5.1.1. Polyurethane
- 5.1.2. Cementitious
- 5.1.3. Bituminous
- 5.1.4. Other Types
- 5.2. Market Analysis, Insights and Forecast - by Application
- 5.2.1. Roofing
- 5.2.2. Walls
- 5.2.3. Underground and Tunnels
- 5.2.4. Other Applications
- 5.3. Market Analysis, Insights and Forecast - by Region
- 5.3.1. Asia Pacific
- 5.3.2. North America
- 5.3.3. Europe
- 5.3.4. South America
- 5.3.5. Middle East and Africa
- 5.1. Market Analysis, Insights and Forecast - by Type
- 6. Global Liquid Applied Membranes Market Analysis, Insights and Forecast, 2021-2033
- 6.1. Market Analysis, Insights and Forecast - by Type
- 6.1.1. Polyurethane
- 6.1.2. Cementitious
- 6.1.3. Bituminous
- 6.1.4. Other Types
- 6.2. Market Analysis, Insights and Forecast - by Application
- 6.2.1. Roofing
- 6.2.2. Walls
- 6.2.3. Underground and Tunnels
- 6.2.4. Other Applications
- 6.1. Market Analysis, Insights and Forecast - by Type
- 7. Asia Pacific Liquid Applied Membranes Market Analysis, Insights and Forecast, 2021-2033
- 7.1. Market Analysis, Insights and Forecast - by Type
- 7.1.1. Polyurethane
- 7.1.2. Cementitious
- 7.1.3. Bituminous
- 7.1.4. Other Types
- 7.2. Market Analysis, Insights and Forecast - by Application
- 7.2.1. Roofing
- 7.2.2. Walls
- 7.2.3. Underground and Tunnels
- 7.2.4. Other Applications
- 7.1. Market Analysis, Insights and Forecast - by Type
- 8. North America Liquid Applied Membranes Market Analysis, Insights and Forecast, 2021-2033
- 8.1. Market Analysis, Insights and Forecast - by Type
- 8.1.1. Polyurethane
- 8.1.2. Cementitious
- 8.1.3. Bituminous
- 8.1.4. Other Types
- 8.2. Market Analysis, Insights and Forecast - by Application
- 8.2.1. Roofing
- 8.2.2. Walls
- 8.2.3. Underground and Tunnels
- 8.2.4. Other Applications
- 8.1. Market Analysis, Insights and Forecast - by Type
- 9. Europe Liquid Applied Membranes Market Analysis, Insights and Forecast, 2021-2033
- 9.1. Market Analysis, Insights and Forecast - by Type
- 9.1.1. Polyurethane
- 9.1.2. Cementitious
- 9.1.3. Bituminous
- 9.1.4. Other Types
- 9.2. Market Analysis, Insights and Forecast - by Application
- 9.2.1. Roofing
- 9.2.2. Walls
- 9.2.3. Underground and Tunnels
- 9.2.4. Other Applications
- 9.1. Market Analysis, Insights and Forecast - by Type
- 10. South America Liquid Applied Membranes Market Analysis, Insights and Forecast, 2021-2033
- 10.1. Market Analysis, Insights and Forecast - by Type
- 10.1.1. Polyurethane
- 10.1.2. Cementitious
- 10.1.3. Bituminous
- 10.1.4. Other Types
- 10.2. Market Analysis, Insights and Forecast - by Application
- 10.2.1. Roofing
- 10.2.2. Walls
- 10.2.3. Underground and Tunnels
- 10.2.4. Other Applications
- 10.1. Market Analysis, Insights and Forecast - by Type
- 11. Middle East and Africa Liquid Applied Membranes Market Analysis, Insights and Forecast, 2021-2033
- 11.1. Market Analysis, Insights and Forecast - by Type
- 11.1.1. Polyurethane
- 11.1.2. Cementitious
- 11.1.3. Bituminous
- 11.1.4. Other Types
- 11.2. Market Analysis, Insights and Forecast - by Application
- 11.2.1. Roofing
- 11.2.2. Walls
- 11.2.3. Underground and Tunnels
- 11.2.4. Other Applications
- 11.1. Market Analysis, Insights and Forecast - by Type
- 12. Competitive Analysis
- 12.1. Company Profiles
- 12.1.1 Carlisle Companies Incorporated
- 12.1.1.1. Company Overview
- 12.1.1.2. Products
- 12.1.1.3. Company Financials
- 12.1.1.4. SWOT Analysis
- 12.1.2 Dow
- 12.1.2.1. Company Overview
- 12.1.2.2. Products
- 12.1.2.3. Company Financials
- 12.1.2.4. SWOT Analysis
- 12.1.3 Fosroc Inc
- 12.1.3.1. Company Overview
- 12.1.3.2. Products
- 12.1.3.3. Company Financials
- 12.1.3.4. SWOT Analysis
- 12.1.4 GAF
- 12.1.4.1. Company Overview
- 12.1.4.2. Products
- 12.1.4.3. Company Financials
- 12.1.4.4. SWOT Analysis
- 12.1.5 GCP Applied Technologies Inc
- 12.1.5.1. Company Overview
- 12.1.5.2. Products
- 12.1.5.3. Company Financials
- 12.1.5.4. SWOT Analysis
- 12.1.6 Henry Company
- 12.1.6.1. Company Overview
- 12.1.6.2. Products
- 12.1.6.3. Company Financials
- 12.1.6.4. SWOT Analysis
- 12.1.7 Johns Manville (A Berkshire Hathaway Company)
- 12.1.7.1. Company Overview
- 12.1.7.2. Products
- 12.1.7.3. Company Financials
- 12.1.7.4. SWOT Analysis
- 12.1.8 KEMPER SYSTEM Ltd
- 12.1.8.1. Company Overview
- 12.1.8.2. Products
- 12.1.8.3. Company Financials
- 12.1.8.4. SWOT Analysis
- 12.1.9 MAPEI SpA
- 12.1.9.1. Company Overview
- 12.1.9.2. Products
- 12.1.9.3. Company Financials
- 12.1.9.4. SWOT Analysis
- 12.1.10 SOPREMA INC
- 12.1.10.1. Company Overview
- 12.1.10.2. Products
- 12.1.10.3. Company Financials
- 12.1.10.4. SWOT Analysis
- 12.1.11 Saint-Gobain Weber
- 12.1.11.1. Company Overview
- 12.1.11.2. Products
- 12.1.11.3. Company Financials
- 12.1.11.4. SWOT Analysis
- 12.1.12 Sika AG*List Not Exhaustive
- 12.1.12.1. Company Overview
- 12.1.12.2. Products
- 12.1.12.3. Company Financials
- 12.1.12.4. SWOT Analysis
- 12.1.1 Carlisle Companies Incorporated
- 12.2. Market Entropy
- 12.2.1 Company's Key Areas Served
- 12.2.2 Recent Developments
- 12.3. Company Market Share Analysis 2025
- 12.3.1 Top 5 Companies Market Share Analysis
- 12.3.2 Top 3 Companies Market Share Analysis
- 12.4. List of Potential Customers
- 13. Research Methodology
List of Figures
- Figure 1: Global Liquid Applied Membranes Market Revenue Breakdown (Million, %) by Region 2025 & 2033
- Figure 2: Global Liquid Applied Membranes Market Volume Breakdown (Billion, %) by Region 2025 & 2033
- Figure 3: Asia Pacific Liquid Applied Membranes Market Revenue (Million), by Type 2025 & 2033
- Figure 4: Asia Pacific Liquid Applied Membranes Market Volume (Billion), by Type 2025 & 2033
- Figure 5: Asia Pacific Liquid Applied Membranes Market Revenue Share (%), by Type 2025 & 2033
- Figure 6: Asia Pacific Liquid Applied Membranes Market Volume Share (%), by Type 2025 & 2033
- Figure 7: Asia Pacific Liquid Applied Membranes Market Revenue (Million), by Application 2025 & 2033
- Figure 8: Asia Pacific Liquid Applied Membranes Market Volume (Billion), by Application 2025 & 2033
- Figure 9: Asia Pacific Liquid Applied Membranes Market Revenue Share (%), by Application 2025 & 2033
- Figure 10: Asia Pacific Liquid Applied Membranes Market Volume Share (%), by Application 2025 & 2033
- Figure 11: Asia Pacific Liquid Applied Membranes Market Revenue (Million), by Country 2025 & 2033
- Figure 12: Asia Pacific Liquid Applied Membranes Market Volume (Billion), by Country 2025 & 2033
- Figure 13: Asia Pacific Liquid Applied Membranes Market Revenue Share (%), by Country 2025 & 2033
- Figure 14: Asia Pacific Liquid Applied Membranes Market Volume Share (%), by Country 2025 & 2033
- Figure 15: North America Liquid Applied Membranes Market Revenue (Million), by Type 2025 & 2033
- Figure 16: North America Liquid Applied Membranes Market Volume (Billion), by Type 2025 & 2033
- Figure 17: North America Liquid Applied Membranes Market Revenue Share (%), by Type 2025 & 2033
- Figure 18: North America Liquid Applied Membranes Market Volume Share (%), by Type 2025 & 2033
- Figure 19: North America Liquid Applied Membranes Market Revenue (Million), by Application 2025 & 2033
- Figure 20: North America Liquid Applied Membranes Market Volume (Billion), by Application 2025 & 2033
- Figure 21: North America Liquid Applied Membranes Market Revenue Share (%), by Application 2025 & 2033
- Figure 22: North America Liquid Applied Membranes Market Volume Share (%), by Application 2025 & 2033
- Figure 23: North America Liquid Applied Membranes Market Revenue (Million), by Country 2025 & 2033
- Figure 24: North America Liquid Applied Membranes Market Volume (Billion), by Country 2025 & 2033
- Figure 25: North America Liquid Applied Membranes Market Revenue Share (%), by Country 2025 & 2033
- Figure 26: North America Liquid Applied Membranes Market Volume Share (%), by Country 2025 & 2033
- Figure 27: Europe Liquid Applied Membranes Market Revenue (Million), by Type 2025 & 2033
- Figure 28: Europe Liquid Applied Membranes Market Volume (Billion), by Type 2025 & 2033
- Figure 29: Europe Liquid Applied Membranes Market Revenue Share (%), by Type 2025 & 2033
- Figure 30: Europe Liquid Applied Membranes Market Volume Share (%), by Type 2025 & 2033
- Figure 31: Europe Liquid Applied Membranes Market Revenue (Million), by Application 2025 & 2033
- Figure 32: Europe Liquid Applied Membranes Market Volume (Billion), by Application 2025 & 2033
- Figure 33: Europe Liquid Applied Membranes Market Revenue Share (%), by Application 2025 & 2033
- Figure 34: Europe Liquid Applied Membranes Market Volume Share (%), by Application 2025 & 2033
- Figure 35: Europe Liquid Applied Membranes Market Revenue (Million), by Country 2025 & 2033
- Figure 36: Europe Liquid Applied Membranes Market Volume (Billion), by Country 2025 & 2033
- Figure 37: Europe Liquid Applied Membranes Market Revenue Share (%), by Country 2025 & 2033
- Figure 38: Europe Liquid Applied Membranes Market Volume Share (%), by Country 2025 & 2033
- Figure 39: South America Liquid Applied Membranes Market Revenue (Million), by Type 2025 & 2033
- Figure 40: South America Liquid Applied Membranes Market Volume (Billion), by Type 2025 & 2033
- Figure 41: South America Liquid Applied Membranes Market Revenue Share (%), by Type 2025 & 2033
- Figure 42: South America Liquid Applied Membranes Market Volume Share (%), by Type 2025 & 2033
- Figure 43: South America Liquid Applied Membranes Market Revenue (Million), by Application 2025 & 2033
- Figure 44: South America Liquid Applied Membranes Market Volume (Billion), by Application 2025 & 2033
- Figure 45: South America Liquid Applied Membranes Market Revenue Share (%), by Application 2025 & 2033
- Figure 46: South America Liquid Applied Membranes Market Volume Share (%), by Application 2025 & 2033
- Figure 47: South America Liquid Applied Membranes Market Revenue (Million), by Country 2025 & 2033
- Figure 48: South America Liquid Applied Membranes Market Volume (Billion), by Country 2025 & 2033
- Figure 49: South America Liquid Applied Membranes Market Revenue Share (%), by Country 2025 & 2033
- Figure 50: South America Liquid Applied Membranes Market Volume Share (%), by Country 2025 & 2033
- Figure 51: Middle East and Africa Liquid Applied Membranes Market Revenue (Million), by Type 2025 & 2033
- Figure 52: Middle East and Africa Liquid Applied Membranes Market Volume (Billion), by Type 2025 & 2033
- Figure 53: Middle East and Africa Liquid Applied Membranes Market Revenue Share (%), by Type 2025 & 2033
- Figure 54: Middle East and Africa Liquid Applied Membranes Market Volume Share (%), by Type 2025 & 2033
- Figure 55: Middle East and Africa Liquid Applied Membranes Market Revenue (Million), by Application 2025 & 2033
- Figure 56: Middle East and Africa Liquid Applied Membranes Market Volume (Billion), by Application 2025 & 2033
- Figure 57: Middle East and Africa Liquid Applied Membranes Market Revenue Share (%), by Application 2025 & 2033
- Figure 58: Middle East and Africa Liquid Applied Membranes Market Volume Share (%), by Application 2025 & 2033
- Figure 59: Middle East and Africa Liquid Applied Membranes Market Revenue (Million), by Country 2025 & 2033
- Figure 60: Middle East and Africa Liquid Applied Membranes Market Volume (Billion), by Country 2025 & 2033
- Figure 61: Middle East and Africa Liquid Applied Membranes Market Revenue Share (%), by Country 2025 & 2033
- Figure 62: Middle East and Africa Liquid Applied Membranes Market Volume Share (%), by Country 2025 & 2033
List of Tables
- Table 1: Global Liquid Applied Membranes Market Revenue Million Forecast, by Type 2020 & 2033
- Table 2: Global Liquid Applied Membranes Market Volume Billion Forecast, by Type 2020 & 2033
- Table 3: Global Liquid Applied Membranes Market Revenue Million Forecast, by Application 2020 & 2033
- Table 4: Global Liquid Applied Membranes Market Volume Billion Forecast, by Application 2020 & 2033
- Table 5: Global Liquid Applied Membranes Market Revenue Million Forecast, by Region 2020 & 2033
- Table 6: Global Liquid Applied Membranes Market Volume Billion Forecast, by Region 2020 & 2033
- Table 7: Global Liquid Applied Membranes Market Revenue Million Forecast, by Type 2020 & 2033
- Table 8: Global Liquid Applied Membranes Market Volume Billion Forecast, by Type 2020 & 2033
- Table 9: Global Liquid Applied Membranes Market Revenue Million Forecast, by Application 2020 & 2033
- Table 10: Global Liquid Applied Membranes Market Volume Billion Forecast, by Application 2020 & 2033
- Table 11: Global Liquid Applied Membranes Market Revenue Million Forecast, by Country 2020 & 2033
- Table 12: Global Liquid Applied Membranes Market Volume Billion Forecast, by Country 2020 & 2033
- Table 13: China Liquid Applied Membranes Market Revenue (Million) Forecast, by Application 2020 & 2033
- Table 14: China Liquid Applied Membranes Market Volume (Billion) Forecast, by Application 2020 & 2033
- Table 15: India Liquid Applied Membranes Market Revenue (Million) Forecast, by Application 2020 & 2033
- Table 16: India Liquid Applied Membranes Market Volume (Billion) Forecast, by Application 2020 & 2033
- Table 17: Japan Liquid Applied Membranes Market Revenue (Million) Forecast, by Application 2020 & 2033
- Table 18: Japan Liquid Applied Membranes Market Volume (Billion) Forecast, by Application 2020 & 2033
- Table 19: South Korea Liquid Applied Membranes Market Revenue (Million) Forecast, by Application 2020 & 2033
- Table 20: South Korea Liquid Applied Membranes Market Volume (Billion) Forecast, by Application 2020 & 2033
- Table 21: ASEAN Countries Liquid Applied Membranes Market Revenue (Million) Forecast, by Application 2020 & 2033
- Table 22: ASEAN Countries Liquid Applied Membranes Market Volume (Billion) Forecast, by Application 2020 & 2033
- Table 23: Rest of Asia Pacific Liquid Applied Membranes Market Revenue (Million) Forecast, by Application 2020 & 2033
- Table 24: Rest of Asia Pacific Liquid Applied Membranes Market Volume (Billion) Forecast, by Application 2020 & 2033
- Table 25: Global Liquid Applied Membranes Market Revenue Million Forecast, by Type 2020 & 2033
- Table 26: Global Liquid Applied Membranes Market Volume Billion Forecast, by Type 2020 & 2033
- Table 27: Global Liquid Applied Membranes Market Revenue Million Forecast, by Application 2020 & 2033
- Table 28: Global Liquid Applied Membranes Market Volume Billion Forecast, by Application 2020 & 2033
- Table 29: Global Liquid Applied Membranes Market Revenue Million Forecast, by Country 2020 & 2033
- Table 30: Global Liquid Applied Membranes Market Volume Billion Forecast, by Country 2020 & 2033
- Table 31: United States Liquid Applied Membranes Market Revenue (Million) Forecast, by Application 2020 & 2033
- Table 32: United States Liquid Applied Membranes Market Volume (Billion) Forecast, by Application 2020 & 2033
- Table 33: Canada Liquid Applied Membranes Market Revenue (Million) Forecast, by Application 2020 & 2033
- Table 34: Canada Liquid Applied Membranes Market Volume (Billion) Forecast, by Application 2020 & 2033
- Table 35: Mexico Liquid Applied Membranes Market Revenue (Million) Forecast, by Application 2020 & 2033
- Table 36: Mexico Liquid Applied Membranes Market Volume (Billion) Forecast, by Application 2020 & 2033
- Table 37: Global Liquid Applied Membranes Market Revenue Million Forecast, by Type 2020 & 2033
- Table 38: Global Liquid Applied Membranes Market Volume Billion Forecast, by Type 2020 & 2033
- Table 39: Global Liquid Applied Membranes Market Revenue Million Forecast, by Application 2020 & 2033
- Table 40: Global Liquid Applied Membranes Market Volume Billion Forecast, by Application 2020 & 2033
- Table 41: Global Liquid Applied Membranes Market Revenue Million Forecast, by Country 2020 & 2033
- Table 42: Global Liquid Applied Membranes Market Volume Billion Forecast, by Country 2020 & 2033
- Table 43: Germany Liquid Applied Membranes Market Revenue (Million) Forecast, by Application 2020 & 2033
- Table 44: Germany Liquid Applied Membranes Market Volume (Billion) Forecast, by Application 2020 & 2033
- Table 45: United Kingdom Liquid Applied Membranes Market Revenue (Million) Forecast, by Application 2020 & 2033
- Table 46: United Kingdom Liquid Applied Membranes Market Volume (Billion) Forecast, by Application 2020 & 2033
- Table 47: Italy Liquid Applied Membranes Market Revenue (Million) Forecast, by Application 2020 & 2033
- Table 48: Italy Liquid Applied Membranes Market Volume (Billion) Forecast, by Application 2020 & 2033
- Table 49: France Liquid Applied Membranes Market Revenue (Million) Forecast, by Application 2020 & 2033
- Table 50: France Liquid Applied Membranes Market Volume (Billion) Forecast, by Application 2020 & 2033
- Table 51: Russia Liquid Applied Membranes Market Revenue (Million) Forecast, by Application 2020 & 2033
- Table 52: Russia Liquid Applied Membranes Market Volume (Billion) Forecast, by Application 2020 & 2033
- Table 53: Rest of Europe Liquid Applied Membranes Market Revenue (Million) Forecast, by Application 2020 & 2033
- Table 54: Rest of Europe Liquid Applied Membranes Market Volume (Billion) Forecast, by Application 2020 & 2033
- Table 55: Global Liquid Applied Membranes Market Revenue Million Forecast, by Type 2020 & 2033
- Table 56: Global Liquid Applied Membranes Market Volume Billion Forecast, by Type 2020 & 2033
- Table 57: Global Liquid Applied Membranes Market Revenue Million Forecast, by Application 2020 & 2033
- Table 58: Global Liquid Applied Membranes Market Volume Billion Forecast, by Application 2020 & 2033
- Table 59: Global Liquid Applied Membranes Market Revenue Million Forecast, by Country 2020 & 2033
- Table 60: Global Liquid Applied Membranes Market Volume Billion Forecast, by Country 2020 & 2033
- Table 61: Brazil Liquid Applied Membranes Market Revenue (Million) Forecast, by Application 2020 & 2033
- Table 62: Brazil Liquid Applied Membranes Market Volume (Billion) Forecast, by Application 2020 & 2033
- Table 63: Argentina Liquid Applied Membranes Market Revenue (Million) Forecast, by Application 2020 & 2033
- Table 64: Argentina Liquid Applied Membranes Market Volume (Billion) Forecast, by Application 2020 & 2033
- Table 65: Rest of South America Liquid Applied Membranes Market Revenue (Million) Forecast, by Application 2020 & 2033
- Table 66: Rest of South America Liquid Applied Membranes Market Volume (Billion) Forecast, by Application 2020 & 2033
- Table 67: Global Liquid Applied Membranes Market Revenue Million Forecast, by Type 2020 & 2033
- Table 68: Global Liquid Applied Membranes Market Volume Billion Forecast, by Type 2020 & 2033
- Table 69: Global Liquid Applied Membranes Market Revenue Million Forecast, by Application 2020 & 2033
- Table 70: Global Liquid Applied Membranes Market Volume Billion Forecast, by Application 2020 & 2033
- Table 71: Global Liquid Applied Membranes Market Revenue Million Forecast, by Country 2020 & 2033
- Table 72: Global Liquid Applied Membranes Market Volume Billion Forecast, by Country 2020 & 2033
- Table 73: Saudi Arabia Liquid Applied Membranes Market Revenue (Million) Forecast, by Application 2020 & 2033
- Table 74: Saudi Arabia Liquid Applied Membranes Market Volume (Billion) Forecast, by Application 2020 & 2033
- Table 75: South Africa Liquid Applied Membranes Market Revenue (Million) Forecast, by Application 2020 & 2033
- Table 76: South Africa Liquid Applied Membranes Market Volume (Billion) Forecast, by Application 2020 & 2033
- Table 77: Rest of Middle East and Africa Liquid Applied Membranes Market Revenue (Million) Forecast, by Application 2020 & 2033
- Table 78: Rest of Middle East and Africa Liquid Applied Membranes Market Volume (Billion) Forecast, by Application 2020 & 2033
Frequently Asked Questions
1. What is the projected Compound Annual Growth Rate (CAGR) of the Liquid Applied Membranes Market?
The projected CAGR is approximately 5.25%.
2. Which companies are prominent players in the Liquid Applied Membranes Market?
Key companies in the market include Carlisle Companies Incorporated, Dow, Fosroc Inc, GAF, GCP Applied Technologies Inc, Henry Company, Johns Manville (A Berkshire Hathaway Company), KEMPER SYSTEM Ltd, MAPEI SpA, SOPREMA INC, Saint-Gobain Weber, Sika AG*List Not Exhaustive.
3. What are the main segments of the Liquid Applied Membranes Market?
The market segments include Type, Application.
4. Can you provide details about the market size?
The market size is estimated to be USD 6.99 Million as of 2022.
5. What are some drivers contributing to market growth?
Growing Usage of Waterproofing Membranes to Maintain Longevity of Buildings; Increasing Benefits of Liquid Applied Membranes Resulting in Cost-effective Construction; Growing Infrastructural and Commercial Projects in Emerging Economies.
6. What are the notable trends driving market growth?
Roofing Application is Expected to Dominate the Market.
7. Are there any restraints impacting market growth?
Growing Usage of Waterproofing Membranes to Maintain Longevity of Buildings; Increasing Benefits of Liquid Applied Membranes Resulting in Cost-effective Construction; Growing Infrastructural and Commercial Projects in Emerging Economies.
8. Can you provide examples of recent developments in the market?
May 2023: Sika AG completed the acquisition of MBCC Group. MBCC Group is a global supplier of construction chemicals.
9. What pricing options are available for accessing the report?
Pricing options include single-user, multi-user, and enterprise licenses priced at USD 4750, USD 5250, and USD 8750 respectively.
10. Is the market size provided in terms of value or volume?
The market size is provided in terms of value, measured in Million and volume, measured in Billion.
11. Are there any specific market keywords associated with the report?
Yes, the market keyword associated with the report is "Liquid Applied Membranes Market," which aids in identifying and referencing the specific market segment covered.
12. How do I determine which pricing option suits my needs best?
The pricing options vary based on user requirements and access needs. Individual users may opt for single-user licenses, while businesses requiring broader access may choose multi-user or enterprise licenses for cost-effective access to the report.
13. Are there any additional resources or data provided in the Liquid Applied Membranes Market report?
While the report offers comprehensive insights, it's advisable to review the specific contents or supplementary materials provided to ascertain if additional resources or data are available.
14. How can I stay updated on further developments or reports in the Liquid Applied Membranes Market?
To stay informed about further developments, trends, and reports in the Liquid Applied Membranes Market, consider subscribing to industry newsletters, following relevant companies and organizations, or regularly checking reputable industry news sources and publications.
Methodology
Step 1 - Identification of Relevant Samples Size from Population Database


Step 2 - Approaches for Defining Global Market Size (Value, Volume* & Price*)

Note*: In applicable scenarios
Step 3 - Data Sources
Primary Research
- Web Analytics
- Survey Reports
- Research Institute
- Latest Research Reports
- Opinion Leaders
Secondary Research
- Annual Reports
- White Paper
- Latest Press Release
- Industry Association
- Paid Database
- Investor Presentations

Step 4 - Data Triangulation
Involves using different sources of information in order to increase the validity of a study
These sources are likely to be stakeholders in a program - participants, other researchers, program staff, other community members, and so on.
Then we put all data in single framework & apply various statistical tools to find out the dynamic on the market.
During the analysis stage, feedback from the stakeholder groups would be compared to determine areas of agreement as well as areas of divergence